• 概述
  • 评论
  • 评论

Cool volumes

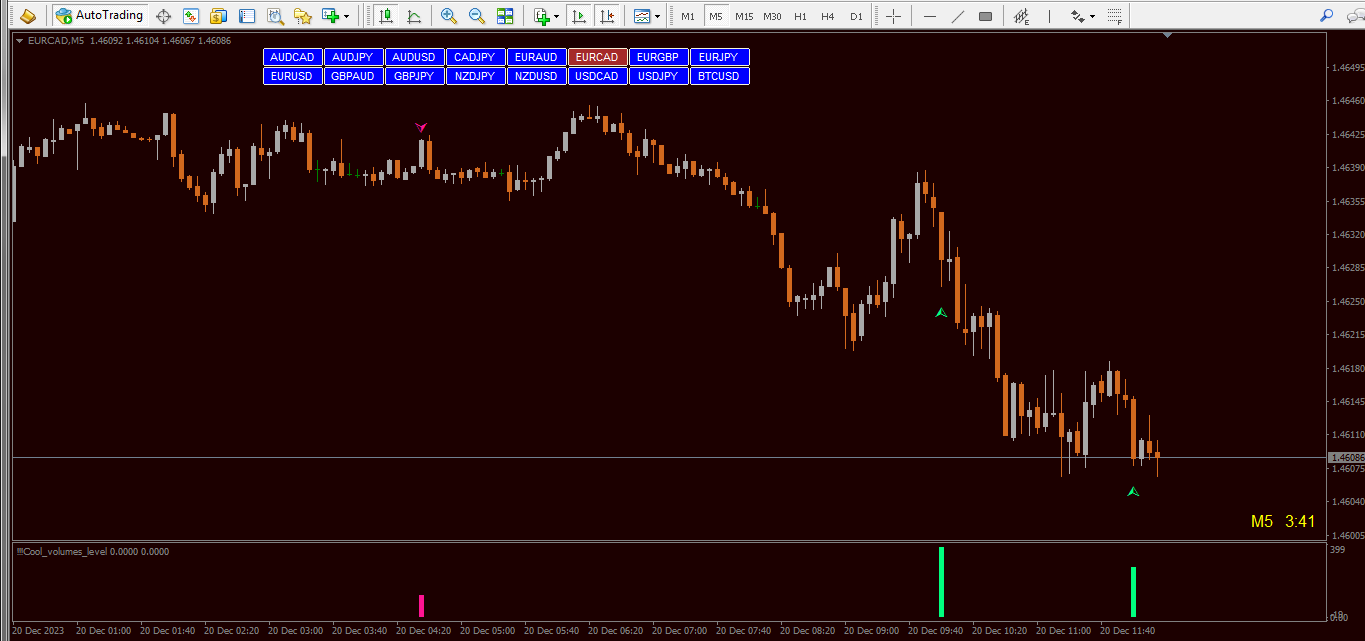
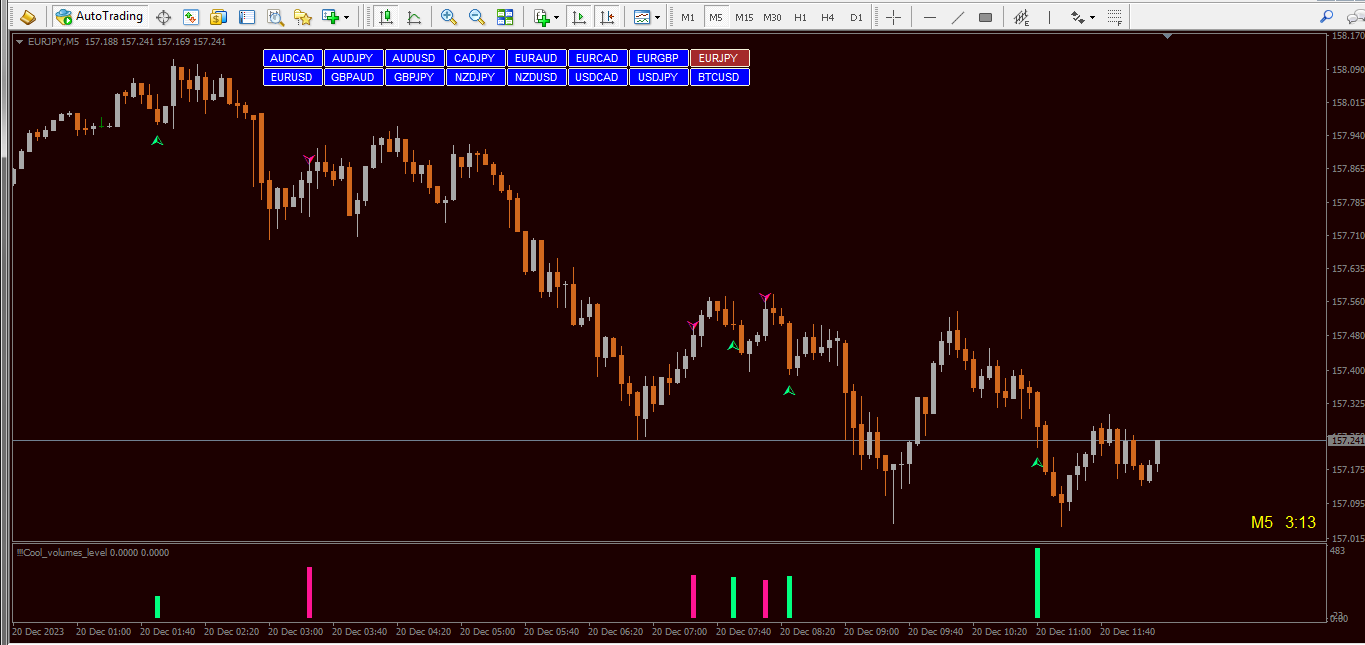
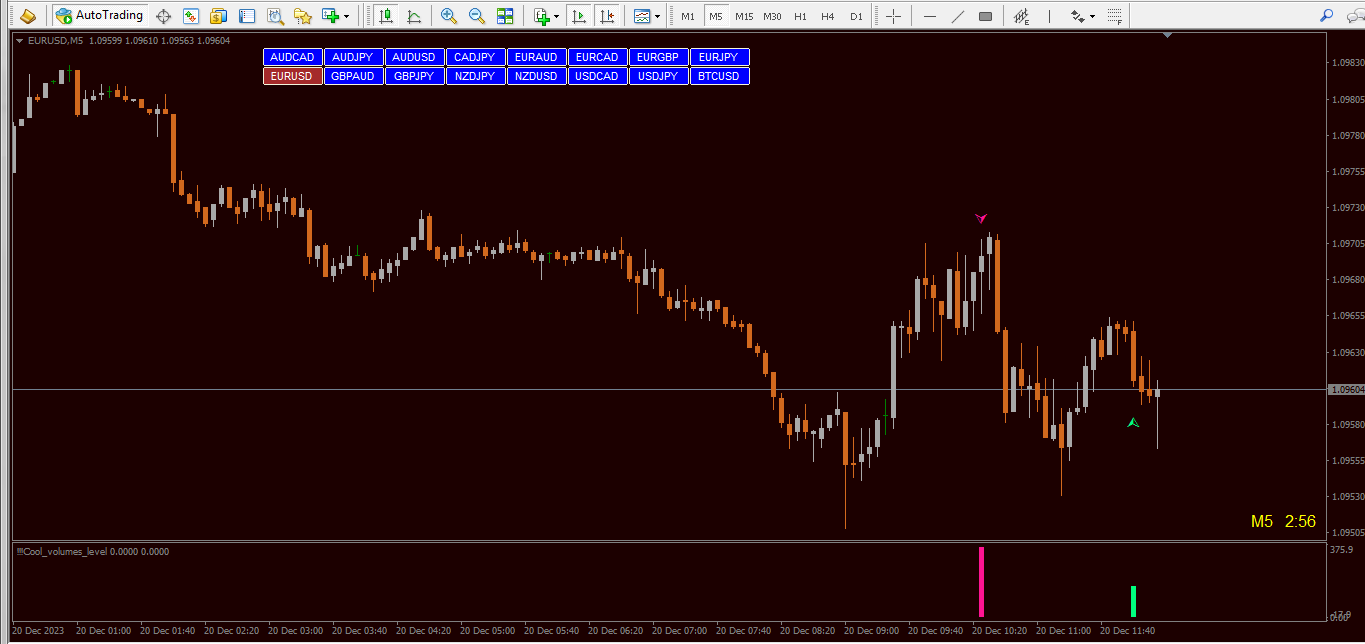
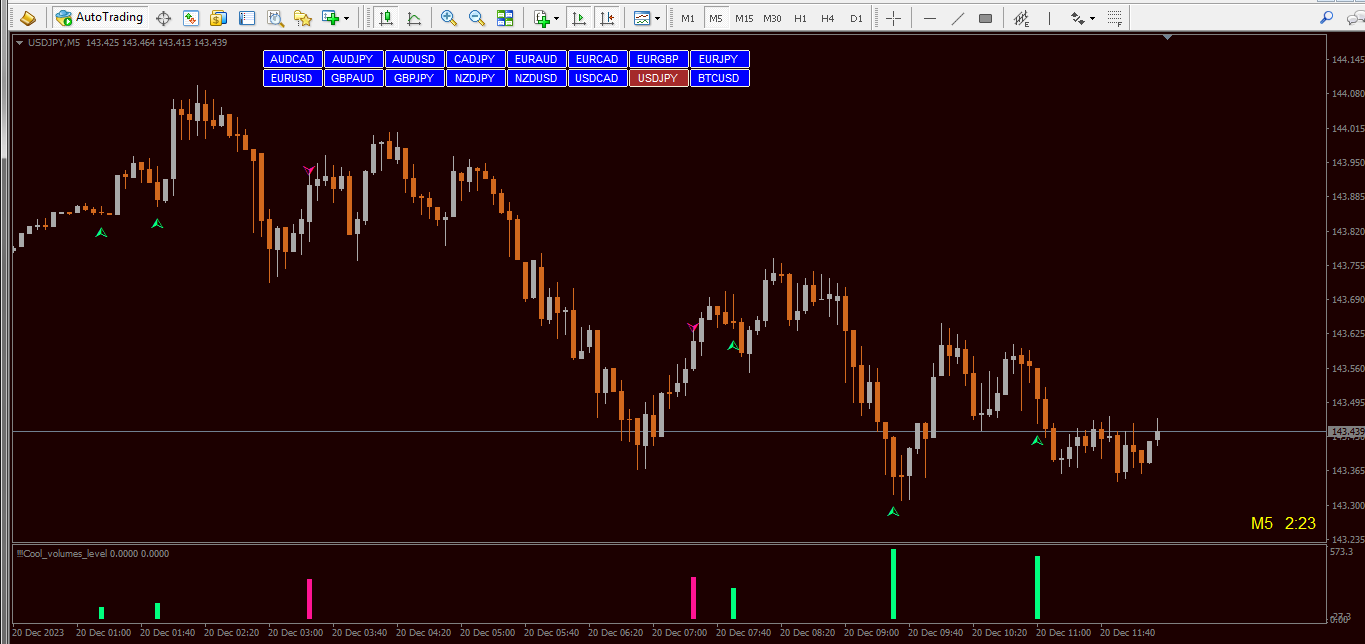
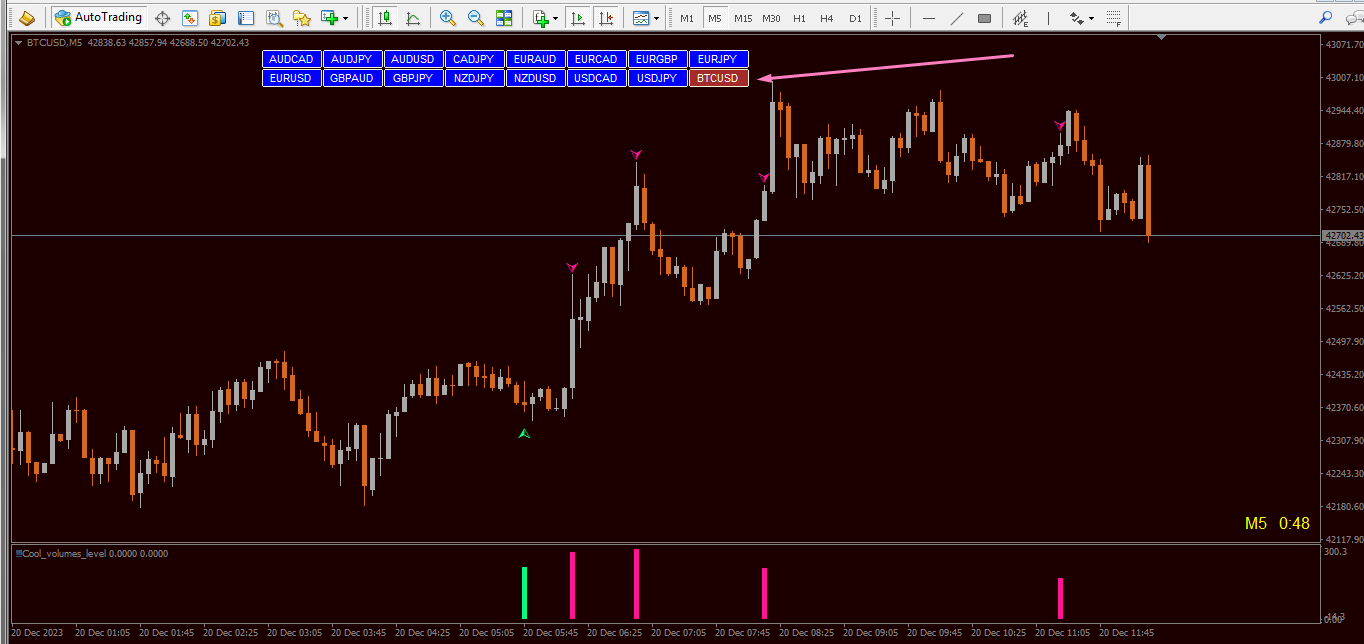
箭头指示器"冷量"是基于mt4上的滴答量。

指标本身跟踪在一段时间内买入或卖出的数量(时间框架选择)。 当卖家或买家的交易量出现异常过剩时,它会发出卖出或买入的信号。

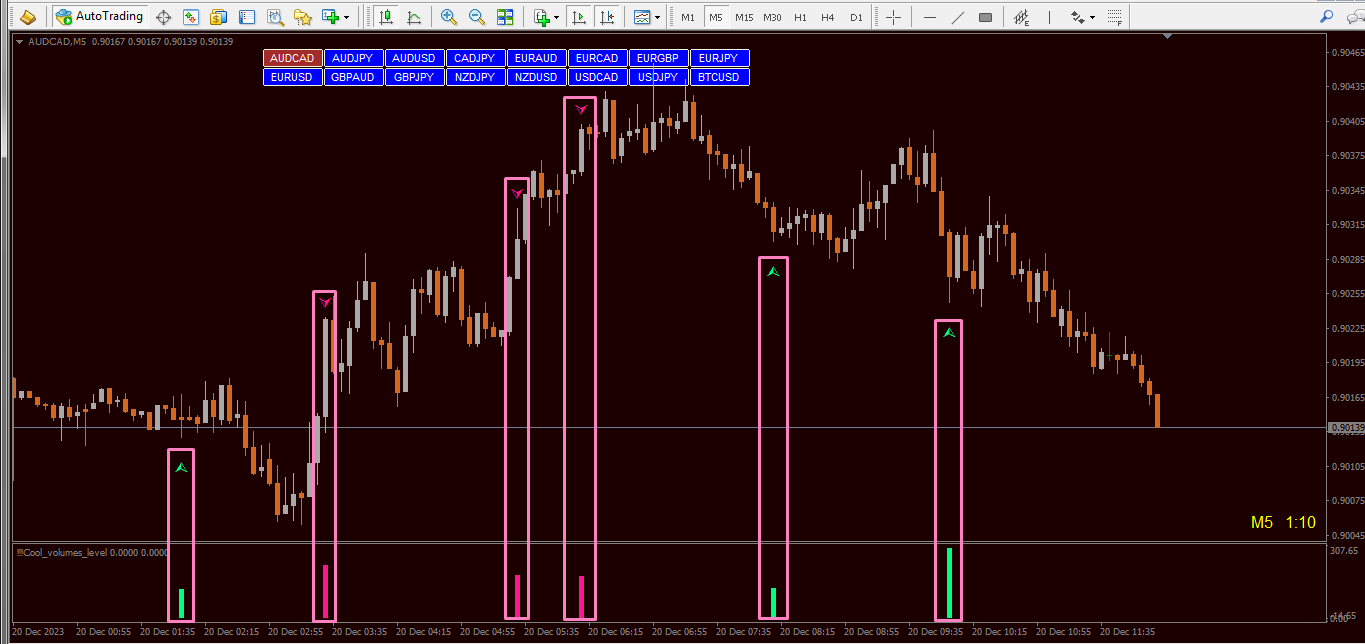
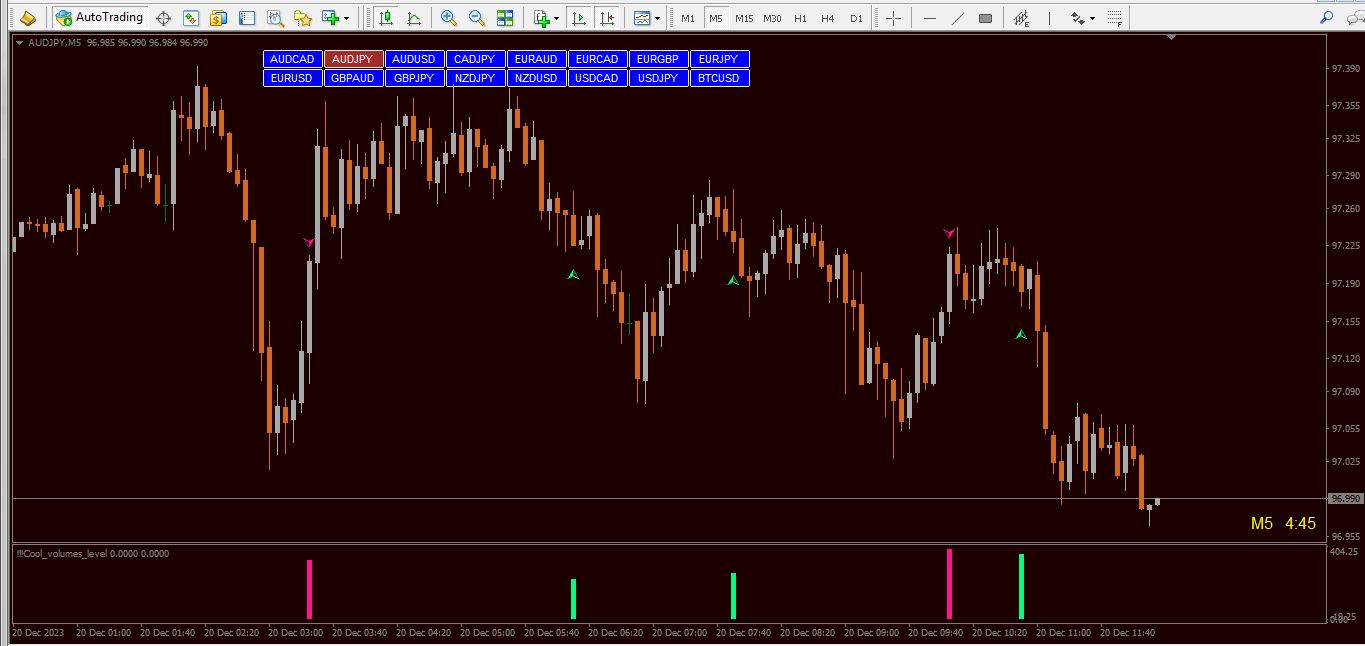
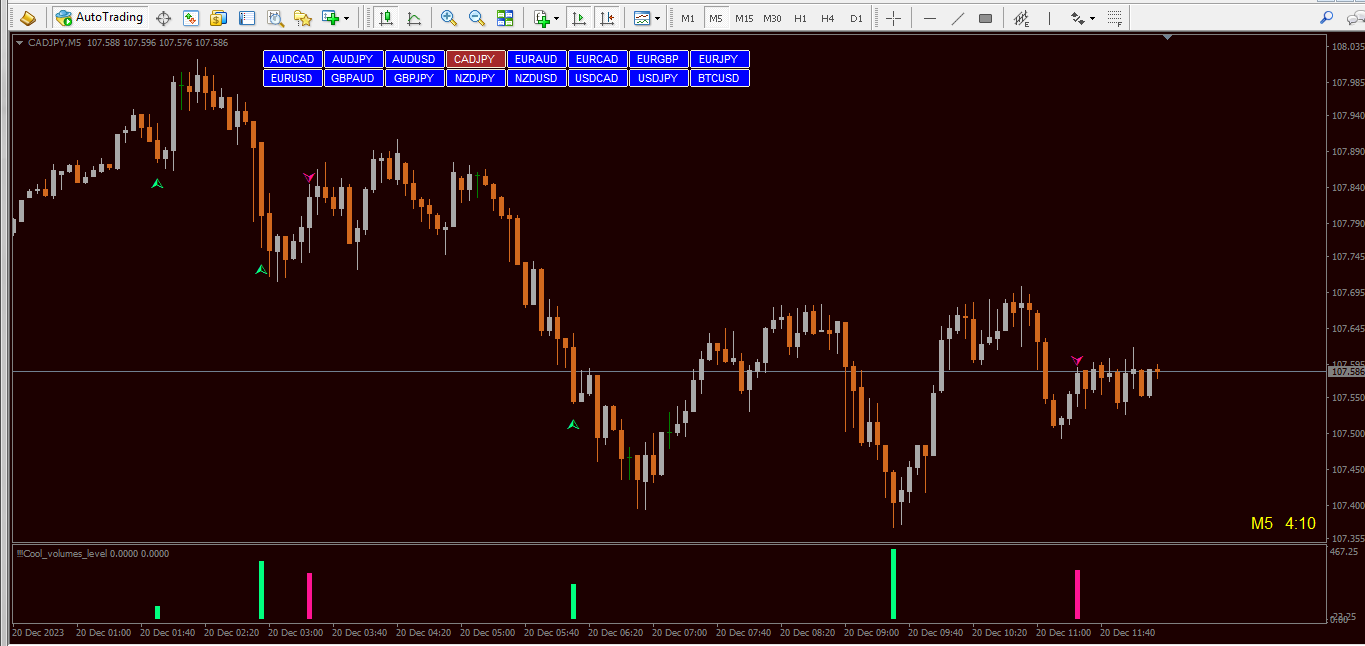
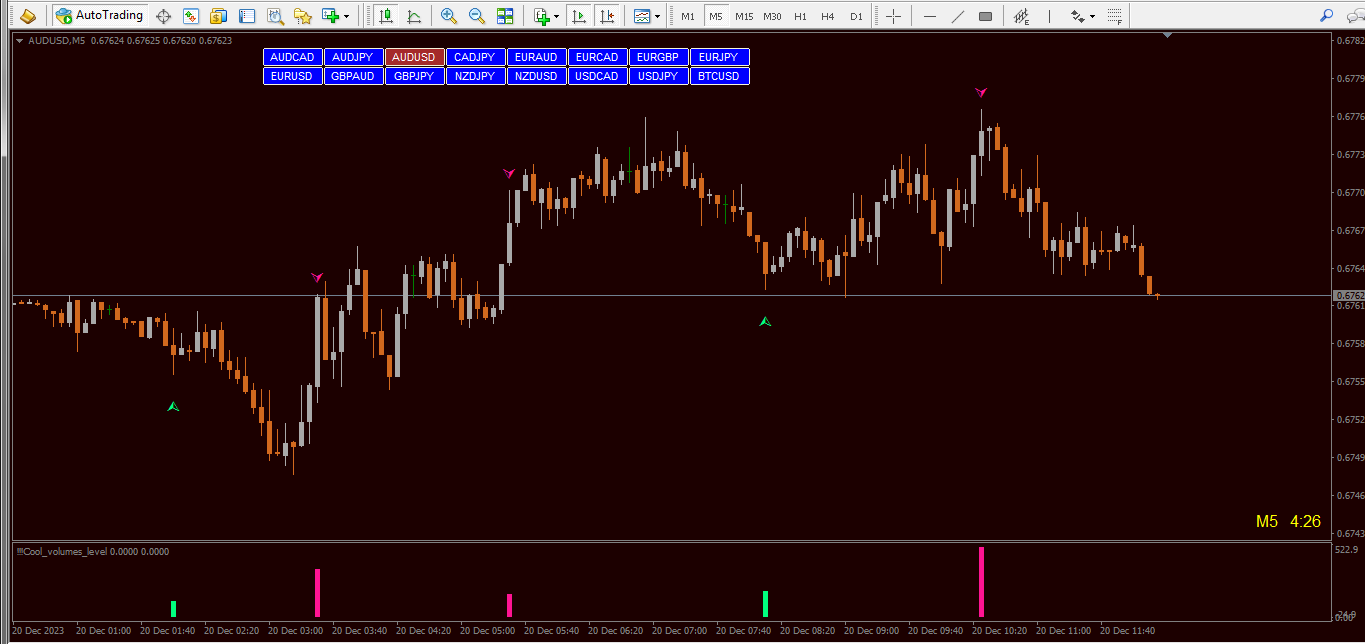
在较低的窗口中绘制彩色直方图,其中绿色显示了当时买家的主导地位,这意味着在这个价格范围内可能立即逆转增加。 相反,红色表示卖方的优势,这意味着潜在的立即向下逆转。

此外,为了方便视觉感知,箭头已直接添加到主图表窗口。

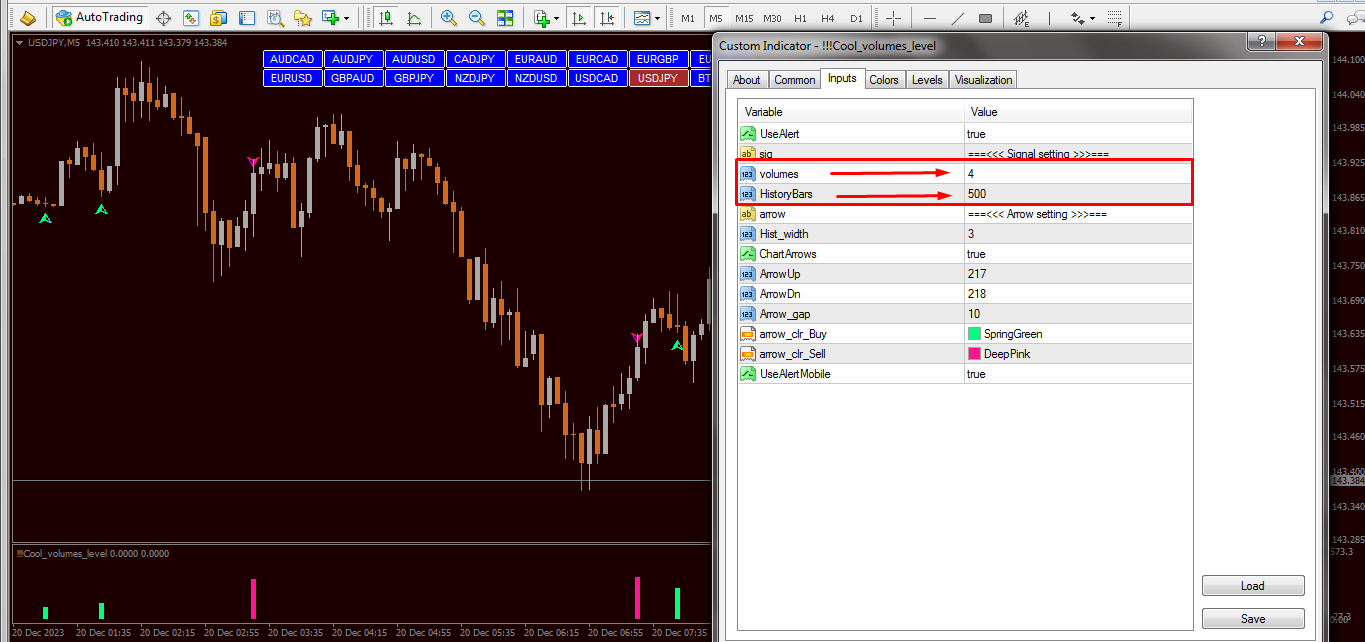
为了方便用户,外部变量包含信号频率及其在历史记录(HistoryBars)上的编号的设置变量。 但不建议将值设置为1000以上。 更多的这将减慢您的终端的性能。

同样在"===<<箭头设置>>>==="部分中,您可以自己设置任何箭头和直方图参数。 直方图的厚度,箭头与蜡烛的距离,箭头代码及其颜色。 或者您可以完全禁用主图表窗口上的箭头。

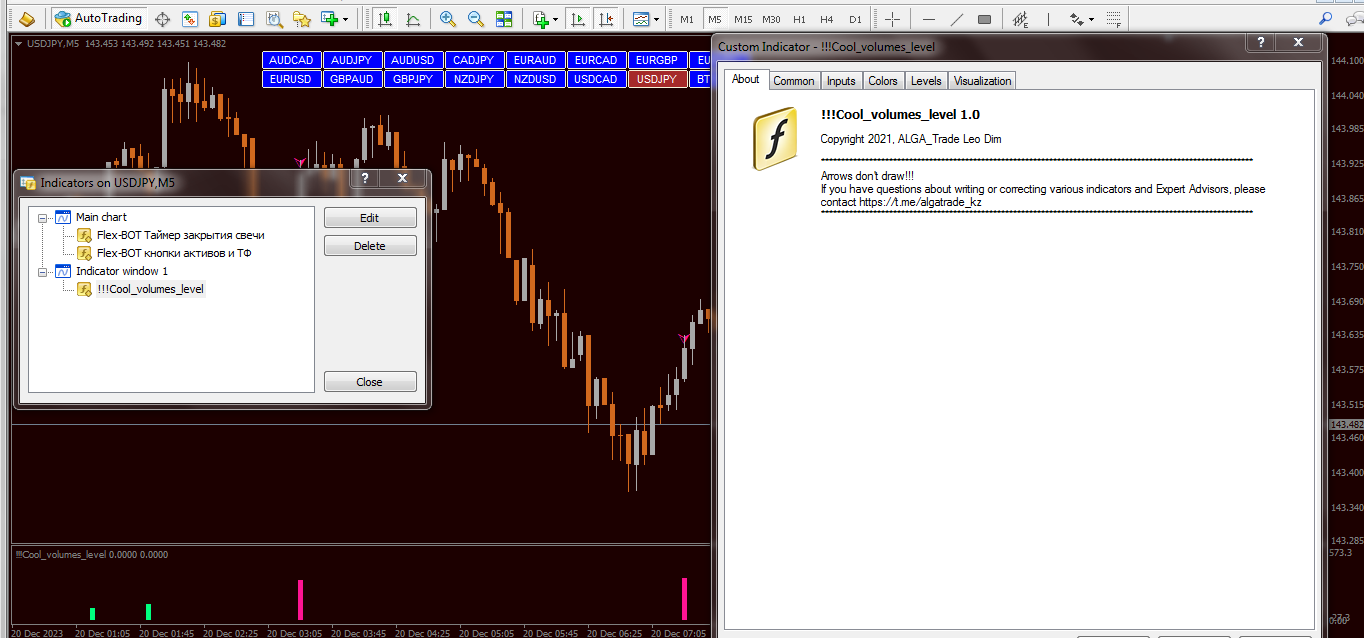
箭头和信号根本不画。 即使在更改时间框架和更新终端之后。 但有必要在固定直方图和箭头后进入交易!
祝大家好运!!!
推荐产品
Description A colored universal multicurrency/multi-symbol indicator  MACD Classic Smart that consists of two indicators: MACD Line Smart and MACD Histo Smart. Both indicators are based on double or triple moving average . Comparing to the standard MACD Classic this indicator is more sensitive to what allows generating advance signals. he indicator may be used with any broker, irrespective of the name of the financial instrument since it is necessary to manually enter the name as an input parame
ChopEx
Joshua Iyanuoluw Adedeji
The Chop Exploder indicator is a custom indicator that has a long run, tight chop, short chop, and band colour. This indicator has MT4 alert notification,mobile notification, and email notification. The default indexing of all arrays and indicator buffers is left to right. The index of the first element is always equal to zero. Thus, the very first element of an array or indicator buffer with index 0 is by default on the extreme left position, while the last element is on the extreme right posit
Forex Relative Performance indicator This indicator calculates the relative strength of major currencies against the US dollar. The basic idea behind this indicator is "to buy strong currency and to sell weak currency". This indicator allows you to quickly identify the best forex pair to trade according to your trading style (Intraday, Scalping, Swing, or Long Term) For demo testing please use MT5 version, because MT4 does not support Multicurrency Testing https://www.mql5.com/en/market/product/
Introducing our innovative trading indicator, designed to transform the way you analyze price movements. The [Indicator Name] goes beyond traditional methods by dynamically drawing two distinct trends on the chart. The space between these trends acts as a unique reflection surface, providing valuable insights into potential market reversals and trend continuations. Key Features: Dual Trend Drawing: Automatically draws two trends on the chart, creating a visually distinctive analysis of price mov
Fibo Linear Channel
Igor Semyonov
4 (1)
Colored indicator of the linear channel based on the Fibonacci sequence. It is used for making trading decisions and analyzing market sentiment. The channel boundaries represent strong support/resistance levels, as they are the Fibonacci proportion levels. Users can select the number of displayed lines of channel boundaries on the chart by means of the input parameters. Attaching multiple instances of the indicator to the chart with different calculation periods leads to displaying a system of c
Garuda Empire
Ellan Dirgantara Tholkhah
The Garuda Empire - Binary Options Experience the epitome of trading synthesis where the time-honored Ichimoku methodology seamlessly intertwines with revered Western indicators. It's a harmonious blend—Europe shaking hands with Japan, a true testament to the power of global financial collaboration. With years of dedicated observation and analysis, I've come to one conclusion: Mastery is achieved through specialization. My journey with the EURJPY has been transformative, leading to the birth of
Description A colored multicurrency/multisymbol oscillator of the market mood. The oscillator is designed for detecting the continuation or change of the market mood prior to its occurrence. An excellent example is the screenshots that show all the features of the oscillator. The oscillator may be used with any broker, irrespective of the name of the financial instrument since it is necessary to manually enter the name as an input parameter. If you enter a non-existent or incorrect name of a fin
The King of Forex Trend Cloud Indicator is a trend following indicator based on moving averages. The Indicator is meant to Capture both the beginning and the end of a trend. This indicator can be used to predict both short and long terms market trends.  The king of Forex Trend Cloud if paired together with the King of Forex Trend Indicator can give a broad picture in market analysis and forecasts. I have attached images for both the  The king of Forex Trend Cloud on its own and  The king of Fore
The Raven Binary Options Indicator
Ellan Dirgantara Tholkhah
1 (1)
UPDATE: Works EXTREMELY well for EURJPY! --> more than 66% win rate monthly Guarantee! I want to introduce you the next-gen unique adaptive Binary options Indicator. This will destroy EURUSD & EURJPY The Raven is so sharp and efficient that it will pick the tops and bottoms of ANY type of market. Can also be used as a Forex Scalper. The Raven signal is based on multiple confirmation analysis. Gets confirmation from the most consistent signals known to man; Ichimoku, SMA, Bollinger Bands; and als
Description A colored universal multicurrency/multi-symbol indicator MACD Line Smart (the indicator moving average convergence divergence is displayed as a histogram) based on double or triple moving average .  Comparing to the standard MACD this indicator is more sensitive to what allows generating advance signals. he indicator may be used with any broker, irrespective of the name of the financial instrument since it is necessary to manually enter the name as an input parameter. If you enter a
PABT Pattern Indicator - it's classical system one of the signal patterns. Indicator logic - the Hi & Lo of the bar is fully within the range of the preceding bar, look to trade them as pullback in trend. In the way if indicator found PABT pattern it's drawing two lines and arrow what showing trend way.  - First line - it's entry point and drawing at: 1. On the high of signal bar or on middle of the signal bar (depending from indicator mode) for buy; 2. On the low of signal bar or on middle of t
Introduction It is common practice for professional trades to hide their stop loss / take profit from their brokers. Either from keeping their strategy to the themselves or from the fear that their broker works against them. Using this indicator, the stop loss / take profit points will be drawn on the product chart using the bid price. So, you can see exactly when the price is hit and close it manually.  Usage Once attached to the chart, the indicator scans the open orders to attach lines fo
Black series MT4
Dmitriy Kashevich
1 (1)
Black series MT4 - The indicator is designed for trading on binary options with Timeframe M1-M5-M15 Multicurrency (Works on cryptocurrency and currency pairs) The signal appears when the candle opens Up to 90% correct signals There is no signal redrawing at all Can be used with other indicators. Good for scalping! In Settings there is: -Indicator working methods -I Allert Arrow color Red signal down Blue signal up Also watch the video how the indicator works and signals
KijunSen vs Price Ichimoku Strategy MM Description in English and Italian = This Indicator is based on one of the Strategies with Ichimoku Indicator, in particular is the cross of the KijunSen with the Current Price; it will give you of Buy and Sell when they Cross, with Arrows and Alerts. When you attach the indicator on the chart , a window will open where , in the INPUT section, you can also choose to change the main Ichimoku values. SIGNAL INPUT =    · BUY = when Price cross above
Forex and binar pro
Dmitriy Konogorov
This indicator is great for trading on the pair  and many more. The indicator itself uses augmented accuracy mathematical strategies, but so far they are optimized for some currency pairs. Many settings can be configured on the working panel. There are two panels on the chart, for visualization and settings. He displays his solution on the graph in the form of icons. There are only two types of icons. In the tester, it works fine by default in the settings. The second panel for counting the res
UGenesys Volume MT4
Odaine Ramon Mcmillan
5 (1)
50% Off Today Only! Price Goes Back Up at 11 PM (EST) uGenesys Volume Indicator: Your Key to Mastering Market Volume Analysis What Traders Are Saying: "A must-have indicator...really a game-changer." – wuzzy66 "Amazing indicator...strongly recommend to beginners." – joinbehar Understanding Market Volume: Volume in the market is a critical indicator of movement and opportunity. The uGenesys Volume Indicator is specially crafted to pinpoint when the market has the most volume, allowing you to
Quatre
Maryna Shulzhenko
Quatre is a trend indicator, it indicates well the points of the beginning of the trend and its completion or reversal. This indicator is characterized by the following behavior: After a trend movement appears on the market, the indicator sends a signal of its beginning in the form of arrows. Quatre is a mathematical averaging of prices, and based on this, one can assume the direction of price movement (trend) in the future. Against the background of insignificant fluctuations, it is possible t
Oscillator helps determine the direction of the market Shows the direction of the price movement and is painted in the appropriate color. Allows you to conduct trend and counter trend trading It works on all timeframes, on any currency pairs, metals and cryptocurrency Can be used when working with binary options Distinctive features Does not redraw; Simple and clear settings; It works on all timeframes and on all symbols; Suitable for trading currencies, metals, options and cryptocurrency (Bitco
FREE
Infinity Trend Pro
Yaroslav Varankin
1 (1)
This is a trend indicator without redrawing Developed instead of the binary options strategy (by the color of the Martingale candlestick) Also works well in forex trading When to open trades (binary options) A signal will appear in the place with a candle signaling the current candle It is recommended to open a deal for one candle of the current timeframe M1 and M5 When a blue dot appears, open a deal up When a red dot appears, open a trade down. How to open trades on Forex. When a signal is rec
Rira Renko
Vitor Palmeira Abbehusen
RENKO on Time Chart This indicator is an enhanced Renko, so you can watch the Renko bricks on the chart to understand price movement more clearly the other improvement is automated box size according to ATR (Average True Range) period you can set the ATR number as you want and the box size of Renko changes automatically based on price movement Inputs Mode: Box size is the input to specify the size of the Renko box you want to print on the chart. This input lets you choose the fixed b
Towers
Yvan Musatov
Towers - Trend indicator, shows signals, can be used with optimal risk ratio. It uses reliable algorithms in its calculations. Shows favorable moments for entering the market with arrows, that is, using the indicator is quite simple. It combines several filters to display market entry arrows on the chart. Given this circumstance, a speculator can study the history of the instrument's signals and evaluate its effectiveness. As you can see, trading with such an indicator is easy. I waited for an a
I Permanent
Vladimir Gorbachev
Universal adaptable indicator. It determines the estimated trading range for the current day based on the available history a real data, and displays the area of the probable price rollback on the chart. All this thanks to the built-in algorithm that automatically adapts to any behavior models of the market quotes. With the parameters adjusted, the indicator shows its effectiveness on most of the currency pairs, that have a rollback from the reached extremums during the current or the next tradi
Trend Detective Indicator
Zakri Bin Othman
4.5 (2)
Leave a review for this product, and receive another "Free" product that you choose. You can see my other products here: https://www.mql5.com/en/users/zakri/seller Trend Detective is an advanced trend detection indicator which shows accurate entry points in direction of trend. It uses smart technology in order to detect entry points, trend changing points, and TP points. It also shows hit rate for current chart using selected parameters. Hit rate for this indicator on different charts can be
VR Cub
Vladimir Pastushak
VR Cub 这是获得高质量切入点的指标。该指标的开发是为了促进数学计算并简化对仓位入场点的搜索。多年来,该指标所针对的交易策略已被证明其有效性。交易策略的简单性是其巨大的优势,即使是新手交易者也能成功进行交易。 VR Cub 计算开仓点以及获利和止损目标水平,这显着提高了效率和易用性。查看使用以下策略进行交易的屏幕截图,了解简单的交易规则。 设置、设置文件、演示版本、说明、问题解决,可以从以下位置获取 [博客] 您可以在以下位置阅读或撰写评论 [关联] 版本为 [MetaTrader 5] 计算入场点的规则 开仓 要计算入场点,您需要将 VR Cub 工具从最后一个高点拉伸到最后一个低点。 如果第一个点在时间上早于第二个点,交易者等待柱线收于中线上方。 如果第一个点在时间上晚于第二个点,交易者等待柱线收于中线下方。 根据上述条件,严格在 柱线收盘 后建仓。 换句话说,如果我们在小时图上进行交易,那么从最高点到最低点的时间距离必须超过24小时,最高点和最低点之间的点数必须大于或等于平均价格变动每天。 维持和改变市场地位 可以有多个未平仓头寸;每个头寸都可以单独修改。 VR Cu
Owl smart levels
Sergey Ermolov
4.63 (54)
MT5版本  |  FAQ Owl Smart Levels Indicator   是一個完整的交易系統,包含   Bill Williams   的高級分形、構建正確的市場波浪結構的 Valable ZigZag 以及標記準確入場水平的斐波那契水平等流行的市場分析工具 進入市場和地方獲利。 策略的详细说明 指示灯使用说明 顾问-贸易猫头鹰助手助理 私人用户聊天 ->购买后写信给我,我会将您添加到私人聊天中,您可以在那里下载所有奖金 力量在於簡單! Owl Smart Levels   交易系統非常易於使用,因此適合專業人士和剛開始研究市場並為自己選擇交易策略的人。 策略和指標中沒有隱藏的秘密公式和計算方法,所有策略指標都是公開的。 Owl Smart Levels 允許您快速查看進入交易的信號,突出顯示下訂單的水平並向您發送有關已出現信號的通知。 優點很明顯: 清楚地顯示主要和更高時間框架的趨勢方向。 指示儀器信號的出現。 標記開單、止損設置和固定利潤的水平。 沒有多餘的,只有必要的結構! ZigZag   表示全球趨勢的方向,因此也表示貿易方向。 市場反轉點的短線清楚地表明在
Crosskalp1
Mikhail Bilan
Добрый День уважаемые трейдеры!  Вашему вниманию индикатор созданный и работающий на базе трендовика ADX,  для торговли на смене направления движения который учитывает коррекцию и даёт возможность на ней заработать.  Применяю этот индикатор для скальпинга. Рекомендую таймфреймы от 15 ти минутного(М15) до часового (Н1) периодов.  Красный кружок сигнал на продажу- Sell) Зелёный кружок  сигнал на покупку Buy) Чем меньше ваш таймфрейм тем меньше пунктов вы зарабатываете.   Важно выставлять стопы! !В
Introducing our advanced MQL4 Indicator, a groundbreaking tool for identifying support and resistance zones with unmatched precision. Elevate your trading strategy with a host of features, including a dual-color upper and lower box system that allows for easy visual recognition of market trends. Key Features: Dual-Color Box for the Support and Resistance Zones Customize your analysis with dual-color box. The upper and lower boxes offer distinct colors, providing a clear visual representation o
SmartStrategy
Pavel Krysanov
智能策略指标是一个交易系统,可让您从技术分析的多个方面来分析市场。 第一个是价格通道,它是自动构建的,允许交易者看到价格变动的主要方向。 它还可以使用通道策略(突破和从通道线反弹​​)来分析市场。 第 2 块是 SAR 系统,它提供有关市场微观波动的一般信息,这是箭头的确认信号。 第 3 块是主块,它显示您进入和退出交易所需的箭头。 这些信号很好,因为它们不会伴随小幅波动,而是立即表明一个大的长期趋势。 基于这个指标,你可以制定很多策略。 其中一个底部以箭头的形式表示,这是基于对市场的深入分析,但您也可以向其中添加 SAR 读数和通道,以显示全球趋势的方向 选项 period — 箭头出现的周期 showSar - 是否显示抛物线 Sar 步骤 - 抛物线 SAR 的步骤 最大值 - 抛物线 SAR 的最大值 channel_width — 通道宽度因子 SoundOn - 箭头声音警报 EmailAlert - 当箭头出现时发送电子邮件 MobileAlert - 当箭头出现时按下 指标不会重绘。 如果箭头出现在某个地方,它就会保留在那里。
Skynet Lasso
Roman Yablonskiy
This indicator displays entry and exit points in the market. The indicator is based on Parabolic and various mathematical and statistical methods to increase profitability and reduce the number of losing trades. The indicator helps in many cases to skip false inputs, the support and resistance lines go around the price in a certain mode, reducing losses. The dashboard shows the results of the indicator so that you can adjust it more accurately and see how the parameters affect the result. The
使用此交易工具,您可以同时扫描 15 个市场。 介绍新的交易指标 2024: ️ 仪表板多货币多时间框架随机。 我创建这个交易工具至少有两个原因: 首先,我厌倦了只观察一个市场。 其次,我不想失去进入另一个市场的时机。 这就是为什么我想同时了解其他市场状况。 因此,我需要一台可以同时扫描多个市场状况的扫描仪。 我经常寻找随机主线>(或<=)随机信号线从M1到H4(或只是M1到M30)的市场。 如果您同意我的分析,那么这就是您一直在寻找的交易指标。 不要错过市场状况满足上述要求的时刻。 这是一个随机扫描仪或仪表板,具有许多出色的功能: 可显示随机主线数据 可显示随机信号线数据 可以显示随机主线和信号线的位置(信号线上方主线或信号线下方主线) 可以显示随机主线和信号线的数据水平(看涨、看跌、趋势向上、趋势向下、超买但仍向上、超卖但仍向下) 可显示从M1到MN1的实时数据 可显示15种货币对的数据(多币种外汇/商品/加密货币/股票) 可定制参数 可定制颜色 OBOS 级别 漂亮的20仪表板配色方案 配备开/关货币对转换器 配备蜡烛高时间框架 配
该产品的买家也购买
Atomic Analyst
Issam Kassas
5 (3)
首先值得强调的是,该交易指标是非重绘、非延迟的指标,这使其成为手动和机器人交易的理想选择。 Atomic Analyst是一种PA价格行动指标,利用价格的力量和动量来寻找市场上更好的机会。配备了高级过滤器,可帮助去除噪音和假信号,并提高交易潜力。使用多层复杂的指标,Atomic Analyst扫描图表,并将复杂的数学计算转化为任何初学者都能理解并用来做出一致交易决策的简单信号和颜色。 “Atomic Analyst”是专为新手和经验丰富的交易者量身定制的综合交易解决方案。它将高级指标和一流功能融合为一体的交易策略,使其成为所有类型交易者的多功能选择。 日内交易和剥头皮策略:专为快速准确的日内交易和短期交易而设计。 日内和摆动交易策略:可用作追求价格大幅波动的日内和摆动交易者的可靠工具。 多货币和市场:凭借其可靠的精度,在不同的工具和市场上运作。 多个时间框架:可在多个时间框架上使用,性能良好。 稳定性:所有指标均不重绘、不重绘和不滞后,确保可靠的信号。 信号清晰度:提供箭头信号,用于清晰的入场和出场点。 实时警报:通过交易入场、SL和TP警报通知交易者。 多个利润水平:使用
TPSpro RFI Levels
Roman Podpora
5 (13)
A key element in trading is zones or levels from which decisions to buy or sell a trading instrument are made. Despite attempts by major players to conceal their presence in the market, they inevitably leave traces. Our task was to learn how to identify these traces and interpret them correctly. Reversal First Impulse levels (RFI)   -  Version MT5                INSTRUCTIONS                 RUS                 ENG                                       R ecommended to use with an indicator   -  
引入神奇外汇指标:释放精准交易的力量 你是否厌倦了寻找在所有时间框架上都能取得出色结果的完美外汇指标?别再继续寻找了!神奇外汇指标已经来到,改变您的交易体验,将您的利润推向新的高度。 神奇外汇指标基于尖端技术和多年的精心开发,堪称外汇市场上的强大和精确的巅峰之作。这个卓越的工具旨在满足各个层次的交易者需求,在追求持续盈利性方面提供无与伦比的优势。 神奇外汇指标的独特之处在于其无与伦比的适应性。无论您是日内交易者、波段交易者还是更喜欢长期持仓,该指标都经过优化,能在所有时间框架上取得出色的结果。然而,当在1小时时间框架上使用时,它的准确性和捕捉市场复杂走势的能力得到真正展示。 准备好对神奇外汇指标的准确性和可靠性感到惊讶。其先进的算法无缝结合了强大的指标、统计分析和趋势识别,实时为您提供全面的市场视图。指标的智能和动态信号使您能够自信地做出明智的交易决策,最大限度地提高获胜交易的机会。 不再犹豫和迷茫。神奇外汇指标消除了交易的猜测,使您在市场参与者中具有独特的优势。其用户友好的界面和直观的设计使得无论是经验丰富的专业人士还是初学者都能轻松掌握这一卓越工具的力量。 有了神奇外汇指标的支持,
FX Volume
Daniel Stein
4.6 (35)
通过 mql5 和 Telegram 上 的 " 晨间简报 "获取每日市场更新,包括详细信息和屏幕截图 ! 外汇交易量(FX Volume)是第一个也是唯一一个从经纪商角度真正洞察市场情绪的交易量指标。 直接在您的图表上看到这些信息是真正改变游戏规则和突破性的交易解决方案。 受益于独特的市场数据洞察,如 比率(Ratios )显示货币多头和空头头寸的比率(百分比 比率变化 显示所选时间段内的多头比率及其百分比变化 总交易量 显示货币的总交易量(多头和空头),以手为单位 多头 交易量显示货币所有多头头寸的交易量 空头 交易量显示所有货币空头头寸的交易量 净多头 显示净多头交易量,即所有多头头寸减去所有空头头寸(以手为单位)。 净多头百分比 显示货币净多头交易量的变化 请阅读我们的基本教程 -> "如何使用外汇交易量进行交易 " 获取更多信息,如常见问题、交易技巧和教程视频,请访问我们的 外汇交易量公共信息频道 请 安装并运行 SI Connect 以建立与我们数据中心的持续连接 背景信息 我们都知道,外汇是一个分散的市场。这就是为什么我们必须打破常规思维,开发一个独
目前八折优惠! 对任何新手或专家交易者来说都是最好的解决方案! 这个仪表板软件适用于28种货币对。它基于我们的两个主要指标(高级货币强度28和高级货币冲动)。它对整个外汇市场提供了一个伟大的概述。它显示高级货币强度值,货币运动速度和28个外汇对在所有(9)时间段的信号。想象一下,当你可以使用图表上的单一指标观察整个市场,以确定趋势和或剥头皮的机会时,你的交易将得到改善 我们已经在这个指标中建立了一些功能,使你更容易识别强势和弱势货币,同时识别和确认潜在的交易。该指标以图形方式显示货币的强势或弱势是增加还是减少,以及它在所有时间段的表现。 增加的新功能是动态市场斐波那契水平,它适应当前的市场条件变化,这是一个已经在我们的高级货币强度28和高级货币冲动指标中使用的成熟的加分项。 在交易时,总是将弱势货币和强势货币配对,这个新指标将帮助你做到这一点。 用户手册:点击这里  https://www.mql5.com/en/blogs/post/708783 特点  显示每个时间段的ACS28和GAP-speed(冲动)的货币强度值。 列:颜色代码以7种颜色
PZ Harmonacci Patterns
PZ TRADING SLU
3.43 (7)
可以说,这是您可以为MetaTrader平台找到的最完整的谐波价格形成自动识别指标。它检测19种不同的模式,像您一样认真对待斐波那契投影,显示潜在的反转区域(PRZ),并找到合适的止损和获利水平。 [ 安装指南 | 更新指南 | 故障排除 | 常见问题 | 所有产品 ] 它检测19种不同的谐波价格形态 它绘制了主要,衍生和互补的斐波那契投影(PRZ) 它评估过去的价格走势并显示每个过去的形态 该指标分析其自身的质量和性能 它显示合适的止损和获利水平 它使用突破来表明合适的交易 它在图表上绘制所有样式比率 它实现了电子邮件/声音/视觉警报 受斯科特·M·卡尼(Scott M. Carney)的书的启发,该指标旨在满足最纯粹和最熟练的交易者的需求。但是,它采取了一种使交易更容易的方式:在向交易发出信号之前,它会等待Donchian朝正确方向突破,从而使交易信号非常可靠。 斐波那契投影与向量无关 它实现了电子邮件/声音/推送警报 它绘制了ABCD投影 重要提示: 为了符合 Scott M. Carney先生 的商标申诉,某些图案名称已重命名为不言自明的替代方式, Scot
How to use Pair Trading Station Pair Trading Station is recommended for H1 time frame and you can use it for any currency pairs. To generate buy and sell signal, follow few steps below to apply Pair Trading Station to your MetaTrader terminal. When you load Pair Trading Station on your chart, Pair Trading station will assess available historical data in your MetaTrader platforms for each currency pair. On your chart, the amount of historical data available will be displayed for each currency pai
TrendMaestro
Stefano Frisetti
5 (2)
note: this indicator is for METATRADER4, if you want the version for METATRADER5 this is the link:  https://www.mql5.com/it/market/product/108106 TRENDMAESTRO ver 2.4 TRENDMAESTRO recognizes a new TREND in the bud, he never makes mistakes. The certainty of identifying a new TREND is priceless. DESCRIPTION TRENDMAESTRO identifies a new TREND in the bud, this indicator examines the volatility, volumes and momentum to identify the moment in which there is an explosion of one or more of these data a
Indicator : RealValueIndicator Description : RealValueIndicator is a powerful tool designed specifically for trading on the EURUSD pair. This indicator analyzes all EUR and USD pairs, calculates their real currency strength values, and displays them as a single realistic value to give you a head start on price. This indicator will tell you moves before they happen if you use it right. RealValueIndicator allows you to get a quick and accurate overview of the EURUSD currency pair tops and bottoms,
Cycle Sniper
Elmira Memish
4.39 (36)
NEW YEAR SALE PRICE FOR LIMITED TIME!!! Please contact us after your purchase and we will send you the complimentary indicators to complete the system Cycle Sniper is not a holy grail but when you use it in a system which is explained in the videos, you will feel the difference. If you are not willing to focus on the charts designed with Cycle Sniper and other free tools we provide, we recommend not buying this indicator. We recommend watching the videos about the indiactor and system before pu
XPointer
Andrey Kozak
5 (3)
XPointer is a completely ready trading system. It shows the trader when to open and close a trade. It works on all currency pairs and all time frames. Very easy to use and does not require additional indicators for its operation. Even a beginner trader can start working with XPointer. But it will also be useful for professional traders to confirm the opening of orders. Features of the XPointer indicator It does not redraw its values. It works on all currency pairs and all time frames. It has a
XQ Indicator MetaTrader 4
Marzena Maria Szmit
3 (2)
Step into the realm of Forex trading with confidence and precision using XQ, a cutting-edge Forex indicator designed to elevate your trading game to unprecedented heights. Whether you're a seasoned trader or just stepping into the world of currency exchange,   XQ Forex Indicator   empowers you with the insights and signals needed to make informed trading decisions. The signal conditions are a combination of three indicators, and XQ Forex Indicator only display  medium and long-term trends . The
Alqannas
Mouhcine Haddad
ALQANNAS (Sniper) Indicator Overview: Welcome to ALQANNAS, your ultimate sniper in the forex market! ALQANNAS is a powerful and versatile trading indicator designed to enhance your trading experience. Whether you're a beginner or an experienced trader, ALQANNAS provides you with accurate non repainting signals, trend direction and strength, and advanced features to elevate your trading strategy.   Key Features: Buy and Sell Signals: ALQANNAS is equipped with a sophisticated algorithm that genera
The "Easy Ichimoku Wave Meter" indicator is a basic tool to automatically determine Waves according to Ichimoku! The indicator gives the possibility to simultaneously apply the Wave Theory, Time Theory and Target Price Theory according to the "Little Ichimoku" strategy developed by Sense Hosoda on the MT4 platform.  The use of this tool allows not only novice traders to instantly (fully automatic) determine the waves and their rapid interpretation, it also allows to automatically measure the p
TakePropips Donchian Trend Pro
Eric John Pajarillaga Aldana
4.82 (17)
TakePropips Donchian Trend Pro   (MT4) 是一款功能强大且有效的工具,可使用 Donchian 通道自动检测趋势方向,并为您提供进场和退场交易信号! 这个多功能指标包括趋势扫描器、交易信号、统计面板、筛选器、交易时段和警报历史仪表板。它旨在为您提供交易信号并节省您分析图表的时间! 您可以在我们的博文中下载用户手册和安装指南:   https   :// www.mql5.com/en/blogs/post/751368 今天立减 50%!价格从 98 美元降到 49 美元! 您可以在 Strategy Tester 上测试该指标(启用可视模式)。如果您喜欢在实时图表上进行测试,也可以给我发消息以获取 7 天试用版。 视频教程也可在说明下方获得更多详细信息。 如果您有任何问题或需要任何帮助,请与我联系。 TakePropips Donchian Trend Pro 指标适用于所有外汇对、金属、商品、指数和加密货币。 主要特点 交易信号 - 检测多个时间范围内所有货币对的买卖机会。它将为您提供警报并在图表上绘制交易信号,最多 3 个止盈价和一个止
介绍 ON Trade Waves Patterns Harmonic Elliot Wolfe,这是一款高级指标,旨在使用手动和自动方法检测各种市场模式。以下是它的工作原理: 谐波模式: 该指标可以识别出现在您图表上的谐波模式。这些模式对于练习谐波交易理论的交易者非常重要,正如Scott Carney的书《谐波交易第1卷和第2卷》所描述的那样。无论您是手动绘制它们还是依赖自动检测,ON Trade Waves Patterns都可以胜任。 控制面板: 我们配备了一个用户友好的控制面板,它会保存您的图表和时间帧设置,使您可以轻松切换不同配置。您甚至可以最小化它以最大化图表空间。如果您更喜欢使用其他分析工具,只需单击关闭按钮即可隐藏所有指标数据。 模板保存: 当您自定义设置或添加其他指标,如移动平均线或布林带时,该指标会自动保存您的模板。这意味着您可以随时轻松加载您喜欢的设置。 优化显示: 对于Windows 10用户,我们建议调整您的DPI设置以获得高清设备上的最佳屏幕体验。右键单击MetaTrader图标,选择“兼容性”,然后选择“更改高DPI设置”,将其设置为“系统(增强)”。
Shepherd Harmonic Pattern
Abdullah Alrai
4.68 (59)
这个指标将检测手动和自动方法在图表上绘制的谐波模式。 您可以从此链接查看用户手册: 添加您的评论并联系我们以获得它 有一个免费版本可以在mt4上尝试此产品。 您可以使用它来检测Gartley和Nenstar模式: https://www.mql5.com/en/market/product/30181 您可以从以下链接购买完整的MT4版本: https://www.mql5.com/en/market/product/15212 注意 指标具有控制面板,并将保存每个(图表和时间框架)设置。 您可以将其最小化以在图表上获得更多空间,并且如果您更喜欢使用其他分析工具,则可以按关闭按钮隐藏所有指标数据 当您使用此指标并更改设置,添加诸如移动平均线或布林带之类的指标时,此指标将自动保存您的模板编辑,并且您可以随时加载它们。 如果您使用的是Windows 10,请右键单击MetaTrader图标>兼容性>更改高DPI设置>系统(增强)以获得最佳屏幕设置(应在高清设备中完成)。 指标只是谐波交易理论的解释,用于检测图表上的谐波模式。 如果您想学习它,可以搜索Scott Carney的书,名为“Ha
TPA True Price Action indicator reveals the true price action of the market makers through 100% non-repainting signals (except early signals mode) strictly at the close of a candle! TPA shows entries and re-entries, every time the bulls are definitely stronger than the bears and vice versa. Not to confuse with red/green candles. The shift of power gets confirmed at the earliest stage and is ONE exit strategy of several. There are available now two free parts of the TPA User Guide for our custo
Binary FX Ideal
Yaroslav Varankin
3.5 (2)
great tool for any trader for both Forex and binary options suitable for any trader no need to configure anything, everything has been perfected by time and experience The tool combines 5 indicators and 3 proprietary strategies works great during flats and trends It indicates a trend reversal at its very beginning, it works well with the trend Trading Recommendations The signal is formulated on the current candle You should enter the trade at the next Possible recount (rare)
Gann Signal
Kirill Borovskii
Gann Signal is a very simple indicator at first glance, but hidden inside is many years of experience in studying W.D.Ganna methods. The indicator gives accurate BUY/SELL signals, without redrawing. The indicator is very easy to use. All you need to do is attach it to your chart and follow its recommendations. The indicator constantly analyzes the market for entry opportunities. When such an opportunity appears, the indicator gives a signal in the form of an arrow. I repeat, all signals are NOT
NAM Order Blocks
NAM TECH GROUP, CORP.
5 (1)
MT4多時限訂單塊檢測指示器。 特徵 -在圖表控制面板上完全可自定義,提供完整的交互。 -隨時隨地隱藏和顯示控制面板。 -在多個時間範圍內檢測OB。 -選擇要顯示的OB數量。 -不同的OB用戶界面。 -OB上的不同過濾器。 -OB接近警報。 -ADR高低線。 -通知服務(屏幕警報|推送通知)。 概括 訂單塊是一種市場行為,它指示從金融機構和銀行收取訂單。著名的金融機構和中央銀行帶動了外匯市場。因此,交易者必須知道他們在市場上正在做什麼。當市場建立訂單塊時,它會像發生大多數投資決策的範圍一樣移動。 訂單建立完成後,市場將朝著上升和縮小的方向發展。訂單大宗交易策略的關鍵術語是它包括機構交易者正在做的事情。由於它們是主要的價格驅動因素,因此包括機構交易在內的任何策略都可以。 您將在任何時間範圍內實時看到訂單塊,使用我們的控制面板,您將能夠在所選的歷史記錄週期內檢測常規,拒收和未大寫的訂單塊。 現在您可以接收到訂單塊接近警報,我們在MT4上顯示屏幕通知,並將通知推送到您的手機!
ON Trade Optuma Astro
Abdullah Alrai
5 (4)
当然可以!以下是您提供的文本的中文翻译: 引入 MT4 天文指标:您的终极天体交易伙伴 您准备好将交易体验提升到天文高度了吗?不用再寻找,就在我们的革命性 MT4 天文指标中。这个创新工具超越了传统的交易指标,利用复杂的算法提供无与伦比的天文洞察力和精确计算。 指尖上的宇宙信息: 瞻仰一个详尽的面板,展示了一宝藏般的天文数据。了解行星的地理/太阳心坐标,太阳/地球距离,亮度,伸长度,星座,黄道和赤道坐标,甚至是水平坐标——每个细节都经过精心计算并呈现得美轮美奂。指标生成的垂直线对应于时间值,为您的交易旅程提供了宇宙的视角。 行星线条与关系: 在您的图表上欣赏行星线条的魔力,具有可自定义的比例和角度。通过直观的控制面板轻松切换每个行星线条的可见性。通过连结、六分、四分、三分、对冲和逆行等指标,发现行星关系的艺术。在您选择的时间范围内探索这些宇宙构造,使您能够识别重要的交易机会。 揭示甘恩的智慧: 通过受甘恩启发的平方垂直线揭示潜在的反转时机。这种创新修改将甘恩历经考验的原则带入现实,帮助您提前了解市场的转向和趋势。 月亮引导: 在您的图表上优雅地导航月相,因为新月和满月点缀其间。月亮周期
Supply and Demand Dashboard PRO
Bernhard Schweigert
4.82 (22)
目前八折优惠! 这个仪表板是一个非常强大的软件,可用于多个符号和多达9个时间段。 它是基于我们的主要指标(最佳评论:高级供应需求)。 Advanced Supply Demand 该仪表板提供了一个伟大的概述。它显示。   筛选后的供需值,包括区域强度评级。 区间内和区间外的点位距离。 它突出了嵌套的区域。 在所有(9个)时间段内,它对所选符号发出4种警报。 它是高度可配置的,以满足您的个人需求! 您的利益! 对每个交易者来说,最重要的问题是。 什么是入市的最佳水平? 在强大的供应/需求区域内或附近进入你的交易,以获得最佳的成功机会和风险/回报。 我的止损的最佳位置是哪里? 把你的止损放在强势供应/需求区的下方/上方是最安全的。 我的最佳盈利目标是什么? 你的退出策略和你的进入策略一样重要,了解更高的时间框架图可以帮助你。对于买入,使用下一个供应区作为目标,对于卖出,使用下一个需求区作为目标。在回撤到供应区或需求区时进场,以确保有足够的利润空间,达到更高的时间框架的供应和需求,将增加你的利润。 为什么我们要过滤强区和
BBMA, which stands for  Bollinger Bands  and Moving Average , is a trading method that is quite popular and widely used not only in the forex market but also in the stock and commodity markets. This strategy is different from another version of BBMA called BBMA Oma Ally, which uses two Moving Averages. In the BBMA strategy, traders   use the Bollinger Bands to spot possible changes in direction and the Moving Average to decide when it's a good time to get in on a trade .  
ZO Trend
Trung Le Hoang
4.2 (5)
Important!! ZO Trend can't work on MN timeframe. /*--------------------------------------------------------------------------------------------------------------------------------------------------------------------------------------------- ZO Trend an indicator used to search for entry point. With the session candle algorithm on many timeframe, ZO Trend creates an area for traders find good Entry Point. ZO SYSTEM BASIC SETUP :  https://www.youtube.com/watch?v=qdNOXHWozNw ZO TREND User guide : 
A percent graphic is a type of graph or chart used to represent data as a percentage of a whole. Percent graphics are often used to illustrate how a given set of data is distributed between different categories or how certain trends have changed over time. Percent graphics can be used to show the composition of a dow jones , or the performance of a company over a given period of time   d1 percet  w1 perncet  m1 percent  y1 percenty
Weis Wave with Alert
Trade The Volume Waves Single Member P.C.
4.79 (19)
Rental/Lifetime Package Options and Privileges' * For optimum results the yearly or lifetime package is suggested due to live training and Discord  channel trading with the  creator! Rent Monthly Six Months   Yearly/Lifetime Weis Wave with Speed with Alert+Speed Index x x x Manual  x x x Quick Set up Video x x x Blog x x x Lifetime Updates x x x Setup and Training Material x x Free Rectangle Break Alert Tool      x Discord Access Channel "The SI traders" x 2-hour live methodology traini
VTrende Pro mt4
Andrii Diachenko
3 (2)
VTrende Pro MT4 - MTF indicator for trend trading with a display panel for MT5 *** Videos can be translated into any language using subtitles (video language - Russian) Although the signals of the VTrende Pro indicator can be used as signals of a full-fledged trading system, it is recommended to use them in conjunction with the Bill Williams TS. VTrende Pro  MT4 is an extended version of the VTrende indicator. Difference between Pro version and VTrende: - Time zones - Signal V - signal 1-
The Nihilist 5.0 Indicator includes Forexalien and Nihilist Easy Trend trading strategies and systems. It is composed of an MTF Dashboard where you can analyze the different input possibilities of each strategy at a glance. It has an alert system with different types of configurable filters. You can also configure which TF you want to be notified on your Metatrader 4 platform and Mobile application The indicator has the option to view how could be a TP and SL by using ATR or fixed points, even
Ultimate Sniper Dashboard
Hispraise Chinedum Abraham
4.84 (25)
折扣价为299美元! 未来可能会涨价! 请阅读下面的描述! 终极狙击手仪表盘的最佳进入系统。终极动态水平。(请查看我的产品) 由于MT4多币种测试的限制,终极狙击手仪表盘只适用于实时市场。 介绍Ultimate-Sniper Dashboard! 我们最好的产品包括HA-狙击手、MA-狙击手和许多特殊模式。终极狙击手仪表盘是一个绝对的野兽! 对于任何新手或专家交易者来说,这是最好的解决方案! 永远不要再错过任何一个动作! 对于那些喜欢简单和点数的交易者,我们有一个特别的产品给你。本质上很简单,该仪表板根据多种自定义算法查看28种货币对,完成所有工作。只需一张图表,你就可以像专家一样阅读市场。试想一下,如果你能在任何外汇对开始移动时准确地确定其方向,你的交易会有多大的改善。   我们的系统是为了寻找高概率信号并实时向用户发送警报。没有滞后或错误的信号。 为了保持图表的清洁,你可以在不需要时隐藏Ultimate-Sniper。只需按下箭头按钮即可隐藏仪表板。 Ultimate-Sniper适用于从1分钟到月度的所有时间框架,因此你可以在你选择的任何时间框架上快速
作者的更多信息
Super volumes
Yerzhan Satov
4 (1)
外汇和二元期权的箭头指示器是基于蜱数量. 与许多交易量指标不同,"超级交易量"指标计算看涨和看跌交易量,并根据其中任何一个交易量的优势给出信号。 如果,比如说,目前在这个范围内有看涨的优势,那么信号将是买入。 或者,如果占主导地位的是看跌量,那么,相应地,信号将是卖出。 在"成交量"变量的指标设置中,您可以增加或减少信号的频率。 值越高,信号越少。 默认情况下,剩下"2"。 在"HistoryBars"变量中,您可以增加历史记录上的信号数量。 默认情况下留下500。 不建议留下超过这个数字。 因为更大的数字将加载终端。 那么,在设置的最后一部分中,您可以选择更改箭头与蜡烛的距离,箭头的厚度,代码和颜色。 信号和箭头根本不画!!! 即使在改变时间框架之后。 严格建议在固定图表上的箭头后使用指标信号进行交易。 信号蜡烛关闭后,它们被彻底固定.
外汇和二元期权的指标基于MT4中的2个标准指标:ADX和RVI。 当两个指示器的线同时相交时,信号被接收。 但信号的反面也被写入代码中。 这是当信号被转换在相反的方向。 您还可以启用和禁用每个指标。 在RVI中也可以使用两种类型的信号:1)当一条线高于/低于另一条线时(这很适合用作无后坐力趋势价格走势);和2)当2条线彼此相交时。 您还可以在设置中启用内置的统计面板,其中包含有关重新计算统计信息的条数以及更新统计信息的条数后的说明。  在filter_bar变量中,您可以更改信号的类型以及相反的类型。 在alert_bar变量中,您可以设置警报将在哪个蜡烛上触发:0-在信号蜡烛上,1-在新蜡烛的打开上。 那么,在设置部分的底部,您可以更改: 1)箭头间隙-箭头从蜡烛(酒吧)的距离 2)arrow_width-箭头的大小 3)arrow_codUP和arrow_codDN-箭头代码 4)arrowa_colorUP和arrowa_colorDN是箭头的颜色。 所有的箭头和信号根本不画!!! 即使在改变时间框架。 如果箭头固定在图表上,它们不会在任
Anaconda LD
Yerzhan Satov
The arrow indicator "Anaconda LD" is a reversal indicator for the Forex market and mainly for Binary options. The algorithm is written on the basis of reversal patterns. It is better to use it together with other indicators to filter signals. Even with the standard ones in MT4, even with other custom ones. Any channel indicators or level indicators are especially suitable... You need to select your expiration time for different assets. Which are 1-5 bars on different pairs.
Cripton
Yerzhan Satov
The arrow indicator for Binary Options and Forex is a reversal indicator. Created and written on the basis of reversal patterns. It is recommended for Binary Options to put it on the M5 chart. Enter into transactions for 1-3 bars. Depending on the trading sessions, you need to select your expiration time for a different asset.  You can change settings in external variables. Thus, you can both increase and decrease the frequency of signals. The arrows of the indicator do not draw at all. So yo
箭头指标"创建一个很酷的信号"为二元期权和外汇市场是一种构造它的信号! 您可以根据其中规定的10个标准MT4指标选择自己的信号条件,再加上另一个第三方缓冲指标,您可以添加到"缓冲指标"变量中。 这是简单的! 规定您的指示器的名称并规定它的数字(您将在颜色部分找到它们,其中显示缓冲颜色的数字)。 在屏幕截图中,我展示了一个示例,说明如果第三方指标的缓冲区不是箭头缓冲区,而是例如线条,则如何创建箭头。 他在Keltner通道的例子中显示了2种类型的信号。 1)通道线的交点。      首先要做的是找出缓冲区编号。 这里,通道的上一行是缓冲器no.0,下缓冲器No.2。 因此,为了在穿过通道的较低线时获得信号到顶部,我们写入2>o2c。 2)价格落后于通道线。 一切的拼写方式完全相同,只有Open(o)和Close(c)中的字符"more(>)"/"less(<)"的拼写方向相同。 (请参阅屏幕截图中的示例。) 通过这种方式,您可以从绝对任何第三方指标输出信号。 箭头和线条。
Highway pro
Yerzhan Satov
二元期权和外汇"公路利润"的指标是基于在通道线后面找到价格的原则。 价格离开通道并逐渐开始回到通道后,信号就会出现。 交易这样的指标非常容易和方便。 即使是新手交易者或具有多年经验的交易者也可以交易它。 您需要为每个资产选择自己的设置。 例如,在变量"A_Period"中设置的计算趋势柱的周期。 趋势由通道中的中线指示。 绿色意味着购买,红色意味着销售。 您还需要在不同的交易时段调整通道宽度,这是在"范围"变量中设置的。 其中的数字值越高,通道越宽。 那么,在较低的变量中,您可以选择您方便的箭头和线条参数。 厚度,箭头与条形的距离,它们的代码和颜色。 箭头不是实时绘制的。 他们不会从一个酒吧跳到另一个酒吧然后消失。 但是在切换时间戳之后,它们会更改它们的值。.. 祝大家好运!!!
Space signals
Yerzhan Satov
The Space signals signal indicator is my new development for trading on the Forex and Binary options markets. The algorithm of the indicator is written so that it tracks the trend and gives signals for the end of the corrective price movement. In the settings, you can set the signal period yourself. The higher the value in the "period" variable, the less frequent the signals will be. But they will naturally be of higher quality.  You can also choose the arrow codes on the chart, the distanc
The indicator for Forex and Binary Options trading is based on the standard Mt4 Simple Moving Average indicator. But the difference from the standard indicator is that its lines are repainted in different colors depending on the state of the trend. If the color is green, then the trend is to buy. If it's red, then it's for sale. During a trend phase change, an audio alert appears along with a buffer on the chart in the middle of the lines. Thus, it is possible to determine the state of the trend
筛选:
无评论
回复评论