• 概述
  • 评论 (1)
  • 评论 (1)

Trading In The Zone

这确实需要一个分形来闭合,因此如果切换且分形尚未闭合,指标将再次计算。 这就是分形的本质。

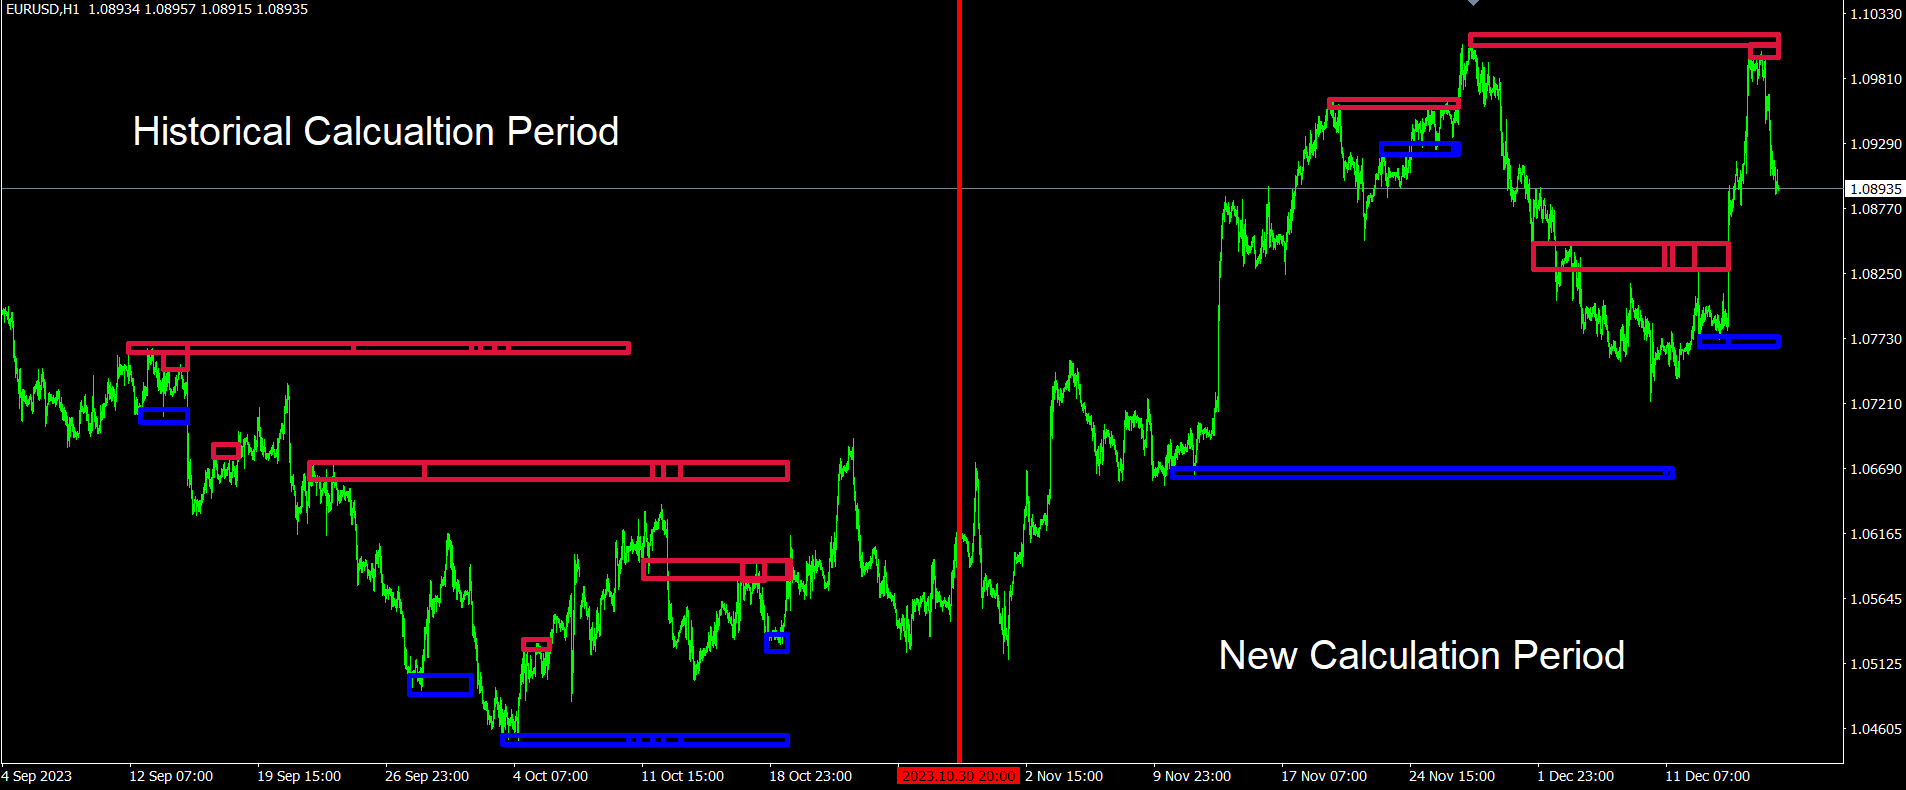
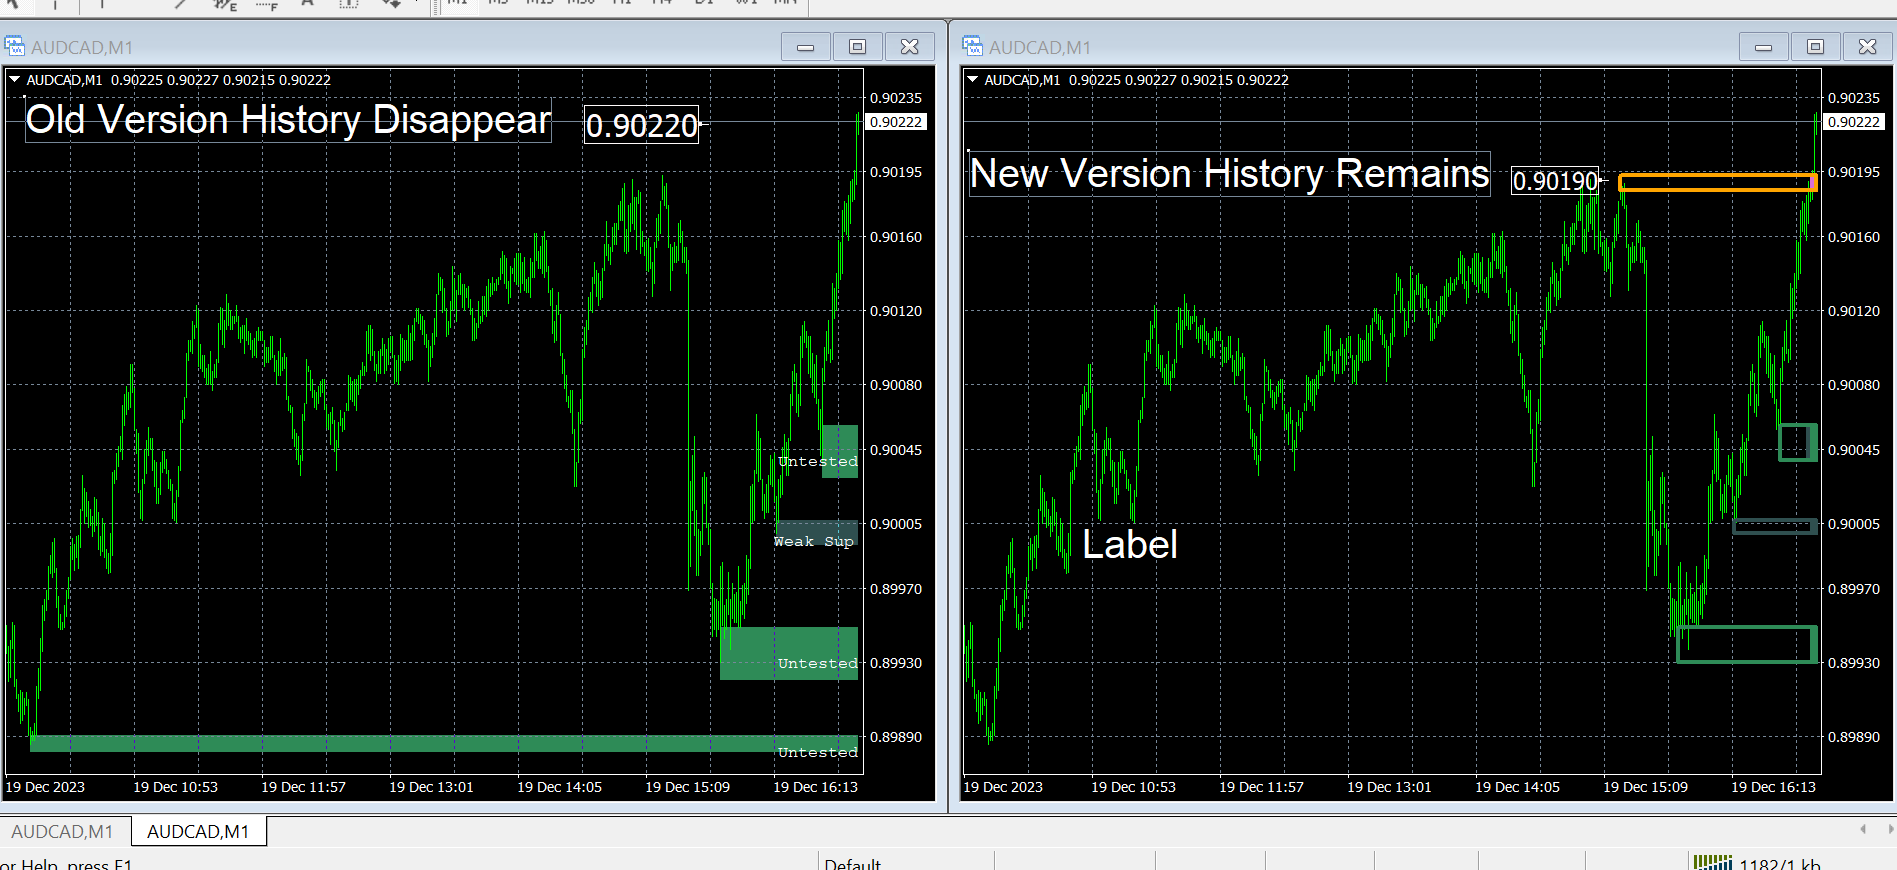
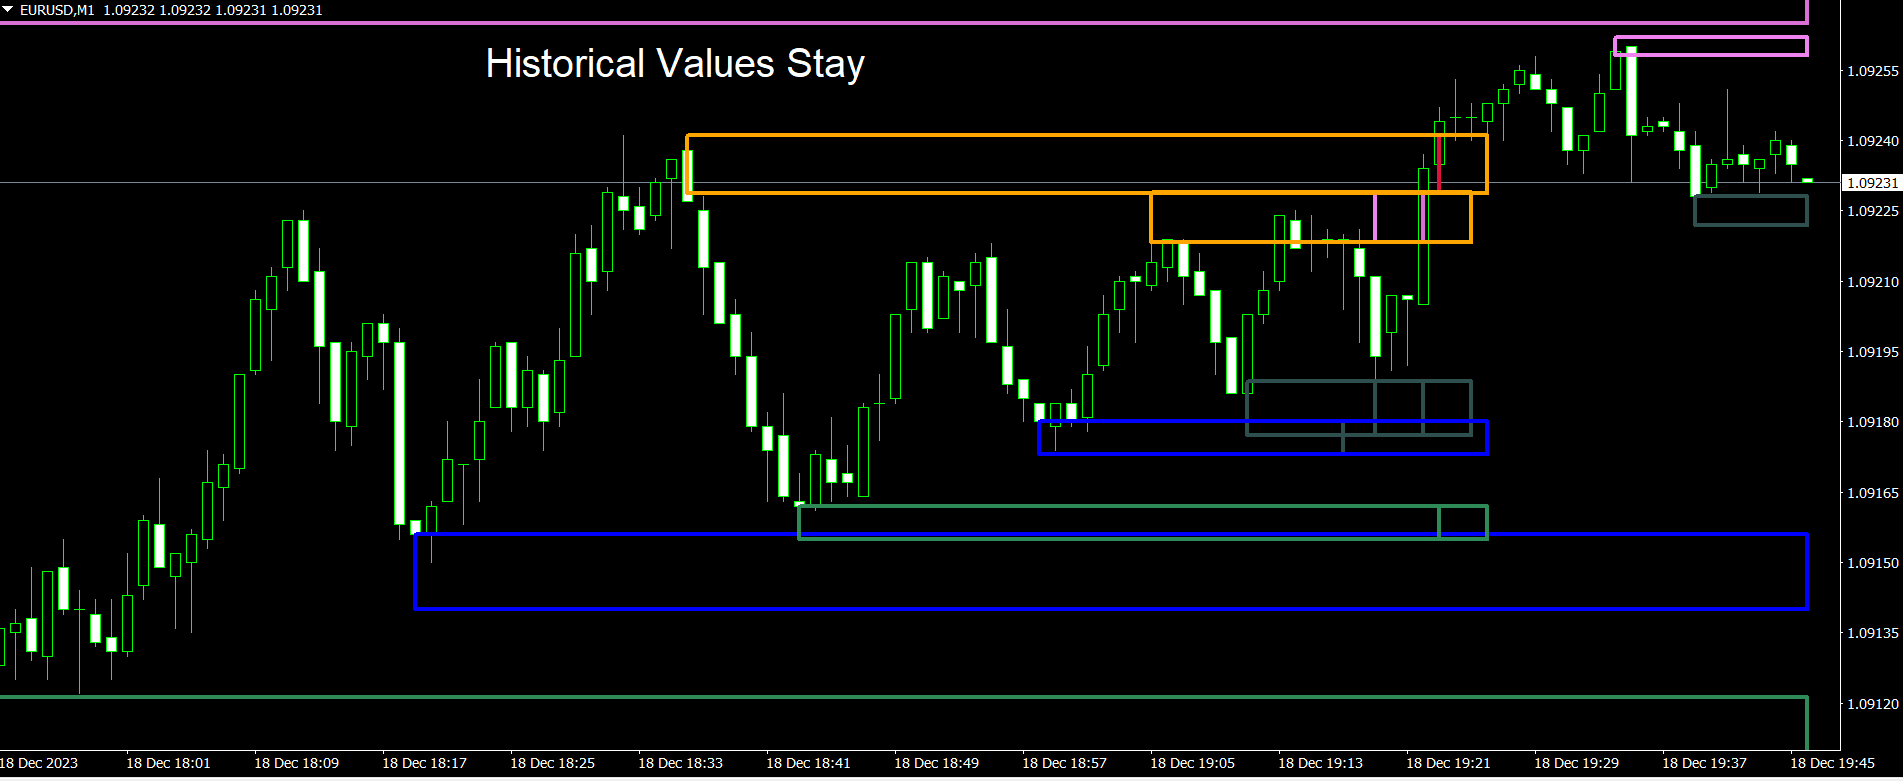
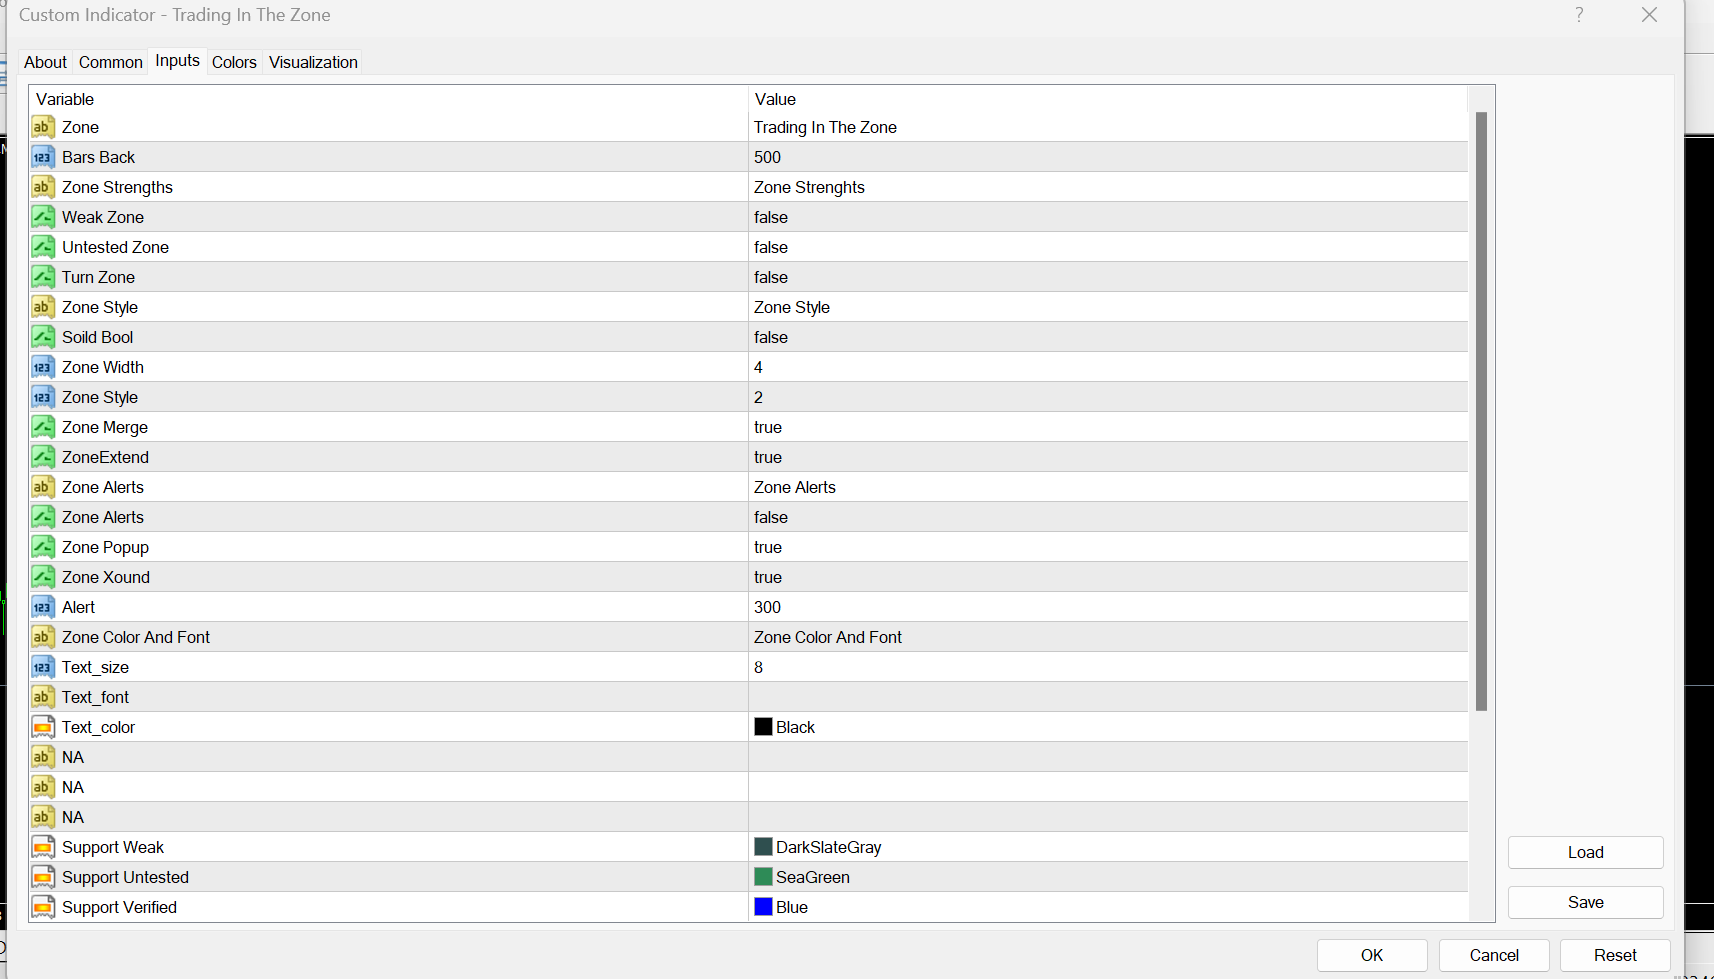
该区内的交易是一个备受追捧的供需指标,以其在识别金融市场内关键交易区方面的有效性而闻名。 该指标的原始版本经常面临重新绘制和删除先前识别的区域的问题,与此不同的是,这种改进的迭代确保了这些区域在整个历史数据中保持可见,为交易者在确定关键支撑和阻力位方面提供了明显的优势。


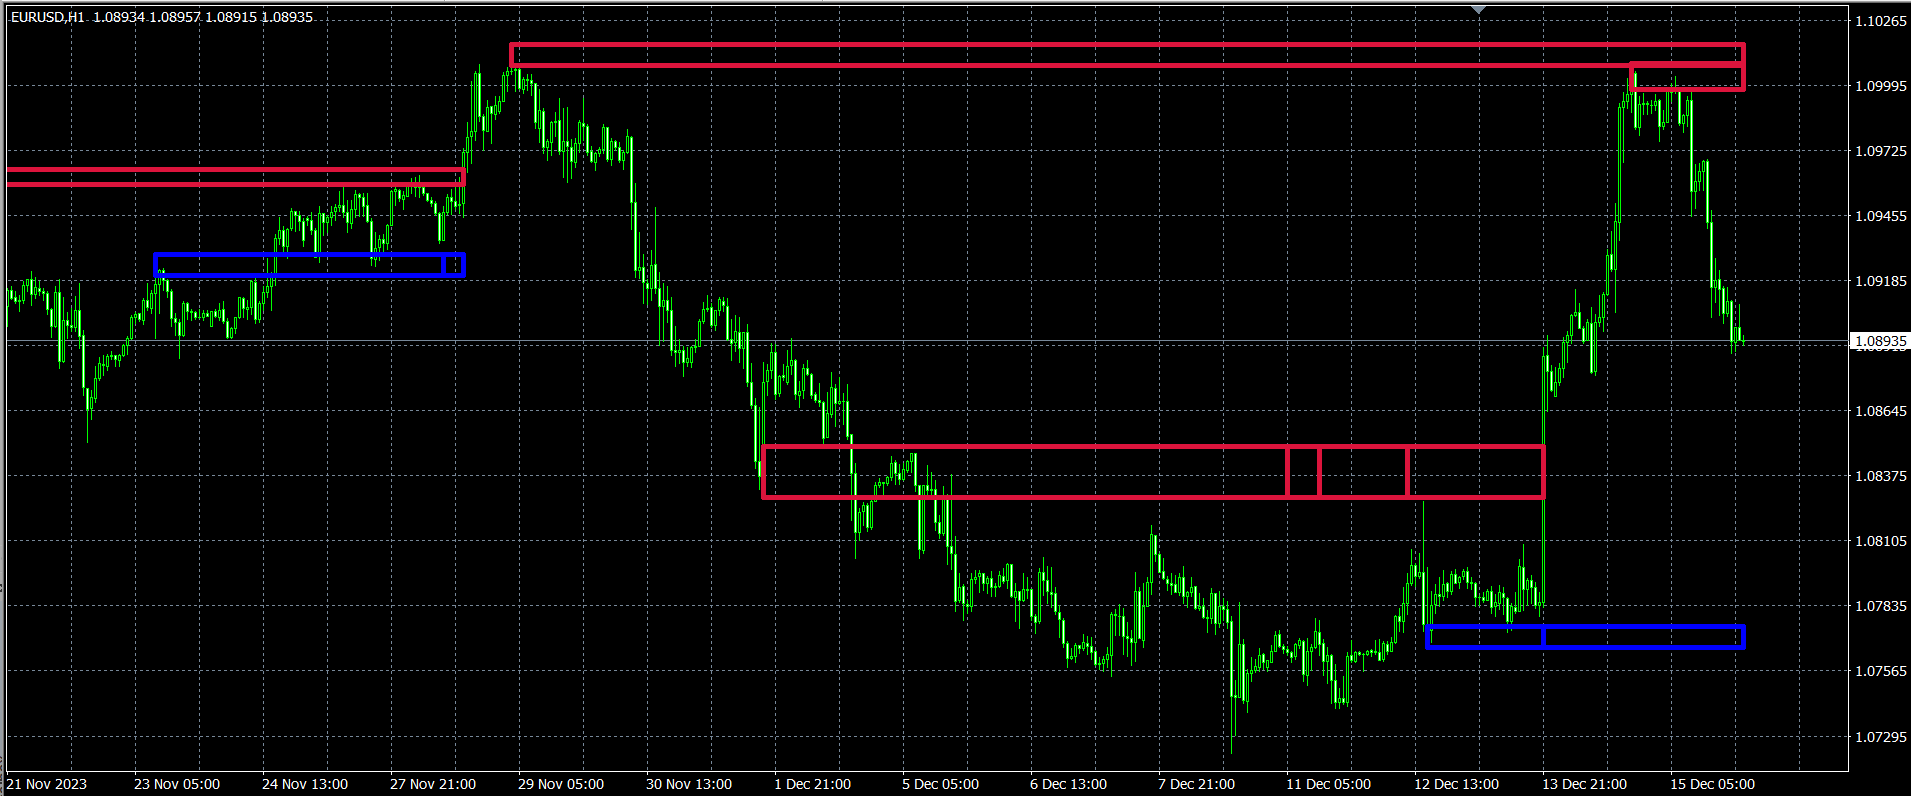
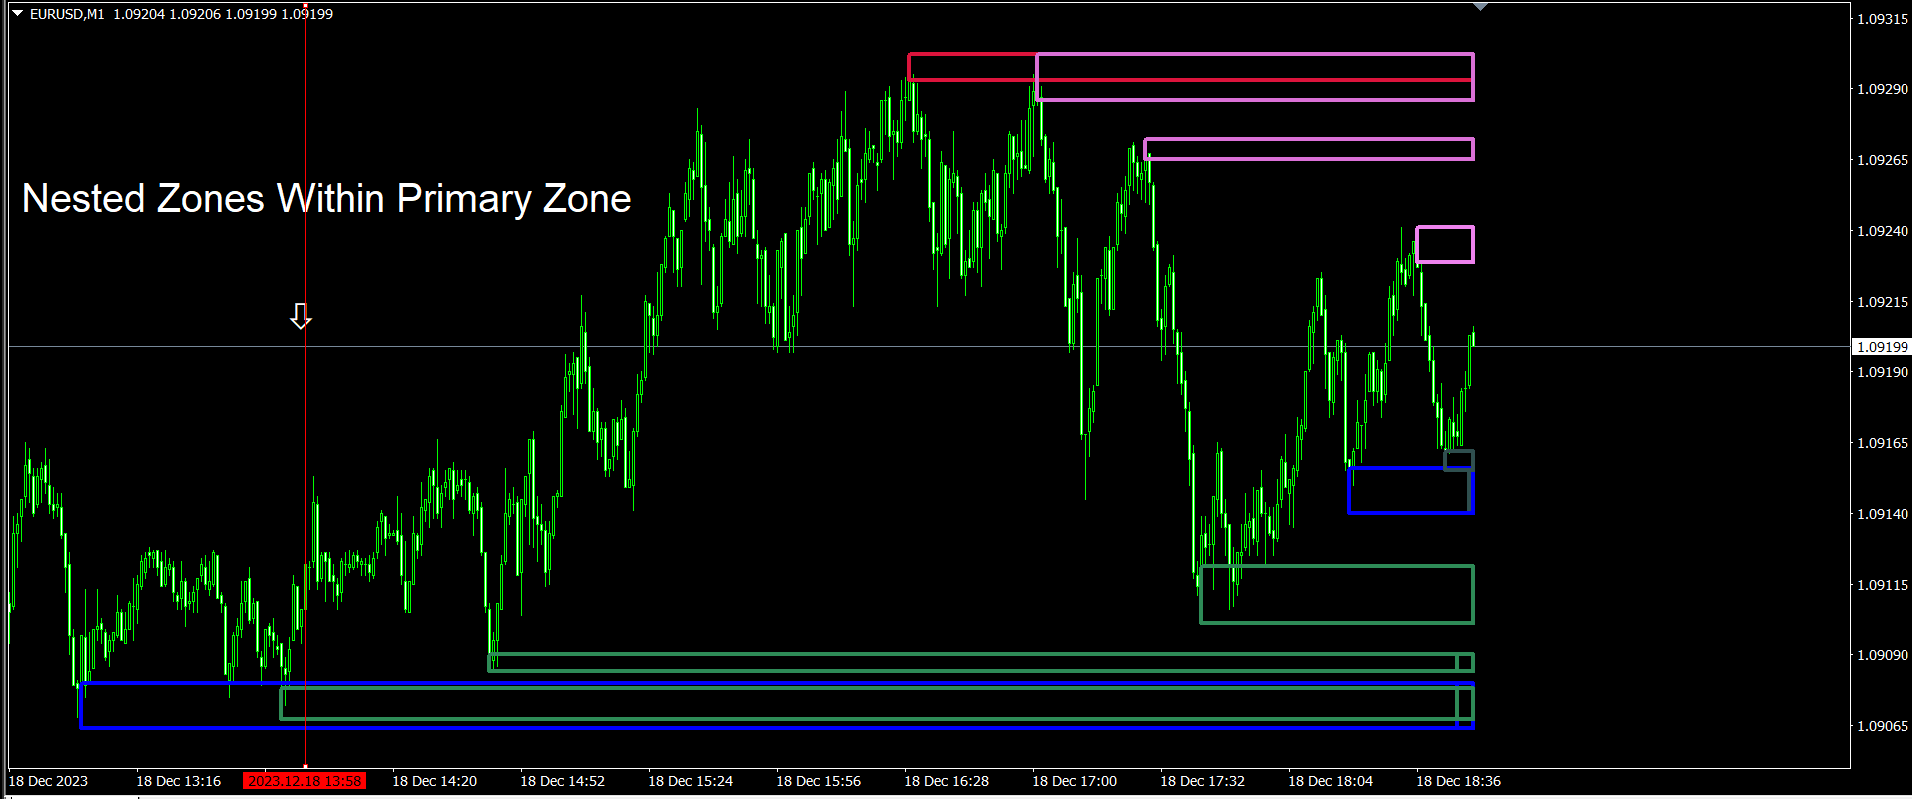
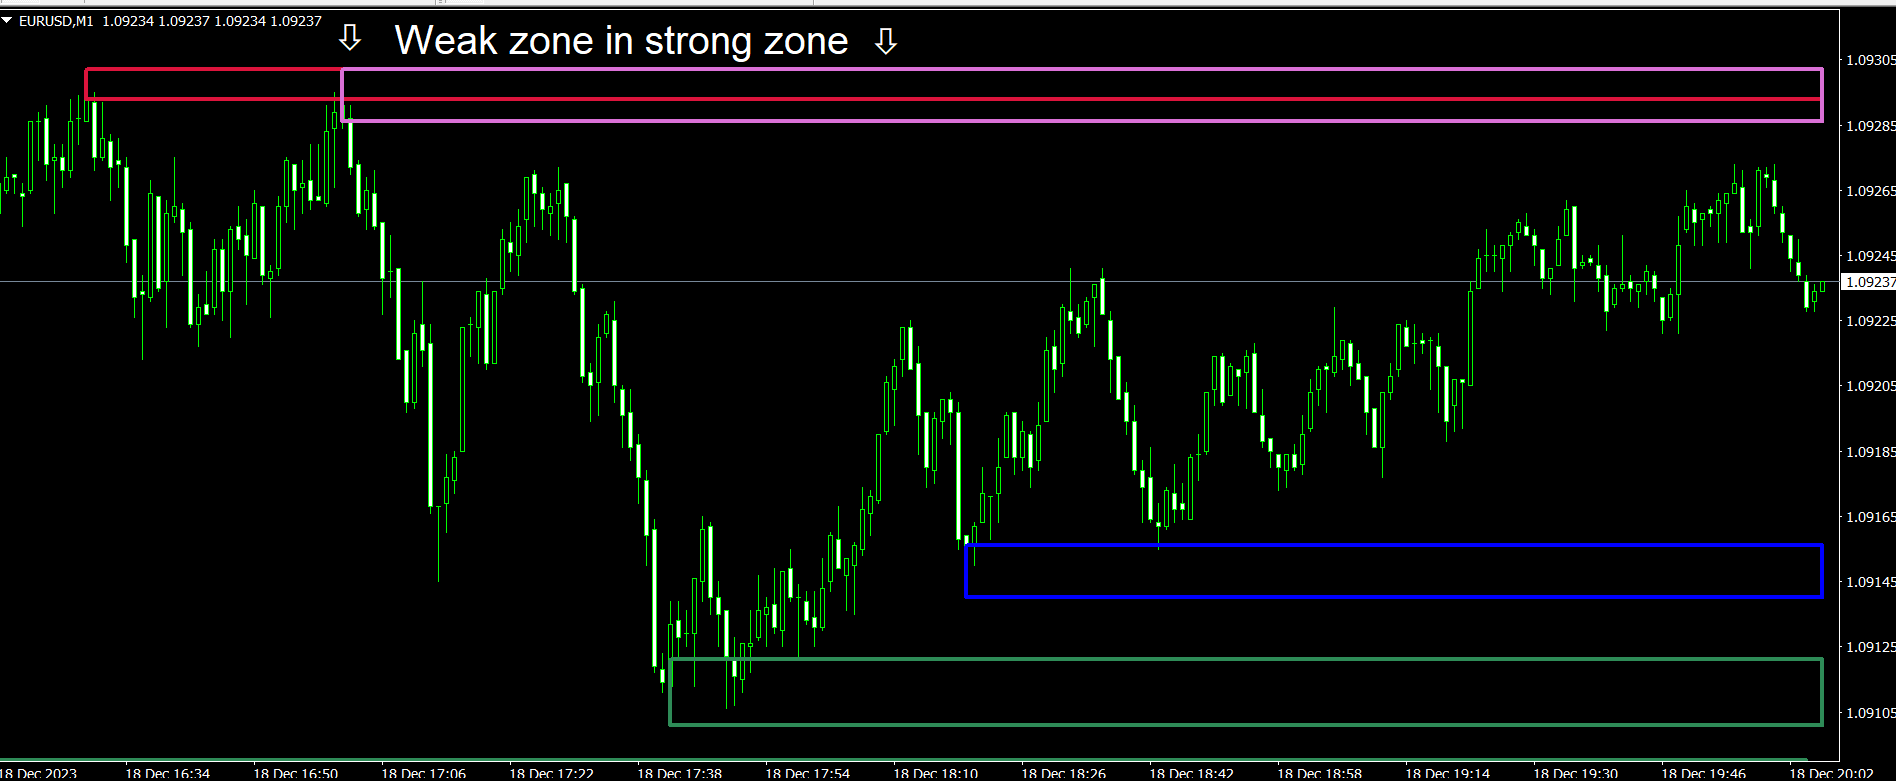
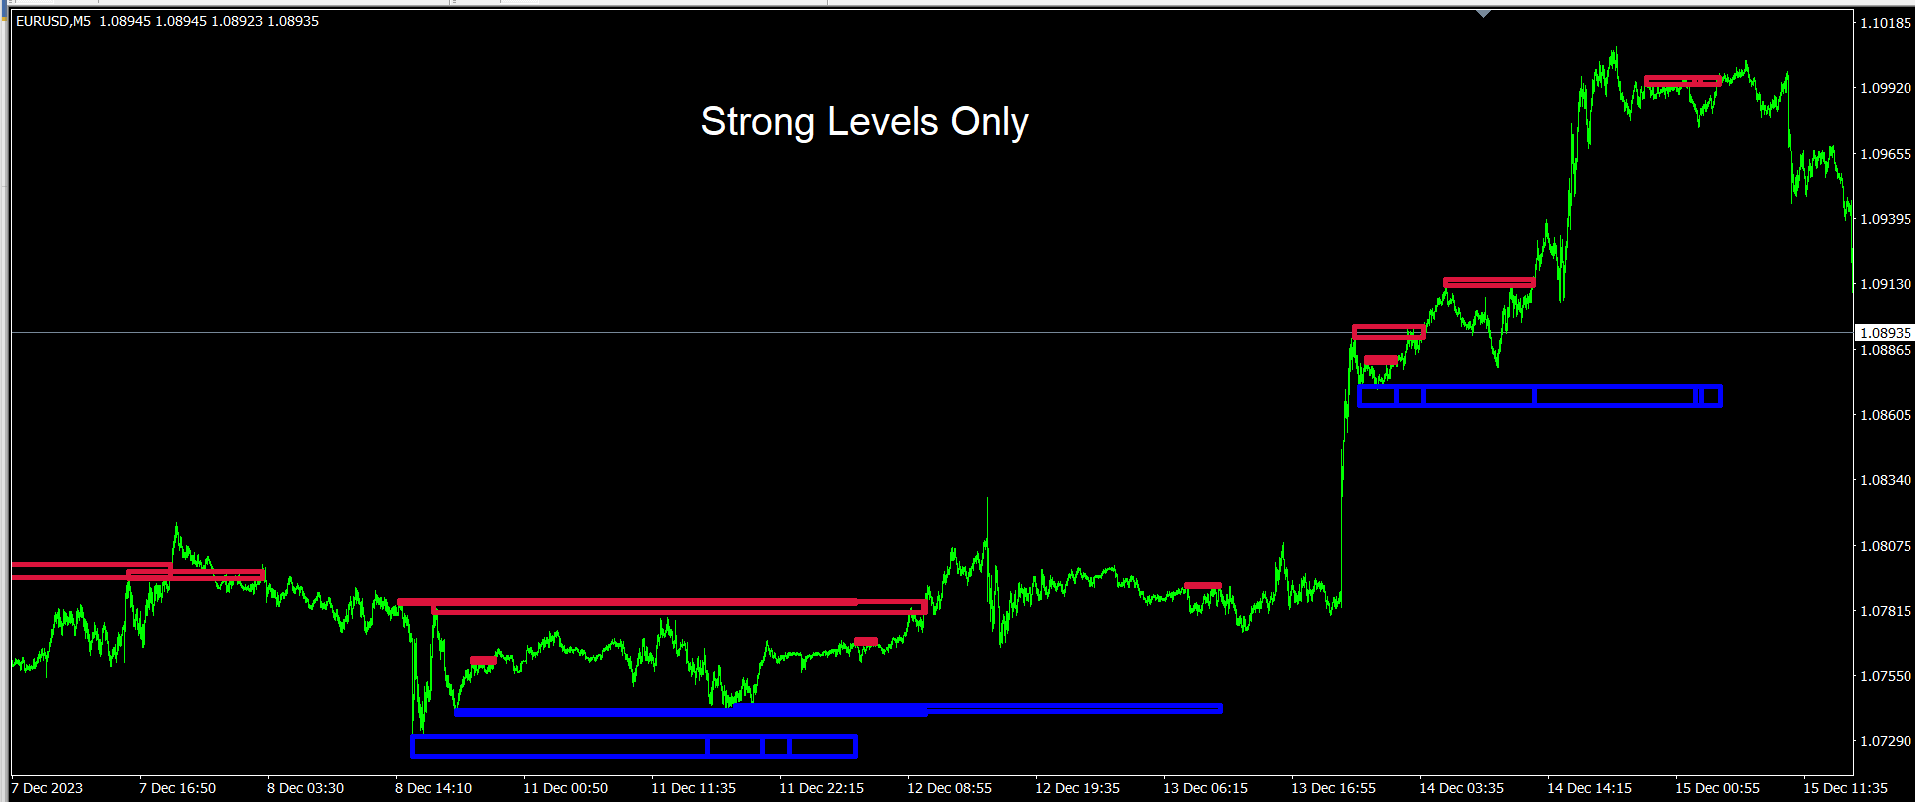
该指标的主要功能围绕市场内供需动态的概念。 它确定了买卖压力之间存在严重不平衡的领域,从而导致潜在的转折点或交易者的兴趣水平。 通过避免重新绘制的常见问题(先前识别的区域消失或转移),交易者可以依靠指标的历史准确性来做出明智的交易决策。

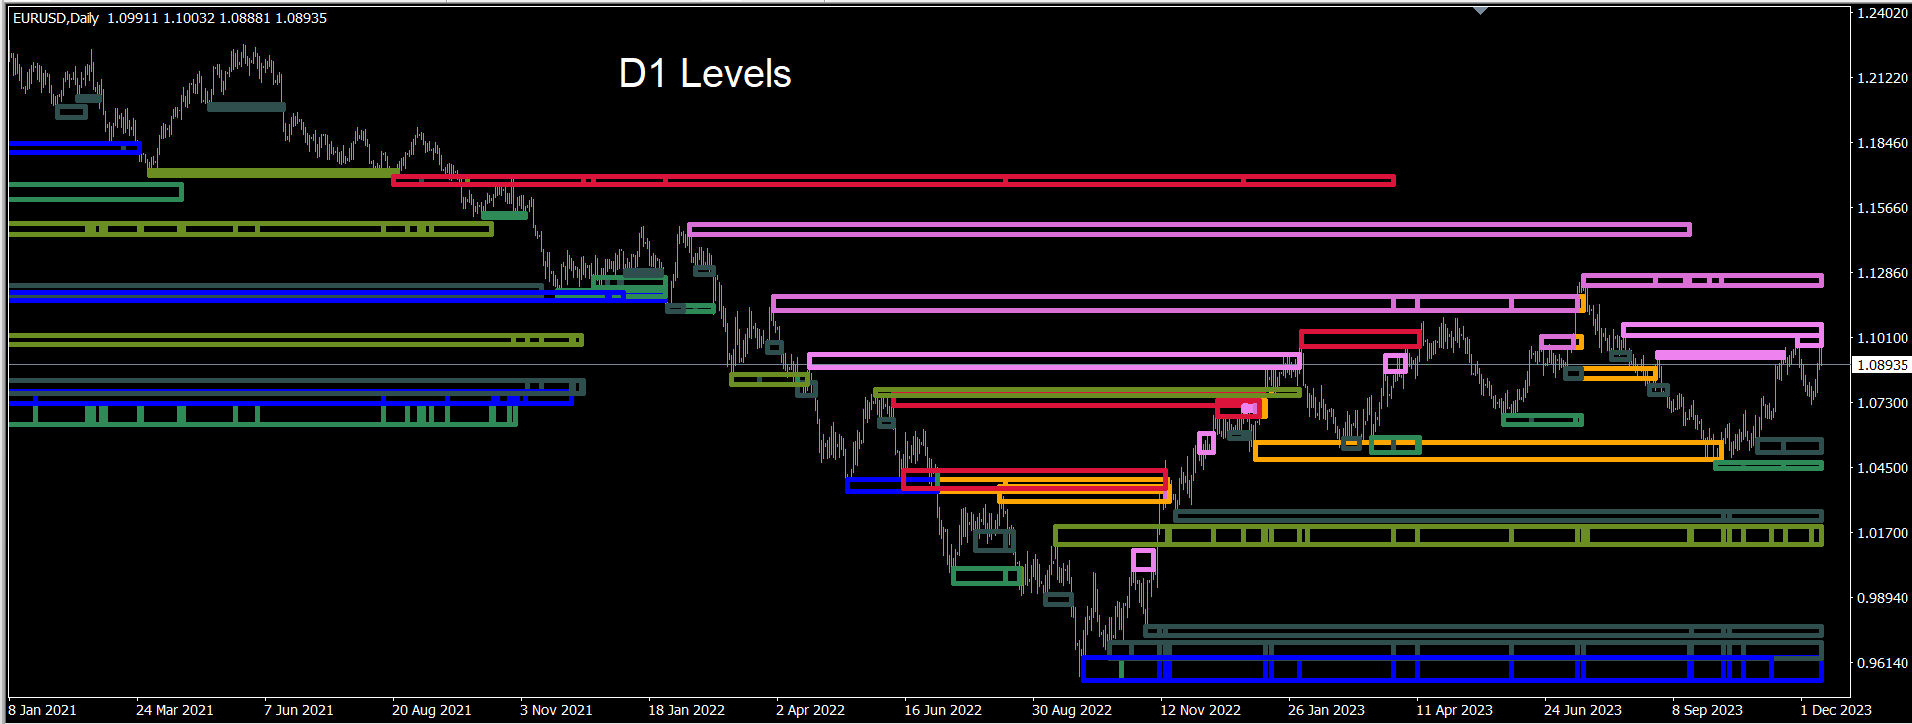
从本质上讲,区域交易为交易者提供了一个宝贵的工具,可以更好地了解市场情绪并预测潜在的价格变动。 它能够保持历史数据中已识别区域的完整性,使交易者能够了解过去发生过重大价格水平的情况,从而促进更精确的进入和退出策略。

总体而言,区域内交易是一个强大的供需指标,通过提供准确可靠的历史区域信息,为交易者在应对复杂的金融市场方面提供了明显的优势。
推荐产品
This is a new strategy for SUPPLY DEMAND areas It is based on a calculation using the tick volume to detect the big price action in market for both bear /bull actions this smart volume action candles are used to determine the supply and demand areas prices in between main supply and demand lines indicate sideway market  up arrows will be shown when prices moves above the main supply and the secondary supply lines Down arrows will be shown when prices moves below the main demand and the secondary
VR Cub
Vladimir Pastushak
VR Cub 这是获得高质量切入点的指标。该指标的开发是为了促进数学计算并简化对仓位入场点的搜索。多年来,该指标所针对的交易策略已被证明其有效性。交易策略的简单性是其巨大的优势,即使是新手交易者也能成功进行交易。 VR Cub 计算开仓点以及获利和止损目标水平,这显着提高了效率和易用性。查看使用以下策略进行交易的屏幕截图,了解简单的交易规则。 设置、设置文件、演示版本、说明、问题解决,可以从以下位置获取 [博客] 您可以在以下位置阅读或撰写评论 [关联] 版本为 [MetaTrader 5] 计算入场点的规则 开仓 要计算入场点,您需要将 VR Cub 工具从最后一个高点拉伸到最后一个低点。 如果第一个点在时间上早于第二个点,交易者等待柱线收于中线上方。 如果第一个点在时间上晚于第二个点,交易者等待柱线收于中线下方。 根据上述条件,严格在 柱线收盘 后建仓。 换句话说,如果我们在小时图上进行交易,那么从最高点到最低点的时间距离必须超过24小时,最高点和最低点之间的点数必须大于或等于平均价格变动每天。 维持和改变市场地位 可以有多个未平仓头寸;每个头寸都可以单独修改。 VR Cu
Master scalping M1
Nataliia Marchuk
Master Scalping M1 is an innovative indicator that uses an algorithm to quickly and accurately determine the trend.The indicator calculates the time of opening and closing positions, the indicator's algorithms allow you to find the ideal moments to enter a deal (buy or sell an asset), which increase the success of transactions for most traders. Benefits of the indicator: Easy to assemble, does not overload the chart with unnecessary information. Can be used as a filter for any strategy. Works on
KT Renko Patterns MT4
KEENBASE SOFTWARE SOLUTIONS
2.33 (3)
KT Renko Patterns scans the Renko chart brick by brick to find some famous chart patterns that are frequently used by traders across the various financial markets. Compared to the time-based charts, patterns based trading is easier and more evident on Renko charts due to their uncluttered appearance. KT Renko Patterns features multiple Renko patterns, and many of these patterns are extensively explained in the book titled Profitable Trading with Renko Charts by Prashant Shah. A 100% automate
Supply Demand WTC
Stefano Cocconi
Check My Product Contact me to discover all my services  Supply and demand zones are one of the most basic things a beginner forex trader learns. These zones are so important, price reacts off of them even after years since they first developed. And with the supply and demand zones indicator, a forex trader might not need to worry about drawing all these historical zones one after the other. The supply and demand zone indicator accurately draws the supply and demand zones of a currency pair
Infinity Trend Pro
Yaroslav Varankin
1 (1)
This is a trend indicator without redrawing Developed instead of the binary options strategy (by the color of the Martingale candlestick) Also works well in forex trading When to open trades (binary options) A signal will appear in the place with a candle signaling the current candle It is recommended to open a deal for one candle of the current timeframe M1 and M5 When a blue dot appears, open a deal up When a red dot appears, open a trade down. How to open trades on Forex. When a signal is rec
这是一个预测蜡烛收盘价的指标。 该指标主要用于 D1 图表。 该指标适用于传统外汇交易和二元期权交易。 该指标可以用作独立的交易系统,也可以作为您现有交易系统的补充。 该指标分析当前蜡烛,计算蜡烛本身内部的某些强度因素,以及前一根蜡烛的参数。 因此,该指标预测市场走势的进一步方向和当前蜡烛的收盘价。 由于这种方法,该指标既适用于短期盘中交易,也适用于中长期交易。 该指标允许您设置指标在分析市场情况期间将产生的潜在信号的数量。 在指标设置中有一个特殊的参数。 此外,该指标可以通过图表上的消息、电子邮件以及推送通知的形式通知新信号。感谢您的关注!交易愉快! 购买后一定要写信给我! 我会给你我的交易指标的建议! 还可以获得奖金!
The indicator detects and displays 3 Drives harmonic pattern (see the screenshot). The pattern is plotted by the extreme values of the ZigZag indicator (included in the resources, no need to install). After detecting the pattern, the indicator notifies of that by a pop-up window, a mobile notification and an email. The indicator highlights the process of the pattern formation and not just the complete pattern. In the former case, it is displayed in the contour triangles. After the pattern is com
Indicator. "Indicator wave or Indicator Ma". Using 23 standard indicators and the author's algorithm, the levels of purchases (from 0 to +100) and sales (from 0 to -100) are calculated. Then, using the calculated levels, the "Wave Indicator" draws a wave with 21 moving averages. The wave number is equal to the averaging period of the calculated levels. Waves # 1 - 7 Fast Moving Averages Waves from No. 8 -14 moving averages Waves from No. 15-21 slow moving averages Looking at the figu
Owl smart levels
Sergey Ermolov
4.63 (54)
MT5版本  |  FAQ Owl Smart Levels Indicator   是一個完整的交易系統,包含   Bill Williams   的高級分形、構建正確的市場波浪結構的 Valable ZigZag 以及標記準確入場水平的斐波那契水平等流行的市場分析工具 進入市場和地方獲利。 策略的详细说明 指示灯使用说明 顾问-贸易猫头鹰助手助理 私人用户聊天 ->购买后写信给我,我会将您添加到私人聊天中,您可以在那里下载所有奖金 力量在於簡單! Owl Smart Levels   交易系統非常易於使用,因此適合專業人士和剛開始研究市場並為自己選擇交易策略的人。 策略和指標中沒有隱藏的秘密公式和計算方法,所有策略指標都是公開的。 Owl Smart Levels 允許您快速查看進入交易的信號,突出顯示下訂單的水平並向您發送有關已出現信號的通知。 優點很明顯: 清楚地顯示主要和更高時間框架的趨勢方向。 指示儀器信號的出現。 標記開單、止損設置和固定利潤的水平。 沒有多餘的,只有必要的結構! ZigZag   表示全球趨勢的方向,因此也表示貿易方向。 市場反轉點的短線清楚地表明在
Professional forex expert   Black Angel   (for EURUSD, GBPUSD pairs) alyzing the market using the Elliot Wave Index. Elliott wave theory is the interpretation of processes in financial markets through a system of visual models (waves) on price charts. The author of the theory, Ralph Elliott, identified eight variants of alternating waves (of which five are in the trend and three are against the trend). The movement of prices in the markets takes the form of five waves. Three of them (1, 3, 5)
TWO PAIRS SQUARE HEDGE METER INDICATOR Try this brilliant 2 pairs square indicator It draws a square wave of the relation between your two inputs symbols when square wave indicates -1 then it is very great opportunity to SELL pair1 and BUY Pair2 when square wave indicates +1 then it is very great opportunity to BUY pair1 and SELL Pair2 the inputs are : 2 pairs of symbols         then index value : i use 20 for M30 charts ( you can try other values : 40/50 for M15 , : 30 for M30 , : 10 for H1 ,
Trendiness Index
Libertas LLC
5 (3)
"The trend is your friend" is one of the best known sayings in investing, because capturing large trendy price movements can be extremely profitable. However, trading with the trend is often easier said than done, because many indicators are based on price reversals not trends. These aren't very effective at identifying trendy periods, or predicting whether trends will continue. We developed the Trendiness Index to help address this problem by indicating the strength and direction of price trend
Rait Patterns
Tatiana Zvereva
Современный индикатор паттернов PPR по торговой стратегии RAIT. Работает по тренду и без него. Имеет настройки таймфрейма для отображения. Можно настроить количество баров для отображения индикатора на графике. Используется несколько паттернов PPR. Индикатор предпочтительно использовать на часовом таймфрейме и выше, но работает и ниже . Паттерны:  PPR, PinPPR, OutPPR. Отображаются одной стрелкой.
The indicator places Semaphore points on the maximum and minimum of a higher, medium and lower period. It includes A,B,C Triangles for easier spotting of reversal chart pattern which occurs very frequently and has a very high success ratio. Both Semaphore and A,B,C Triangles have Alerts and Push notifications to a mobile device when they occur on the chart. These indicators are very useful for breakout trading and spotting support/resistance levels which gives good opportunities for positions.
Fractals AM
Andriy Matviyevs'kyy
Classic indicator. The Fractals indicator analyzes the price patterns that form on the candlestick chart and display the reversal points of the market trend. The indicator consists of candles, the middle of which is either the highest (up fractal) or the lowest (down fractal). Highs and lows, indicated by the indicator on the chart, are recommended to be taken as points that form support and resistance lines. Unlike the original indicator, where fractals are formed by five candles (high/low in t
FREE
Trend Ray
Andriy Sydoruk
The indicator shows the potential trend direction by cyclical-wave dependence. Thus, all the rays of the intersection will be optimal rays, in the direction of which the price is expected to move, taking into account the indicator period. Rays can be used as a direction for potential market movement. But we must not forget that the approach must be comprehensive, the indicator signals require additional information to enter the market.
BuySellAlert
Oleg Borisov
The BuySellAlert arrow indicator is developed based on the use of HMA, Laguerre, CCI, and ATR . The BuySellAlert arrow indicator: generates  entry points  for BUY and SELL  displays current profit ; displays  current spread. The profitability of the indicator is shown in the screenshot on the example of the GBPUSD pair Does not redraw and works on opening bar. Time frames - M1-M30. Recommended Time frames M5-M15. Setting ALARM - enable/disable the alarm; Push    - enable/disable Push notificatio
Diamond PRO
Fanur Galamov
5 (11)
Diamond PRO is enhanced powerful version of Diamond for advanced traders. Pro version includes optimized cores, new impoved entry points filters, new multistage profit closure algorithm and сontains number of external control parameter that allows build and fine tune own tradind decisions and algorithms. The system provides more accurate market entries, analyzes and filters upcoming economic news, contains spread protection and an advanced position management algorithm. Main goal of Diamond PRO
Fulltrend
Thomas Bradley Butler
Improve trading with this indicator.  Find areas of buys or sells in Fibonacci retracement areas.  Fulltrend is for scalping and making swing trades.  Fib levels are added for take profits and stop losses. This works on any time frame and can be used by itself or together with other systems and indicators for filters. The indicator doesn't repaint.  Alerts are added and can be true or false.  No need to sit glued to the computer, just set on charts and listen or the alerts to come.  Take a pos
Noize Absorption Index MT4
Ekaterina Saltykova
5 (1)
Noize Absorption Index - is the manual trading system that measures the difference of pressure between bears forces and bulls forces. Green line - is a noize free index that showing curent situation. Zero value of index shows totally choppy/flat market.Values above zero level shows how powerfull bullish wave is and values below zero measures bearish forces.Up arrow appears on bearish market when it's ready to reverse, dn arrow appears on weak bullish market, as a result of reverse expectation. S
MovingFlatBreakout
Stanislav Korotky
This indicator monitors the market for a flat state and possible breakout. The flat state is detected as a predefined number of consecutive bars during which price fluctuates inside a small range. If one of the next bars closes outside the range, breakout is signaled. The indicator shows 3 lines: blue - upper bound of flat ranges AND consecutive breakout areas; red - lower bound of flat ranges AND consecutive breakout areas; yellow - center of flat ranges (NOT including breakout areas). When a b
The indicator is designed to detect breakouts of the Bill Williams fractal level on the instrument chart in the MetaTrader 4. After installing the indicator on the instrument chart, when a breakdown of the Bill Williams fractal level occurs, the signal bar (candle) is marked with a colored pointer (arrow) in the direction of the breakdown. For greater clarity, you can add a standard indicator "Bill Williams Fractal" to the chart of the instrument. When adding the indicator to the instrume
The principle of this indicator is very simple: detecting the trend with Moving Average, then monitoring the return point of graph by using the crossing of Stochastic Oscillator and finally predicting BUY and SELL signal with arrows, alerts and notifications. The parameters are fixed and automatically calculated on each time frame. Example: If you install indicator on EURUSD, timeframe M5: the indicator will detect the main trend with the Moving Average on this timeframe (for example the Moving
Candles Indicator
Mikhail Gudyrin
A machine translation from the English product description was used. We apologize for possible imprecisions. 使用了英文产品描述的机器翻译。 我们对可能的不准确表示歉意。 最喜 欢的烛台价格行为模式的可视化系统。 附加后,指 标将自动在图表上标记下一个模式: 匹诺曹酒吧 - 带有长“鼻子”的小型条形杆,非常著名的反向模式; 内柱 - 一个柱,其范 围位于前一个柱的范围内。 它代表市 场的不确定性; 外柱 - 其范 围超出前一个柱的范围的柱。 它代表市 场的不确定性; 导轨图案 - 两个随之而来的对立柱,具有几乎相等的、较大的实体。 反向模式,实际上与更高时间框架的匹诺曹柱线模式相吻合; 主蜡 烛形态 - 蜡 烛的第五根,其中四个后续蜡烛的范围在第五根蜡烛的范围内 - 主蜡 烛。 这种模式代表市场整合,尤其是在较短的时间范围内。 差距 - 后 续柱的收盘价和开盘价 之 间的差距,不应忽视。 该指标的开发考虑了高性能要求。
Trend Bilio
Ivan Simonika
Trend Bilio - an arrow indicator without redrawing shows potential market entry points in the form of arrows of the corresponding color: upward red arrows suggest opening a buy, green down arrows - selling. The entrance is supposed to be at the next bar after the pointer. The arrow indicator Trend Bilio visually "unloads" the price chart and saves time for analysis: no signal - no deal, if an opposite signal appears, then the current deal should be closed. It is Trend Bilio that is considered
该指标发现技术分析反转模式,如双底、三重底、头肩顶及其相反的对应物。该指标将它们显示在货币对图表上,如果最近形成了一种模式,则可以向交易者发出信号。这使您可以快速检测可能的趋势反转或修正,在图表中添加一个指标就足够了,之后,您可以更改不同的时间范围以快速找到此类模式,如果没有找到这些模式,或者相反,不是位于历史上最好的地方,您可以更改参数以更好地显示某个货币对。此外,您可以更改显示图案的线条颜色,并启用未完全成型的图案线条的显示。 选项 History - 在图表上搜索形态的柱数; ExtremCountBars - 搜索极值的柱数,例如,第二个峰值的高点(推荐 3-40); MinExtremDist - 2 个极值之间的最小柱数(推荐 2-12,值越高,找到的形态越大); MaxExtremDist - 2 个极值之间的最大柱数(推荐 10-50); MultipleVerticesFilter - 过滤以找到“额外的”高点或低点(如果启用,应该只有 2 个顶部或底部); PeriodMAforEdgeFiltering - 通过 MA 过滤双底和顶部形状的边缘,以便有平滑的
Cosmic Diviner X Planet
Olena Kondratenko
4 (2)
This unique multi-currency strategy simultaneously determines the strength of trends and market entry points, visualizing this using histograms on the chart. The indicator is optimally adapted for trading on the timeframes М5, М15, М30, Н1. For the convenience of users, the indicator renders the entry point (in the form of an arrow), recommended take profit levels (TP1, TP2 with text labels) and the recommended Stop Loss level. The take profit levels (TP1, TP2) are automatically calculated for
Gold Phoenix
Yaroslav Varankin
The perfect tool for Scalng in the Forex markets You can trade both from signal to signal and using take profit  The algorithm does not use Zigzag!  No redrawing!  This is a channel instrument that uses a moving average as a filter. Moving Average  There are 2 parameters for the settings Ma Period = 5 period Moving Average  Channel 1.0 distance of channel lines from the chart Price Signal Filter - calculation of signal opening and filter There is a complete set of Alert There is a multi-timefram
Smoking
Nadiya Mirosh
I suggest that everyone who is interested in the Smoking indicator try to trade. Smoking is a technical analysis tool that uses mathematical calculations to determine various aspects of price movement and is based on historical data. Smoking reveals special aspects of price movement and allows traders to make the right decision. All trading indicators analyze the price from different angles based on historical data. Therefore, it is not entirely correct to say that they can predict the future
该产品的买家也购买
Gann Made Easy
Oleg Rodin
4.92 (63)
Gann Made Easy 是一个专业且易于使用的外汇交易系统,它基于使用先生理论的最佳交易原则。 W.D.江恩。该指标提供准确的买入和卖出信号,包括止损和获利水平。您甚至可以使用推送通知在旅途中进行交易。 购买后请联系我!我将免费与您分享我的交易技巧和丰厚的红利指标! 您可能已经多次听说过江恩交易方法。通常 Gann 的理论不仅对于新手交易者而且对于那些已经有一定交易经验的人来说都是非常复杂的东西。这是因为江恩的交易方法在理论上并不那么容易应用。我花了几年时间来完善这些知识,并将最好的原则应用到我的外汇指标中。 该指标非常易于应用。您所需要的只是将其附加到您的图表并遵循简单的交易建议。该指标不断进行市场分析工作并寻找交易机会。当它检测到一个好的入口点时,它会为您提供一个箭头信号。该指标还显示止损和获利水平。 换句话说,当您像先生一样进行交易时,该指标会为您提供最佳江恩建议。江恩亲自告诉你此时此刻该做什么。但最好的部分是您不需要了解任何有关江恩交易原则的知识,因为该指标会为您完成整个市场分析工作。
Advanced Currency Strength28 Indicator
Bernhard Schweigert
4.9 (663)
目前26%的折扣 任何新手或专家交易者的最佳解决方案! 这个指标是一个独特的、高质量的、可负担得起的交易工具,因为我们纳入了一些专有的功能和一个新的公式。只需一个图表,你就可以读出28个外汇对的货币强度!想象一下,你的交易将如何得到改善,因为你的交易是在你的手中进行的。想象一下,你的交易将如何改善,因为你能够准确地确定新趋势或剥头皮机会的触发点? 用户手册:点击这里  https://www.mql5.com/en/blogs/post/697384 这是第一本,原版的! 不要买一个毫无价值的崇拜者的克隆品。 特别的 子窗口中的箭头显示强劲的货币势头GAP将指导你的交易! 当基础货币或报价货币处于超卖/超买区域(外盘斐波那契水平)时,在个人图表的主窗口中出现警告信号。 当货币力量从外围区间回落时,回撤/反转警报。 十字星模式的特别警报 可选择多个时间框架,以快速查看趋势! 货币强度线在所有的时间框架中都非常平稳,当使用较高的时间框架来识别总体趋势,然后使用较短的时间框架来确定精确的入口时,效果非常好。你可以根据自己的意愿选择任何时间框架。每个时间框架都由其自身进
Dragon Multi Indicator MT4
Mansour Babasafary
5 (1)
74% discount for the next 10 buyers (original price $605): 1 left Get a 50% bonus by buying (or even renting) any of our products. After buying (or renting), send a message for more information. 3 Indicators in 1 indicator Strategy based on price action Made specifically for the best forex currency pairs Can be used in the best time frame of the market at a very reasonable price This indicator is basically 3 different indicatos . But we have combined these 3 indicators in 1 indicator so th
Atomic Analyst
Issam Kassas
5 (3)
首先值得强调的是,该交易指标是非重绘、非延迟的指标,这使其成为手动和机器人交易的理想选择。 用户手册:设置、输入和策略。 Atomic Analyst是一种PA价格行动指标,利用价格的力量和动量来寻找市场上更好的机会。配备了高级过滤器,可帮助去除噪音和假信号,并提高交易潜力。使用多层复杂的指标,Atomic Analyst扫描图表,并将复杂的数学计算转化为任何初学者都能理解并用来做出一致交易决策的简单信号和颜色。 “Atomic Analyst”是专为新手和经验丰富的交易者量身定制的综合交易解决方案。它将高级指标和一流功能融合为一体的交易策略,使其成为所有类型交易者的多功能选择。 日内交易和剥头皮策略:专为快速准确的日内交易和短期交易而设计。 日内和摆动交易策略:可用作追求价格大幅波动的日内和摆动交易者的可靠工具。 多货币和市场:凭借其可靠的精度,在不同的工具和市场上运作。 多个时间框架:可在多个时间框架上使用,性能良好。 稳定性:所有指标均不重绘、不重绘和不滞后,确保可靠的信号。 信号清晰度:提供箭头信号,用于清晰的入场和出场点。 实时警报:通过交易入场、SL和TP警报通知交
TPSpro RFI Levels
Roman Podpora
5 (13)
A key element in trading is zones or levels from which decisions to buy or sell a trading instrument are made. Despite attempts by major players to conceal their presence in the market, they inevitably leave traces. Our task was to learn how to identify these traces and interpret them correctly. Reversal First Impulse levels (RFI)   -  Version MT5                INSTRUCTIONS                 RUS                 ENG                                       R ecommended to use with an indicator   -  
TPSproTREND PrO
Roman Podpora
5 (15)
TPSpro TRENDPRO  - is a trend indicator that automatically analyzes the market and provides information about the trend and each of its changes, as well as giving signals for entering trades without redrawing! The indicator uses each candle, analyzing them separately. referring to different impulses - up or down impulse. Exact entry points into transactions for currencies, crypto, metals, stocks, indices!  -  Version MT5               DETAILED DESCRIPTION        /       TRADING SETUPS           
Advanced Supply Demand
Bernhard Schweigert
4.92 (310)
现在优惠 33%! 任何新手或专业交易者的最佳解决方案! 该指标是一款独特、高质量、且价格合理的交易工具,因为我们已经整合了许多专有功能和新公式。 依据此更新,您将能够显示双重时间帧区域。 您不仅可以显示一个较高的时间帧,还可以同时显示图表时间帧,加上更高的时间帧:显示嵌套时区。 供需双方所有交易者都会喜欢它。 :) 重要信息披露 高级供需的最大潜力,请访问 https://www.mql5.com/zh/blogs/post/720245   想象您的交易如何得以改善,是因为您能够精准定位入场或目标位吗? 构建于新的底层算法,它可以更轻松地识别出买卖双方之间的潜在失衡。 这是因为它以图形方式展示供需最强劲区域,及其过去的表现(显示旧区域)。 这些功能旨在帮助您更轻松地发现最佳入场区域和价位。 现在您可以针对您的交易品种和时间帧来优化和编辑区域强度! 高级供需指标适用于所有产品和时间帧。 它是一个新的公式,非常新的功能是两个区域强度函数可由用户输入进行调整! 这在交易中是一大优势。 当您学习如何使用专有功能,例如带有价格游离最小 X 因子的区域强度时,您能够判断该区域强劲与否。 供
Break and Retest
Mohamed Hassan
4.6 (10)
‍You can visually backtest Break & Retest to see how it behaved in the past!     Manual guide:   Click here $65  for only 2  copies left! Next price is $120 .  This Indicator only places quality trades when the market is really in your favor with a clear break and retest. Patience is key with this price action strategy! Recommended timeframes: M1 for Scalpers.  M5 for Intraday traders. H1 & H4 for Day traders. Other timeframes are also excellent! After many months of hard
使用我们的自定义MT4指标发现成功外汇交易的秘诀! 您是否曾经想过如何在外汇市场上取得成功,一贯赚取利润,同时降低风险? 这是您一直在寻找的答案! 允许我们介绍我们的专有MT4指标,该指标将彻底改变您的交易方法。 独特的多功能性 我们的指标专为喜欢Renko和Rangebar Candle编队的用户而设计。 我们了解到,这些图表类型受到许多经验丰富的交易者的青睐,这就是为什么我们的指标与它们无缝集成,从而提供无与伦比的市场分析。 清晰的趋势信号 忘记复杂的分析! 我们的指标利用鲜艳的色彩和清晰的点结构来明确指示市场趋势。 红色和蓝色的点毫无疑问地对价格变动的方向留下了疑问,从而可以在您的交易中快速决策。 与HH/HL HL/LL策略对齐 如果您正在寻求一个指标,该指标无缝地与基于HH/HL和HL/LL结构的策略无缝合作,则不需要更多。 我们的工具不仅确定了这些形式,而且还促进了它们在投资过程中的有效利用。 绝对的清晰度和简单性 我们的首要任务是为您提供一种不仅有效而且易于使用的工具。 我们的指标是为了清晰而设计的,使您可以专注于做出投资决策,而不是
Quantum Trend Sniper Indicator MT4
Bogdan Ion Puscasu
4.6 (40)
介绍   量子趋势狙击指标 ,突破性的 MQL5 指标,正在改变您识别和交易趋势反转的方式!由拥有超过13年交易经验的资深交易员团队开发,     量子趋势狙击指标   旨在通过其创新的方式以极高的准确度识别趋势反转,将您的交易之旅推向新的高度。 ***购买量子趋势狙击指标,即可免费获得量子突破指标!*** 当量子突破指标识别出趋势反转时,它会向您发出警报和信号箭头,并建议您三个止盈水平。 它既适合新手交易者,也适合专业交易者。 量子 EA 通道:       点击这里 MT5版本:       点击这里 建议: 时间范围:  所有时间范围。为了获得最佳结果,我们建议在 M15、M30 和 H1 时间范围内使用它。 货币对:欧元兑美元、英镑兑美元、澳元兑美元、欧元兑英镑, EURAUD, XAUUSD 账户类型:ECN、Raw 或 Razor,点差极低 经纪时间:任意 经纪商:IC Markets、Pepperstone with Raw 和 Razor 的点差最低 建议止损:50 点 建议止盈水平:20 点、50 点和 1
FX Power MT4 NG
Daniel Stein
5 (10)
通过 mql5 和 Telegram 上 的晨间简报获取每日市场更新,包括详细信息和屏幕截图 ! FX Power MT4 NG 是我们长期以来非常受欢迎的货币强度计算器 FX Power 的下一代产品。 这款下一代强度计算器能提供什么?您所喜爱的原版 FX Power 的所有功能 附加功能 黄金/XAU 强度分析 更精确的计算结果 可单独配置的分析周期 可自定义计算限制,以获得更好的性能 为希望查看更多信息的用户提供特殊的多实例设置 无尽的图形设置,可在每个图表中设置您最喜欢的颜色 无数的通知选项,让您再也不会错过任何重要信息 采用 Windows 11 和 macOS 风格的全新圆角设计 神奇的移动指标面板 FX Power 主要功能 所有主要货币的完整强势历史 所有时间框架内的货币强弱历史 所有经纪商和图表的计算结果完全相同 100% 可靠的实时计算 -> 无重绘 可通过下拉列表选择分析时段 通过自定义模式单独配置分析时段 可在一个图表中使用多个实例 可移动 FX Power 显示屏(通过拖放) 适用于高分辨率 QHD、UHD 和 4K 显示器 自动终端配置 针对平板电脑
Market Reversal Alerts
LEE SAMSON
4.21 (121)
成為突破者,隨著價格反轉,市場結構會改變利潤。 訂單突破者指示器可以識別趨勢或價格走勢何時接近枯竭並準備好逆轉。它會提醒您市場結構的變化,通常會在發生逆轉或重大回調時發生。 該指標使用專有計算來確定突破和價格動能。每當在可能的耗盡點附近形成新的高點時,指標就會繪製最後一個生成該高點的順序塊。然後,它將隨價格移動隨價格跟隨定單。然後,當價格轉向相反方向並突破該訂單塊時,它會提醒您,從而創建新的市場結構並開始趨勢或重大回調的可能逆轉。 訂單塊是在創建高/低之前的最後一個相反的彩色蠟燭,並且當價格跌破這些關鍵區域以下時,這表明趨勢可能會發生短期或長期反轉。 特徵 提醒您關鍵耗盡點的市場結構變化 價格接近耗盡水平時自動提取訂單塊 在一個方向繼續移動時,在價格後面跟踪定單,以提醒您最佳的反轉輸入 將顏色更改為純色塊,以顯示何時發生市場結構中斷。 適用於所有交易品種和時間範圍 內置集成的彈出窗口和電子郵件警報 策略和如何與定單破壞者指標進行交易 當斷路器塊發生時,您有兩個選擇。 看左邊!我們正在尋求供應/需求或支撐/阻力位嗎?市場結構轉變(逆轉)通常發生在價格重新測試舊水平或
Quantum Breakout Indicator PRO
Bogdan Ion Puscasu
4.96 (26)
介绍     Quantum Breakout PRO   ,突破性的 MQL5 指标,正在改变您交易突破区域的方式!   Quantum Breakout PRO 由拥有超过 13 年交易经验的经验丰富的交易者团队开发,旨在通过其创新和动态的突破区域策略将您的交易之旅推向新的高度。 量子突破指标将为您提供带有 5 个利润目标区域的突破区域的信号箭头,以及基于突破框的止损建议。 它既适合新手交易者,也适合专业交易者。 量子 EA 通道:       点击这里 MT5版本:   点击这里 重要的!购买后请私信我领取安装手册。 建议: 时间范围:M15 货币对:GBPJPY、EURJPY、USDJPY、NZDUSD、XAUUSD 账户类型:ECN、Raw 或 Razor,点差极低 经纪商时间:GMT +3 经纪商:IC Markets、Pepperstone with Raw 和 Razor 的点差最低 规格: 不重漆! 最多 5 个建议利润目标区域 建议止损水平 可定制的盒子。您可以设置自己的 Box Time Start 和 Box Time E
首先,值得强调的是,这个交易工具是非重绘、非重画和非滞后的指标,非常适合专业交易。 在线课程,用户手册和演示。 智能价格行动概念指标是一个非常强大的工具,既适用于新手,也适用于经验丰富的交易者。它将超过20个有用的指标合并到一个指标中,结合了高级交易思想,如内圈交易员分析和智能资金概念交易策略。该指标侧重于智能资金概念,提供有关大型机构交易方式的见解,帮助预测它们的动向。 它在流动性分析方面尤其擅长,有助于理解机构的交易方式。它擅长预测市场趋势,并仔细分析价格波动。通过将您的交易与机构策略对齐,您可以更准确地预测市场走向。该指标多才多艺,擅长分析市场结构,识别重要的订单区块,并识别各种模式。 它擅长识别BOS和CHoCH等模式,理解动量的转变,并突出显示供需强劲的关键区域。它还擅长发现强大的不平衡,并分析价格创造更高高点或更低低点的模式。如果您使用斐波那契回撤工具,该指标可以满足您的需求。它还可以识别相等的高点和低点,分析不同的时间框架,并通过仪表板显示数据。 对于使用更高级策略的交易者,该指标提供了工具,如公平价值差指标和优惠和折扣区域的识别。它特别关注高时间框架订单
Trend Screener
STE S.S.COMPANY
4.83 (88)
趋势指标,趋势交易和过滤的突破性独特解决方案,所有重要趋势功能都内置在一个工具中! 它是 100% 非重绘多时间框架和多货币指标,可用于所有符号/工具:外汇、商品、加密货币、指数、股票。 趋势筛选器是有效的指标趋势跟踪指标,它在图表中提供带有点的箭头趋势信号。 趋势分析器指标中可用的功能: 1.趋势扫描仪。 2. 具有最大利润分析的趋势线。 3.趋势货币强度计。 4. 带有警报的趋势反转点。 5. 带有警报的强趋势点。 6. 趋势箭头 每日分析示例,每日信号表现...等与我们的趋势筛选指标,可以在这里找到: 点击这里 限时优惠:Trend Screener Indicator 仅售 50 美元且终身可用。原价 125$) 通过访问我们的 MQL5 博客,您可以找到我们所有的高级指标以及分析示例、每日信号表现...等。 : 点击这里 我们的趋势系统由 2 个指标组成: 1. Trend Screener Indicator:显示趋势仪表盘、图表中的趋势线、入场点...等。 2. Trend Line Map Indicator:显示买卖作为仪表板,活动信号盈利/亏损
Advanced Currency IMPULSE with ALERT
Bernhard Schweigert
4.91 (494)
目前31%的折扣!! 对任何新手或专家交易者来说都是最好的解决方案! 这个指标是一个独特的、高质量的、负担得起的交易工具,因为我们已经纳入了一些专有的功能和一个秘密的公式。只需一张图表,它就能给出所有28种货币对的警报。想象一下,你的交易将如何改善,因为你能够准确地确定新趋势或剥头皮机会的触发点 建立在新的基础算法上,它使识别和确认潜在交易变得更加容易。这是因为它以图形方式显示了一种货币的强势或弱势是否正在加速,并测量了这种加速的速度--把它想象成你汽车中的速度表。当你加速时,事情显然会发生得更快,这在外汇市场上也是一样的,即如果你配对的货币正在向相反的方向加速,你就会发现一个潜在的有利可图的交易。 货币动量的垂直线和箭头将指导你的交易! 动态的市场斐波那契23水平被用作警报触发器,将适应市场活动。如果冲动触及黄色触发线,您将在MetaTrader或您的电子邮件或推送警报中收到警报。然后你就知道作为一个交易员应该做什么。货币对和方向已经给出。只要点击警报按钮,就可以切换到该货币对或打开一个新的图表,以便进一步分析。警报级别可以通过用户输入来改变,可以选择3个敏感度级别
介绍 ON Trade Waves Patterns Harmonic Elliot Wolfe,这是一款高级指标,旨在使用手动和自动方法检测各种市场模式。以下是它的工作原理: 谐波模式: 该指标可以识别出现在您图表上的谐波模式。这些模式对于练习谐波交易理论的交易者非常重要,正如Scott Carney的书《谐波交易第1卷和第2卷》所描述的那样。无论您是手动绘制它们还是依赖自动检测,ON Trade Waves Patterns都可以胜任。 控制面板: 我们配备了一个用户友好的控制面板,它会保存您的图表和时间帧设置,使您可以轻松切换不同配置。您甚至可以最小化它以最大化图表空间。如果您更喜欢使用其他分析工具,只需单击关闭按钮即可隐藏所有指标数据。 模板保存: 当您自定义设置或添加其他指标,如移动平均线或布林带时,该指标会自动保存您的模板。这意味着您可以随时轻松加载您喜欢的设置。 优化显示: 对于Windows 10用户,我们建议调整您的DPI设置以获得高清设备上的最佳屏幕体验。右键单击MetaTrader图标,选择“兼容性”,然后选择“更改高DPI设置”,将其设置为“系统(增强)”。
Scalper Inside PRO
Alexey Minkov
4.75 (57)
An exclusive indicator that utilizes an innovative algorithm to swiftly and accurately determine the market trend. The indicator automatically calculates opening, closing, and profit levels, providing detailed trading statistics. With these features, you can choose the most appropriate trading instrument for the current market conditions. Additionally, you can easily integrate your own arrow indicators into Scalper Inside Pro to quickly evaluate their statistics and profitability. Scalper Inside
Scalper Vault
Oleg Rodin
5 (28)
Scalper Vault 是一个专业的剥头皮系统,为您提供成功剥头皮所需的一切。该指标是一个完整的交易系统,可供外汇和二元期权交易者使用。推荐的时间范围是 M5。 该系统为您提供趋势方向的准确箭头信号。它还为您提供顶部和底部信号以及江恩市场水平。无论您拥有何种交易经验,该系统都易于使用。您只需要遵循简单的规则并每天重复该过程。 建议将此系统用于主要货币对。感谢您的关注! 请注意,该指标在策略测试器中可能无法正常工作。因此,我建议仅在模拟或真实账户的真实交易条件下使用该系统。 指示器提供所有类型的警报,包括推送通知。 购买指标后请与我联系。我将免费与您分享我的个人交易建议和出色的奖励指标! 祝您交易愉快,盈利!
Currency Strength Wizard
Oleg Rodin
4.91 (44)
货币强度向导是一个非常强大的指标,为您提供成功交易的一体化解决方案。该指标使用多个时间范围内所有货币的数据来计算这个或那个外汇对的力量。此数据以易于使用的货币指数和货币电力线的形式表示,您可以使用它们来查看这种或那种货币的力量。 您所需要的只是将指标附加到您要交易的图表上,该指标将向您显示您交易的货币的真实强度。该指标还向您显示买卖量压力的极值,您可以在顺势交易时利用这些压力。该指标还显示了基于斐波那契的可能目标。该指标可用于各种交易时间范围。该指标支持各种货币对的交易。 该指标为您提供所有类型的警报,包括推送通知。 购买后请联系我。我将与您分享我的交易技巧,并免费为您提供丰厚的红利指标! 祝您交易愉快,获利丰厚!
TrendDecoder Premium
Christophe, Pa Trouillas
5 (3)
确定范围和下一步可能的走势   |  获得早期信号和趋势强度   |  在反转之前获得明确的退出   |  了解价格将测试哪些斐波水平 非重绘、非延迟指标 - 手动和自动交易的理想选择 - 适用于所有资产和所有时间单位 限时优惠 >>   50% OFF 购买后,  请联系我的频道  获取推荐设置 MT5   版本: 点击此处 使用   BladeSCALPER   和   PowerZONES   获取我们的完整方法 它是什么? TrendDECODER 集多种创新于一身,使趋势监测变得简单易行。 投射趋势线(Projective TrendLine)--快速参考即将到来的趋势 实时趋势线(RealTime TrendLine)与投射趋势线(Projective TrendLine)的对比 - 与之前的同方向走势相比,市场是加速还是放缓? 实时趋势线交叉 - 趋势正在偏离轨道 使用 GreyBox - 市场不再是趋势并进入新的过渡序列 使用 DecoderSignals 和 Blue/Orange Clouds - 利用作为动态支撑/阻力的 Blue/Orange
PRO Renko System
Oleg Rodin
5 (25)
PRO Renko Arrow Based System for trading renko charts.  准确的信号交易任何外汇工具. 另外,我将免费提供系统的附加模块! PRO Renko系统是RENKO图表上高度准确的交易系统。该系统是通用的。 该交易系统可应用于各种交易工具。 该系统有效地中和了所谓的市场噪音,打开了获得准确反转信号的通道。 该指标易于使用,只有一个参数负责产生信号。 您可以很容易地使算法适应您感兴趣的交易工具和renko酒吧的大小。 我很乐意通过提供任何咨询支持来帮助所有客户有效地使用该指标。 祝您交易成功!购买后,立即写信给我! 我将与您分享我的建议和我的renko发电机。 另外,我将免费提供系统的附加模块!
目前八折优惠! 对任何新手或专家交易者来说都是最好的解决方案! 这个仪表板软件适用于28种货币对。它基于我们的两个主要指标(高级货币强度28和高级货币冲动)。它对整个外汇市场提供了一个伟大的概述。它显示高级货币强度值,货币运动速度和28个外汇对在所有(9)时间段的信号。想象一下,当你可以使用图表上的单一指标观察整个市场,以确定趋势和或剥头皮的机会时,你的交易将得到改善 我们已经在这个指标中建立了一些功能,使你更容易识别强势和弱势货币,同时识别和确认潜在的交易。该指标以图形方式显示货币的强势或弱势是增加还是减少,以及它在所有时间段的表现。 增加的新功能是动态市场斐波那契水平,它适应当前的市场条件变化,这是一个已经在我们的高级货币强度28和高级货币冲动指标中使用的成熟的加分项。 在交易时,总是将弱势货币和强势货币配对,这个新指标将帮助你做到这一点。 用户手册:点击这里  https://www.mql5.com/en/blogs/post/708783 特点  显示每个时间段的ACS28和GAP-speed(冲动)的货币强度值。 列:颜色代码以7种颜色
Shepherd Harmonic Pattern
Abdullah Alrai
4.68 (59)
这个指标将检测手动和自动方法在图表上绘制的谐波模式。 您可以从此链接查看用户手册: 添加您的评论并联系我们以获得它 有一个免费版本可以在mt4上尝试此产品。 您可以使用它来检测Gartley和Nenstar模式: https://www.mql5.com/en/market/product/30181 您可以从以下链接购买完整的MT4版本: https://www.mql5.com/en/market/product/15212 注意 指标具有控制面板,并将保存每个(图表和时间框架)设置。 您可以将其最小化以在图表上获得更多空间,并且如果您更喜欢使用其他分析工具,则可以按关闭按钮隐藏所有指标数据 当您使用此指标并更改设置,添加诸如移动平均线或布林带之类的指标时,此指标将自动保存您的模板编辑,并且您可以随时加载它们。 如果您使用的是Windows 10,请右键单击MetaTrader图标>兼容性>更改高DPI设置>系统(增强)以获得最佳屏幕设置(应在高清设备中完成)。 指标只是谐波交易理论的解释,用于检测图表上的谐波模式。 如果您想学习它,可以搜索Scott Carney的书,名为“Ha
TrendMaestro
Stefano Frisetti
5 (2)
note: this indicator is for METATRADER4, if you want the version for METATRADER5 this is the link:  https://www.mql5.com/it/market/product/108106 TRENDMAESTRO ver 2.4 TRENDMAESTRO recognizes a new TREND in the bud, he never makes mistakes. The certainty of identifying a new TREND is priceless. DESCRIPTION TRENDMAESTRO identifies a new TREND in the bud, this indicator examines the volatility, volumes and momentum to identify the moment in which there is an explosion of one or more of these data a
Black dragon indicator
Ramil Minniakhmetov
4.88 (130)
趋势检测指标将补充任何策略,也可用作独立工具。 使用该指标的建议,您可以在评论 #8 中下载 好处 易于使用,不会因不必要的信息而使图表过载; 可用作任何策略的过滤器; 具有内置的动态支撑和阻力水平,可用于获利和设置止损; 指标在烛台关闭后不会改变颜色;  适用于股票市场、指数、石油、黄金和所有时间范围; 具有吐司通知、邮件通知、推送通知和声音提醒功能。 我的其他开发可以在这里找到: https://www.mql5.com/zh/users/mechanic/seller 输入参数 Alert - 开/关。警报; Push Notification - 开/关。推送通知; Mail - 开/关电子邮件通知; Fibo 1,2,3,4,5,6,7,11,21,31,41,51,61,71 - 动态支撑和阻力位的设置。
此儀表板是與市場結構反轉指標一起使用的警報工具。它的主要目的是提醒您在特定時間範圍內的逆轉機會,以及像指標一樣重新測試警報(確認)。儀表板設計為單獨放置在圖表上,並在後台工作,以向您發送有關您選擇的貨幣對和時間範圍的警報。它是在許多人要求衝刺以同時監控多個貨幣對和時間框架而不是讓市場反轉指標在一個 MT4 中的多個圖表上運行之後開發的。它會在 M5、M15、M30、H1、H4 和 D1 時間範圍內發出警報。當然,與交易中的任何事情一樣,更高的時間框架效果最好。 該儀表板被設計為市場結構反轉指標的附加組件。它將獨立工作,並提醒市場反轉警報指標給出的模式和信號。 在此處獲取市場反轉警報指標: https://www.mql5.com/en/market/product/46295 此儀表板的 MT5 版本可在此處獲得: https://www.mql5.com/en/market/product/65828 此處提供 EA:汽車交易市場反轉警報! https://www.mql5.com/en/market/product/65383 我創建的用於繪製矩形並提醒特定貨幣對的市
Up down v6T
Guner Koca
5 (1)
Thise indicator is up down v6  comes with tradingwiev pinescript. purchased people, after installed on terminal ,contact me on mql5  to get BONUS  TradingView pinescript. up-down indicator is no repaint and works all pairs and lower than weekly time frames charts. it is suitable also 1 m charts for all pairs. and hold long way to signal. dont gives too many signals. when red histogram cross trigger line that is up signal.and price probably will down when blue histogram cross trigger line that
FX Volume
Daniel Stein
4.6 (35)
通过 mql5 和 Telegram 上 的 " 晨间简报 "获取每日市场更新,包括详细信息和屏幕截图 ! 外汇交易量(FX Volume)是第一个也是唯一一个从经纪商角度真正洞察市场情绪的交易量指标。 直接在您的图表上看到这些信息是真正改变游戏规则和突破性的交易解决方案。 受益于独特的市场数据洞察,如 比率(Ratios )显示货币多头和空头头寸的比率(百分比 比率变化 显示所选时间段内的多头比率及其百分比变化 总交易量 显示货币的总交易量(多头和空头),以手为单位 多头 交易量显示货币所有多头头寸的交易量 空头 交易量显示所有货币空头头寸的交易量 净多头 显示净多头交易量,即所有多头头寸减去所有空头头寸(以手为单位)。 净多头百分比 显示货币净多头交易量的变化 请阅读我们的基本教程 -> "如何使用外汇交易量进行交易 " 获取更多信息,如常见问题、交易技巧和教程视频,请访问我们的 外汇交易量公共信息频道 请 安装并运行 SI Connect 以建立与我们数据中心的持续连接 背景信息 我们都知道,外汇是一个分散的市场。这就是为什么我们必须打破常规思维,开发一个独
on free demo press zoom out button to see back.. cnt number is bar numbers.you can change up to 3000 related to chart bars numbers. minimum value is 500. there is g value set to 1.01. no need to change it. this indicator almost grail,no repaint and all pairs ,all timeframe indicator. there is red and blue histograms. if gold x sign comes on red histogram that is sell signal. if blue x sign comes on blue histogram that is buy signal. this indicator on thise version works all pairs.al timeframes
作者的更多信息
HFTHackerMT5
Thomas Bradley Butler
5 (1)
信号:我的个人资料上的 HFT 黑客链接 *在测试和使用之前优化 EA。 仅在优化后才购买。 这适合那些知道如何优化并希望凭借自身优势获利的交易者。 您设定您的风险参数。 如果您选择不成功的交易,则可通过止损获得高胜率。 降低长寿风险。 这适用于所有帐户,是一个风险管理工具,请阅读所有评论、描述和博客。 如何获得最佳结果: https://www.mql5.com/en/blogs/post/754836 MT4版本: https://www.mql5.com/en/market/product/73834 在每微秒都至关重要的繁华高频交易 (HFT) 世界里,住着一个神秘人物,人们只知道他是“高频交易黑客”(HFT Hacker)。 高频交易黑客凭借闪电般的反应速度和驾驭市场复杂算法的不可思议的能力,成为交易者中的传奇人物。 传说,高频交易黑客最初是一名卑微的程序员,在互联网深处修补代码。 但随着他对金融世界的深入研究,他发现了高频交易的秘密——眨眼间买入卖出价并卖出买入价的艺术。 凭借新发现的知识,高频交易黑客开始征服金融市场。 在每笔交易中,他都抓住了动量的价
Pin Bar Scalper
Thomas Bradley Butler
OPTMIZE EA BEFORE BACKTEST AND USE. Pin Bar Scalper scalps pin bars and momentum on 5 minute charts on the EUR/USD.  Optimize the parameters to get the best  out of the EA.  Pin bars are popular candlesticks that show that the price has been taken over by the bulls or bears. The inputs are based around the size of the pin bars in %, which are 3 different ones.  Wicks and body are the calculations within the parameter.  Test file in comments for example only.  Trade the dates _
NeuroScalper
Thomas Bradley Butler
5 (2)
更新!箭头被添加到 100 和 200 级别。 该指标可准确访问极端情况,并主要支持 1 分钟时间范围内的买入头寸。可以使用其他时间范围,但级别不同。它是一个更好的振荡器,并与其他振荡器进行比较以查看差异。 使用神经网络概念的日间交易。该指标使用神经网络的基本形式来生成买卖信号。在 1 分钟图表上使用该指标。指示器不会重新绘制。下载并使用 1 分钟图表或其他使用不同级别的图表在测试仪上运行,分析交易以亲自查看。剥头皮市场的许多机会。可用于更高的时间范围,但应根据您的判断更改水平。较高的时间范围具有较高的范围。 使用此模型要考虑的概念和事项: 使用了多个指标,应用了权重,最大值和最小值为 2 个数据点。该指标主要用于交易上升趋势在振荡器的设置(见图)100 和 200 中添加级别,如果使用不同的时间框架,则添加其他级别。
Evolved Trends
Thomas Bradley Butler
OPTIMIZE BEFORE TEST AND USE TO FIND BEST INPUTS Hey there traders! Want a cutting-edge Expert Advisor for your MT4 platform? Look no further than Evolved Trends! This powerful trading algorithm, created with machine learning technology, focuses on trading GBP/USD on 1 Hour time frames. But hey, feel free to experiment with other assets and time frames for optimization! Just customize the inputs to match your own risk tolerance. With stops based on ATR and the ability to lock in profits and c
VolumeDayTrader
Thomas Bradley Butler
僅限股票(差價合約)的日間交易。 交易需要工作。 沒有捷徑或指標可以告訴您所有的進入和退出。 利潤來自心態。 指標是與資金管理和成功心理學結合使用的工具。 查找音量配置文件中的不平衡。 貿易價格量不平衡。 許多不平衡發生在收盤、開盤和新聞中。 查看股票中的買家與賣家。 使用 5 分鐘到 1 小時來查看誰可以控制價格並發現價格不平衡。 更大的股票是 15 分鐘及以上。 將鼠標懸停在顏色音量條上以查看過去條的數量。 當前條形圖的音量寫在右上角。 找出交易量的不平衡,看看價格在一段時間內可能走向何方。 跟隨主導趨勢以獲得最佳結果 如果趨勢發展尋找交易趨勢。 使用追踪止損並留意大量反轉不平衡。 交易 Apple、SPY、GOOLE、TESLA。 所有你最喜歡的股票
Crypto Net
Thomas Bradley Butler
Crypto Net 用于在  BTCUSD。 它使用基因进化来进化策略。 该 EA 交易趋势遵循 ATR 和 Ichimoku 指标。 这是构建并通过了一系列强大的测试,包括 Monte Carlo 和 Walk Forward。 输入: 最低风险的账户百分比。 最大手数 停止交易的时间 没有其他任何改变。 Crypto Net 用于在 BTCUSD。 它使用基因进化来进化策略。 该 EA 交易趋势遵循 ATR 和 Ichimoku 指标。 这是构建并通过了一系列强大的测试,包括 Monte Carlo 和 Walk Forward。 输入: 最低风险的账户百分比。 最大手数 停止交易的时间 没有其他任何改变。 输入: 最低风险的账户百分比。 最大手数 停止交易的时间 没有其他任何改变。 输入: 最低风险的账户百分比。 最大手数 停止交易的时间 没有其他任何改变。
Bitcoin M5
Thomas Bradley Butler
OPTIMIZE EA BEFORE TEST AND USE. Bitcoin M5 is for trading BTC/USD on 5 min charts.  SL and TP should Start with 50000.  OPTIMIZE BEFORE USE The trading strategy uses Bollinger Bands and Envelopes indicators to trade from.  Trading to catch some breakout points of where the price breaches the bands and then exiting when the price crosses the envelopes.  Every trade uses a fixed lot amount and has a SL and TP.  The EA does not use martingale or hedging in the logic.
ForexReversal
Thomas Bradley Butler
4 (1)
耐心是无压力剥头皮的关键。 当您看到它通过 200 移动平均线时交易箭头,并通过扩大或从没有移动平均过滤器的最后一个摆动点形成趋势。 适用于 1 分钟时间框架,捕捉日内动量走势。 使用追踪止损轻松获得 20 个点或为更大的趋势停留更长时间。 查看该指标中真正大笔交易的照片中的示例。 1 分钟的时间框架效果最好。 缩小以查看趋势。 箭头不会重新绘制或重新计算。 附加到 1 分钟的时间框架并研究交易,看看它是否可用于您的策略。 一世 规则: 买蓝色 红色出售 远离横盘整理 交易量大,交易动量 使用止损 耐心是无压力剥头皮的关键。 当您看到它通过 200 移动平均线时交易箭头,并通过扩大或从没有移动平均过滤器的最后一个摆动点形成趋势。 适用于 1 分钟时间框架,捕捉日内动量走势。 使用追踪止损轻松获得 20 个点或为更大的趋势停留更长时间。 查看该指标中真正大笔交易的照片中的示例。 1 分钟的时间框架效果最好。 缩小以查看趋势。 箭头不会重新绘制或重新计算。 附加到 1 分钟的时间框架并研究交易,看看它是否可用于您的策略。 一世 规则: 买蓝色 红色出售 远离横
Level 2 Trading
Thomas Bradley Butler
与智能音量跟踪器结合使用: https://www.mql5.com/en/market/product/116650 与足迹图结合: https://www.mql5.com/en/market/product/94153 与区域内的交易相结合: https://www.mql5.com/en/market/product/110194 与日间交易量结合:h https://www.mql5.com/en/market/product/72498 与订单簿结合: https://www.mql5.com/en/market/product/102247 2 级交易是一种指标,可帮助您在 MetaTrader 图表上可视化当前的出价和要价交易量。 这就像快速了解市场上的买卖活动,让您了解压力在哪里形成。 它显示了什么 买价和卖价:该指标显示标签,显示买价(买入)和卖价(卖出)量。 实时更新:随着市场的变化,买价和卖价会自动更新,为您提供市场的实时视图。 为什么它有用 快速市场洞察:二级交易为您提供了一种衡量市场情绪的直接方法。 通过查看买入量和卖出量,您可以确
GoldBuyBackScalper
Thomas Bradley Butler
4 (1)
该指标仅适用于 XAU/USD,1 分钟图表。 每对都有独特的特征和价格走势。 使用该指标交易 V 形反转。 头皮使用追踪止损购买并避免新闻,因为它们更加极端并且可能导致突然抛售。 在回测中附加到 1 分钟的时间范围并查看反转购买。 指标从不重新绘制或重新计算。 仅在营业时间内交易 该指标仅适用于 XAU/USD,1 分钟图表。 每对都有独特的特征和价格走势。 使用该指标交易 V 形反转。 头皮使用追踪止损购买并避免新闻,因为它们更加极端并且可能导致突然抛售。 在回测中附加到 1 分钟的时间范围并查看反转购买。 指标从不重新绘制或重新计算。 仅在营业时间内交易 该指标仅适用于 XAU/USD,1 分钟图表。 每对都有独特的特征和价格走势。 使用该指标交易 V 形反转。 头皮使用追踪止损购买并避免新闻,因为它们更加极端并且可能导致突然抛售。 在回测中附加到 1 分钟的时间范围并查看反转购买。 指标从不重新绘制或重新计算。 仅在营业时间内交易
TrueSupplyandDemand
Thomas Bradley Butler
This is based on short term strength or weakness and not on moving averages.  Moving averages are used for filter only. Trade supply and demand with arrows. Supply and demand breakouts and strength of the buyers or sellers .  Don't trade buy arrow to sell arrow.  Trade the strength with trendlines or moving averages and use stops.  The arrow can have some strong moves.  Trade on all time frames.  Try it out in the back tester. The pips can be made with this indicator, follow the arrows and mak
ScalpingMaster
Thomas Bradley Butler
Master scalping with this indicator.  Trade on any time frame for scalps on buy or sells.  Follow trends using a 200 moving average and stops and targets.  Use with your own system.  This indicator can give pips if following it correctly.  Stick to rules and pick up pips daily.  Use as entries in a trend, scalp for a few pips or exit on opposite signal.  Best to follow higher time frame trends. Indicator doesn't repaint or recalculate. Rules: Don't trade overnight, only trade during active sessi
DayTradeKing
Thomas Bradley Butler
This indicator is good for small time frames like 1 and 5 minutes and made for day trading. The indicator never repaints or recalculates. The indicator works is for trading swing points in day trading, following bulls or bears.  Its a simple to use, non cluttered indicator with a high success rate.  This indicator works well to capture ranges.  All indicators come with limitations and no indicator or system is always accurate. Use money management for long term trading success.   Place in backte
DTKGold
Thomas Bradley Butler
This is the DayTradeKing for gold on a 1 minute time frame.  It is a different calculation for the range. Use a 200 period moving average as a filter.  Always use stops and avoid news, wait for more conformation.  This looks to capture intraday ranges. Put it in the back tester on 1 minute to see the price action and how it works. Trade with trend Use filter Use stops Alerts are added for pop ups and sound. 
SuperArrowScalper
Thomas Bradley Butler
Trade trends with the Super Scalper Use on all time frames and assets it is  designed for scalping trends. Works good on small time frames for day trading.  The arrows are easy to follow.  This is a simple no repaint/no recalculate arrow indicator to follow trends with.  Use in conjunction with your own system or use moving averages.  Always use stops just below or above the last swing point or your own money management system The indicator comes with push notifications, sound alerts and email
Levels Trading
Thomas Bradley Butler
This indicator is a simple stripped down version of any advanced support and resistance indicator.  All the support and resistance indicators work from a number of bars that have developed over time. Get rid of clutter and confusing levels.  Find levels according to a number of bars. Look at days, session, numbers of hours, periods of consolidation.  Watch levels develop and use as breakout points, or areas of buyers and sellers.  Features and things to consider This indicator is for a frame of
ForexReversalEA
Thomas Bradley Butler
https://www.mql5.com/en/market/product/57345 该 EA 基于外汇反转指标。 如果您更喜欢手动交易系统,请下载指标并试用。 EA 将跟随趋势并相应地开仓。 结果显示具有较低回撤的稳定收益,但在回测器、优化器和时间框架中进行试验,看看什么有效。 显示的所有结果都是假设的。 注意:这不是鞅或网格。 该指标确实具有对冲能力 此 EA 具有以下功能,并根据您的风险进行更改。 EA根据可用保证金添加,根据参数买卖。 通过输入控制风险。 inp 5 是卖 inp 7 是购买 固定止损手数 固定获利   可用保证金百分比 该 EA 基于外汇反转指标。 如果您更喜欢手动交易系统,请下载指标并试用。 EA 将跟随趋势并相应地开仓。 结果显示具有较低回撤的稳定收益,但在回测器、优化器和时间框架中进行试验,看看什么有效。 显示的所有结果都是假设的。 注意:这不是鞅或网格。 该指标确实具有对冲能力 此 EA 具有以下功能,并根据您的风险进行更改。 EA根据可用保证金添加,根据参数买卖。 通过输入控制风险。
HFTHacker
Thomas Bradley Butler
信号:我的个人资料上的 HFT 黑客链接 *在测试和使用之前优化 EA。 仅在优化后才购买。 这适合那些知道如何优化并希望凭借自身优势获利的交易者。 您设定您的风险参数。 如果您选择不成功的交易,则可通过止损获得高胜率。 降低长寿风险。 这适用于所有帐户,是一个风险管理工具,请阅读所有评论、描述和博客。 如何获得最佳结果: https://www.mql5.com/en/blogs/post/754836 MT4版本: https://www.mql5.com/en/market/product/73834 在每微秒都至关重要的繁华高频交易 (HFT) 世界里,住着一个神秘人物,人们只知道他是“高频交易黑客”(HFT Hacker)。 高频交易黑客凭借闪电般的反应速度和驾驭市场复杂算法的不可思议的能力,成为交易者中的传奇人物。 传说,高频交易黑客最初是一名卑微的程序员,在互联网深处修补代码。 但随着他对金融世界的深入研究,他发现了高频交易的秘密——眨眼间买入卖出价并卖出买入价的艺术。 凭借新发现的知识,高频交易黑客开始征服金融市场。 在每笔交易中,他都抓住了动量的
MarketMaker
Thomas Bradley Butler
自动化供需交易。做一个市场。 这个 EA 的制作和灵感来自于每个人都在销售和模仿的流行供需指标。 EA 继续交易和对冲,做市。也可以在非对冲账户上交易。需要评估风险并使用时间框架、手数、对冲能力。我已经在一个月左右的时间里一次断断续续地交易了多对。 系统概念: EA 交易供需水平。水平发生变化,因此 EA 将继续交易新水平。在手数较低的多对之间进行分配是系统中的一项功能。在保持稳定收益的同时,应避免大幅回撤。 SL 可以使用,但我解释的对冲方面允许这是一种选择。我在多对小手上得到的回撤是 4%,这是没有止损的。较大的地块显示为 6%。因此,较小的尺寸是保守的,而较大的则更具侵略性。这些是保持交易手数低于余额的原因。行业需要发展空间。 特征: 贸易计数 固定手数 音量上限 止损 获利
Top Trader
Thomas Bradley Butler
Top Trader Indicator This is an arrow reversal indicator. This is with deviations and arrows.  Trade a blue arrow for buy and trade a red arrow for sell.  Change the time period and the deviations of the bands.  This is similar to others but these arrows don't repaint.  Load in back tester and study which periods and deviations work the best.  It works on all time frames.  15 min to 1 hr would give good results for take profits.  Try according to your own risk management.
Quant Bot
Thomas Bradley Butler
Quant Bot 用于欧元/美元一小时时间框架内的趋势交易。 没有设置文件,但如果使用其他对,则可能需要优化。 关于机器人: 它使用基因生成并使用 ATR 进行交易。 前行期用于防止曲线拟合 EA 在每笔交易中都使用止损。 资金管理是按余额百分比放大 回溯期为 2003-2020 年,前进期为 2020-2022 年。(见图)。 Quant Bot 用于欧元/美元一小时时间框架内的趋势交易。 没有设置文件,但如果使用其他对,则可能需要优化。 关于机器人: 它使用基因生成并使用 ATR 进行交易。 前行期用于防止曲线拟合 EA 在每笔交易中都使用止损。 资金管理是按余额百分比放大 回溯期为 2003-2020 年,前进期为 2020-2022 年。(见图)。
Golden Standard
Thomas Bradley Butler
对于 XAU/美元 这是一个稳定的交易系统,使用随机生成和趋势跟踪交易。 Expert 使用质量数据进行了回测,完成了一个优化期以及 Monte Carlo 模拟,以避免在 XAU/USD 1 小时时间范围内过度拟合。 使用止损和获利。 EA 有多种配置,除了计算要交易的手数之外别无他法。 特征: 使用余额百分比复合利润 对于 XAU/美元 这是一个稳定的交易系统,使用随机生成和趋势跟踪交易。 Expert 使用质量数据进行了回测,完成了一个优化期以及 Monte Carlo 模拟,以避免在 XAU/USD 1 小时时间范围内过度拟合。 使用止损和获利。 EA 有多种配置,除了计算要交易的手数之外别无他法。 特征: 使用余额百分比复合利润 对于 XAU/美元 这是一个稳定的交易系统,使用随机生成和趋势跟踪交易。 Expert 使用质量数据进行了回测,完成了一个优化期以及 Monte Carlo 模拟,以避免在 XAU/USD 1 小时时间范围内过度拟合。 使用止损和获利。 EA 有多种配置,除了计算要交易的手数之外别无他法。
PropTrader
Thomas Bradley Butler
*使用前优化 EA* 欧元/美元优化外汇交易策略 通过专家顾问 (EA) 在一两年内获得巨额财富是一个不切实际的说法。 回测和真实交易重点关注欧元/美元货币对。 关于该策略: 这代表了我们战略的初始迭代,并有进一步发展的潜力。 经过 100% 质量数据的严格测试,没有 MT4 错误。 该策略按照趋势跟踪的逻辑原则运作。 当趋势看涨时,EA 启动并部署追踪止损,反之亦然。 本质上,这是一种简单的趋势跟踪方法。 主要优点和注意事项: 轻松设置:坚持使用默认设置,仅根据您的喜好修改批量大小。 风险管理:该策略不采用鞅或对冲。 风险缓解:每笔交易都配备了追踪止损和止盈水平,由平均真实波动幅度 (ATR) 确定,有助于更好的风险管理。 趋势识别:此方法旨在帮助交易者识别并利用更持久的趋势。 外汇交易风险免责声明: 外汇交易涉及保证金交易外币,风险较高,可能并不适合所有投资者。 过去的表现并不是未来业绩的保证。
Down Under
Thomas Bradley Butler
Down Under 在 1 小时的时间范围内交易澳元/美元对。 该 EA 交易 ATR 和 OHLC。 它在这个时间范围内为这对格式化。 复合使用分钟。 手数和最大。 批量。 余额的百分比是在获胜交易中复合的。 随着余额波动,手数也会波动。 设置: 毫米风险% 毫米批次 最大手数 没有什么可以改变的。 这没有马丁格尔或对冲能力。 唯一需要更改的其他功能是,如果您交易的是澳元/美元的差价合约。 在经纪人平台上按小数点更改。 风险免责声明 期货、期权和货币交易都有很大的潜在回报,但也有很大的潜在风险。 为了投资这些市场,您必须意识到风险并愿意接受它们。 Down Under 在 1 小时的时间范围内交易澳元/美元对。 该 EA 交易 ATR 和 OHLC。 它在这个时间范围内为这对格式化。 复合使用分钟。 手数和最大。 批量。 余额的百分比是在获胜交易中复合的。 随着余额波动,手数也会波动。 设置: 毫米风险% 毫米批次 最大手数 没有什么可以改变的。 这没有马丁格尔或对冲能力。 唯一需要更改的其他功能是,如果您交易的是澳元/
Cable Trader
Thomas Bradley Butler
GBP/USD 1hr. 该 EA 交易动量和会话。 这有一个固定的手数组成部分,并将随着它的发展继续修改 TP。 设置: 批量 没有什么可以改变的。 这没有马丁格尔或对冲能力。 唯一要更改的其他功能是,如果您交易的是英镑/美元的差价合约。 在经纪人平台上按小数点更改。 风险免责声明 期货、期权和货币交易都有很大的潜在回报,但也有很大的潜在风险。 为了投资这些市场,您必须意识到风险并愿意接受它们。 Cable Trade 在 1 小时的时间范围内交易 GBP/USD 对。 现场交易前的演示。 该 EA 交易动量和会话。 这有一个固定的手数组成部分,并将随着它的发展继续修改 TP。 设置: 批量 没有什么可以改变的。 这没有马丁格尔或对冲能力。 唯一要更改的其他功能是,如果您交易的是英镑/美元的差价合约。 在经纪人平台上按小数点更改。 风险免责声明 期货、期权和货币交易都有很大的潜在回报,但也有很大的潜在风险。 为了投资这些市场,您必须意识到风险并愿意接受它们。
Euclidean
Thomas Bradley Butler
欧几里得是我 8 年前提出的一种独特的交易算法。 该 EA 是该系统的一部分。 它作为一个封闭系统工作。 当角度正确以捕捉趋势时,EA 将启动买入。 止损是角度的10%。 就是这么简单。 输入: 手数余额百分比 1 微手 1,000 美元 获利水平 = 默认为 50 点 如何和需要考虑的事项: 止损是内置的,并根据价格以 10% 的角度进行交易。 止盈设置为 50 点,但可以是您想要的金额。 在 1 到 5 分钟的小时间范围内进行交易。 在回测器中对此进行测试的错误为零。 不同的平台和经纪人有不同的数据,因此请检查下载数据以进行测试。 外汇交易风险免责声明 欧几里得是我 8 年前提出的一种独特的交易算法。 该 EA 是该系统的一部分。 它作为一个封闭系统工作。 当角度正确以捕捉趋势时,EA 将启动买入。 止损是角度的10%。 就是这么简单。 输入: 手数余额百分比 交易量上限 = 最大手数 获利水平 = 默认为 50 点 如何和需要考虑的事项: 止损是内置的,并根据价格以 10% 的角度进行交易。 止盈设置为 50 点,但可以是您想要的金额。
Pip Scalper
Thomas Bradley Butler
每个人的指标 Pip Scalper 用于剥头皮趋势。 使用此指标更长时间地保持趋势。 它适用于所有时间框架和资产。 使用此工具获取每日点数。 使用 200 移动平均线过滤交易。 建议使用较小的时间范围。 用于日间交易。 关于和如何使用: Pips Scalper 基于长期趋势交易。 买蓝色 卖出红色 在活跃期间使用 200 移动平均线作为过滤器和交易。 Pip Scalper 用于剥头皮趋势。 使用此指标更长时间地保持趋势。 它适用于所有时间框架和资产。 使用此工具获取每日点数。 使用 200 移动平均线过滤交易。 建议使用较小的时间范围。 用于日间交易。 关于和如何使用: Pips Scalper 基于长期趋势交易。 买蓝色 卖出红色 在活跃期间使用 200 移动平均线作为过滤器和交易。
Order Flow Trader
Thomas Bradley Butler
Just a simplified way of observing the volume.  It shows the buy flow against the sell flow.  See the volume coming in and trade with the money.  Visualize the trend rising or falling and trade according to the imbalance in volume.  Use for scalping and trend trading.  Trade by volume coming in. FOOTPRINT CHART:  https://www.mql5.com/en/market/product/94153 Order Book:  https://www.mql5.com/en/market/product/102247 EA Based:  https://www.mql5.com/en/market/product/82585 Note: Works in real
Combine Winner
Thomas Bradley Butler
Trade any Forex combine out there.  Many prop firms offer challenge or instant funding combines.  The biggest problem is controlling the loss.  With this indicator you can get a visual system that can limit loss and teach discipline.  This uses the MACD and the strategy is scalping.  You can determine the risk and reward.  Visually follow small trends for scalps.  Trade during active sessions.  It's just a simple system to instill discipline while limiting loss and scalping pips with the paramet
Holy Grail Arrow
Thomas Bradley Butler
Holy Grail arrow is for scalping.  The period you use will determine the trend.  You can try different time frames and periods to see what works best for your strategy.  Filters can be applied like a moving average or trendlines.  The 1 minute works good for scalps and always trade during active periods and avoid consolidation times.  Using other indicators to determine trends is recommended but this can also be a free flowing scalping system alone with tp and sl. Inputs: Period = trend period
筛选:
pitaleks21
14
pitaleks21 2024.04.13 16:52 
 

用户没有留下任何评级信息

回复评论