MACD Color Indicator
- 指标
- Adrian Hernandez Castellanos
- 版本: 1.9
- 更新: 29 二月 2024
- 激活: 20
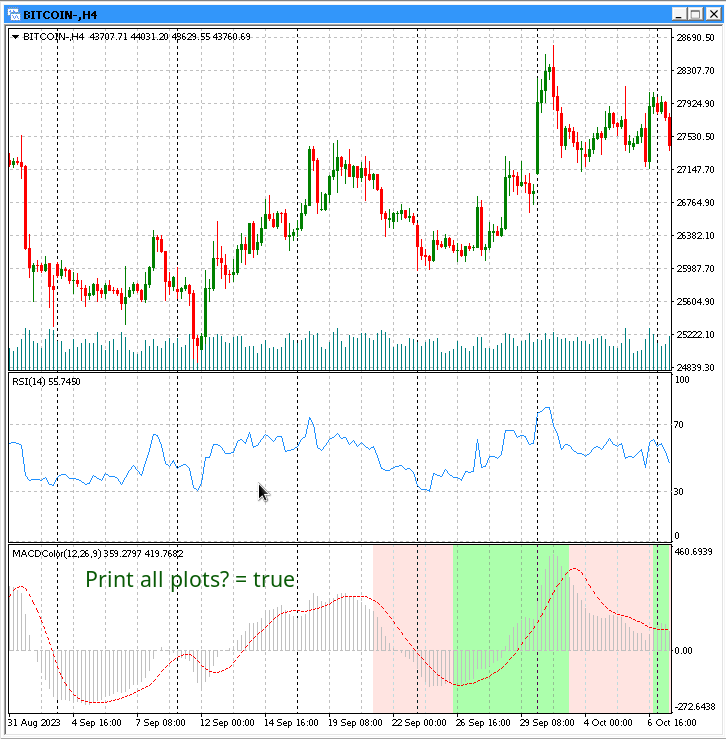
指标 MACD 与趋势买卖背景色
这个指标根据 MACD (移动平均收敛离散) 指标的值来为图表背景着色,取决于它买卖的倾向。背景色由随机震荡器的参数决定,只绘制最近400根K线(见注释),用于衡量趋势强度和逆转概率。
你可以修改的参数包括:
- Fast EMA: 快速指数移动平均线的周期。
- Slow EMA: 慢速指数移动平均线的周期。
- MACD SMA: 计算 MACD 信号线的简单移动平均线。
- Apply To: (Close price, Open price, High price, Low price, Median price, Typical price, Weighted price).
- Color Positive Trend: 上升趋势的背景色。
- Color Negative Trend: 下降趋势的背景色。
- Color Neutral Trend: 中性趋势的背景色。
- Print all plots?: 默认情况下,只绘制最多两周之前的指标值。如果你想要更多值,从K线开始,你需要使用“true”值(见注释)。
使用说明
像任何其他 MetaTrader 指标一样,拖放至图表即可。
结论
这个指标对于使用 MACD 指标的交易者来说是一个很实用的工具。它可以方便地实时识别上涨、下跌和中性趋势。
注释
- 如果你是市场分析师或你的交易使用不同的时间框架,建议使用免费工具: https://www.mql5.com/zh/market/product/109511
- 由于资源消耗高和执行速度快,建议使用参数“显示所有图像?= false”。这将把指标获得的值限制在最多两周(或你 MetaTrader 选项中定义的K线)。
- 限制为400根K线是因为市场交易者通常需要快速的可视数据,这就是这个限制的原因。(请在相关部分留下任何关于此问题的评论)。无论如何,如果你想暂时克服这个限制,你也可以使用第一个注释中提到的免费工具,从你感兴趣的K线到当前时间使用它,这两个工具都设计成兼容。