TradeInfo MultiPairs Mew
- 指标
- Vu Bao Linh
- 版本: 1.0
- 激活: 5
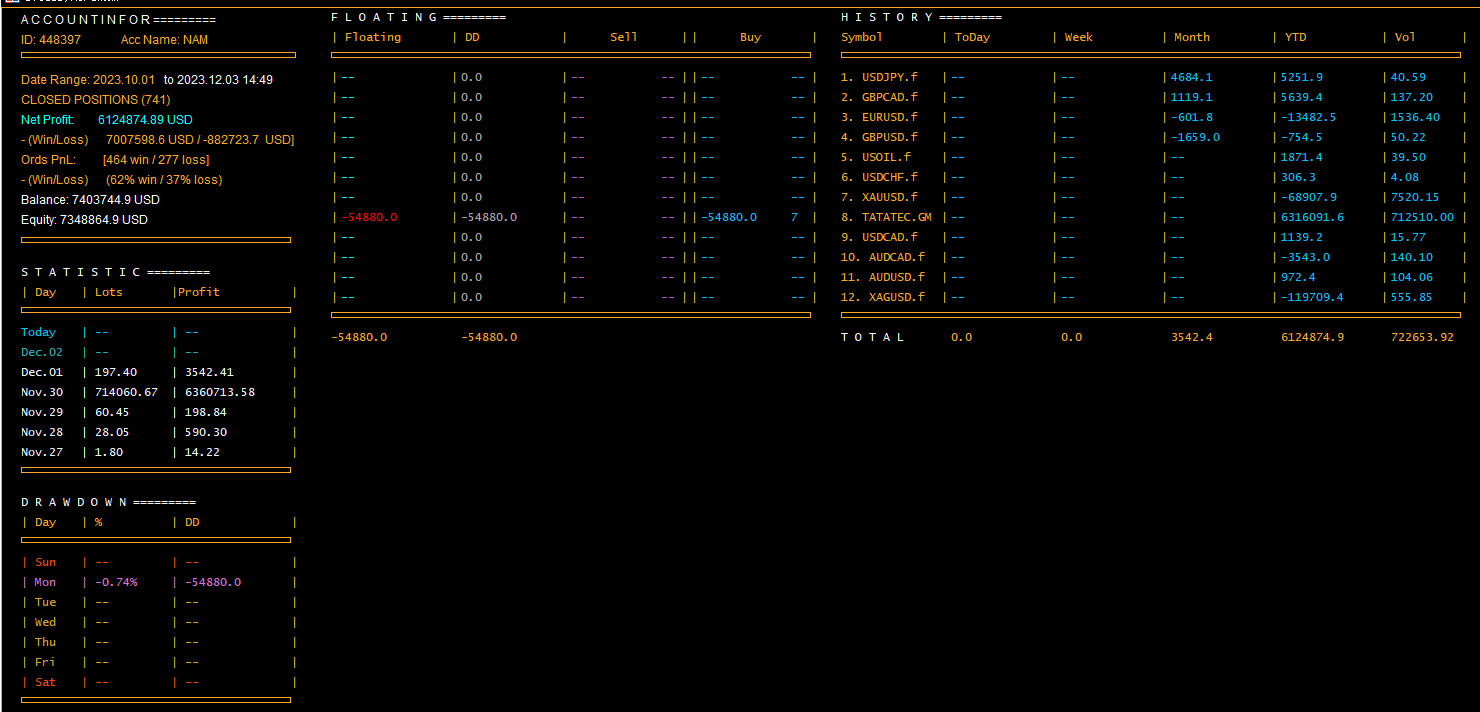
Indicator Statistics MultiPairs
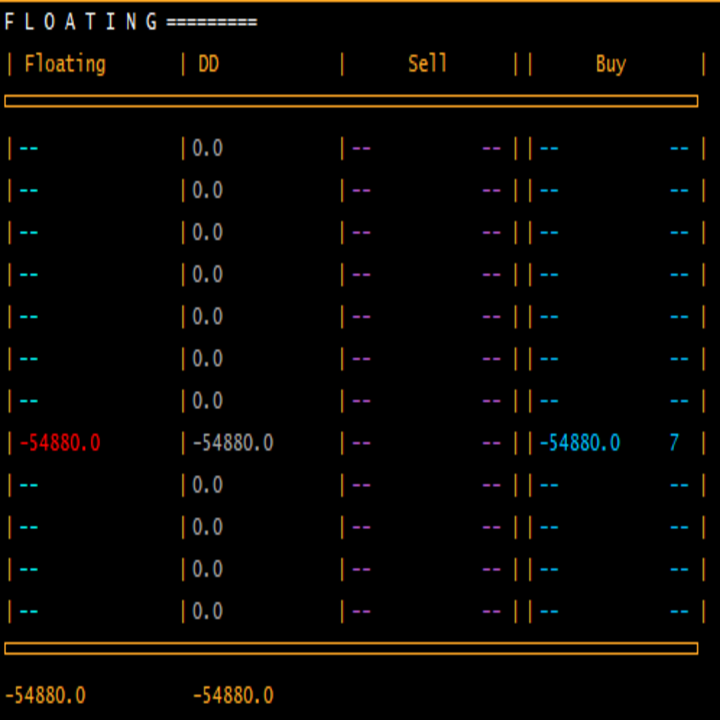
1. Current Openning Ords
- Symbols Openning
+ Buy Orders
+ Buy Volume
+ Sell Orders
+Sell Volume
- DrawDown by Symbols
- Floating by Symbols
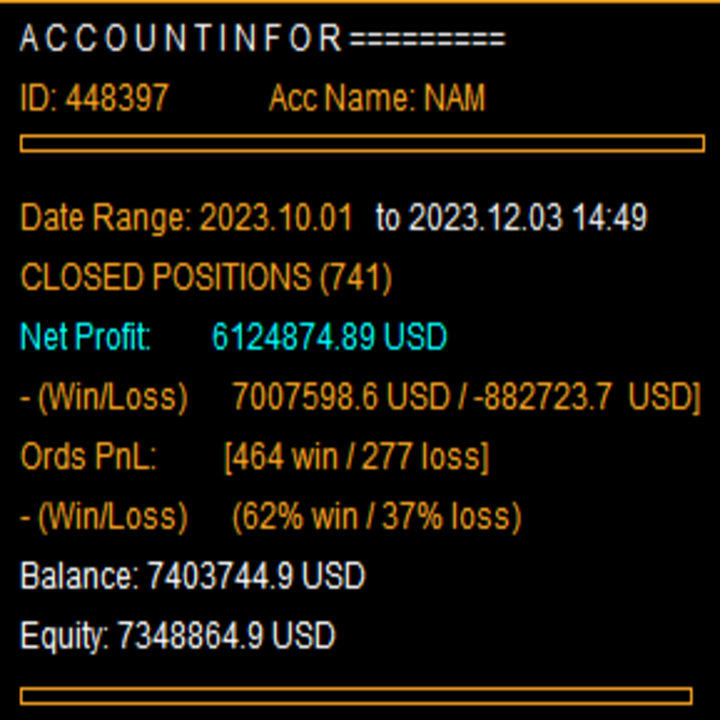
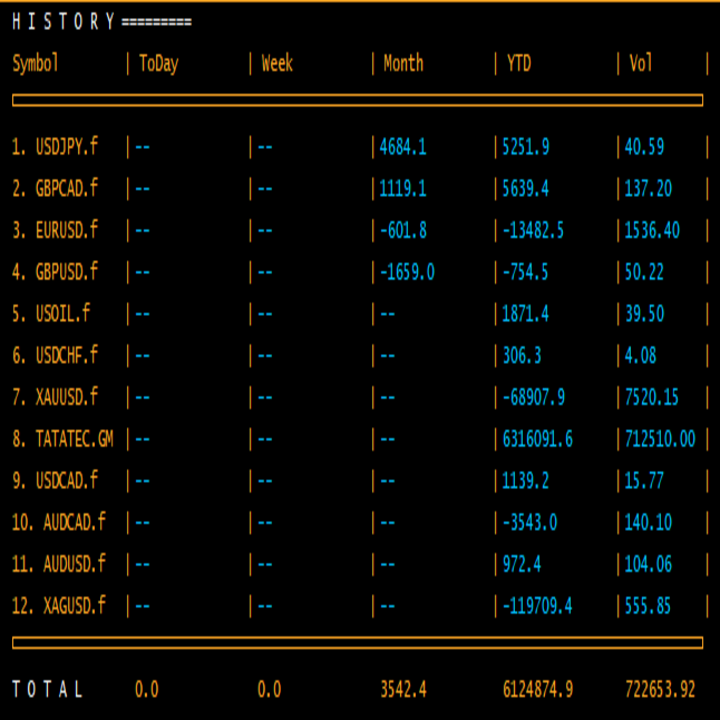
2. Closed Orders
- Statistics by Today, Week, Month, YTD and Volume
- Sum of Closed Orders by Symbol
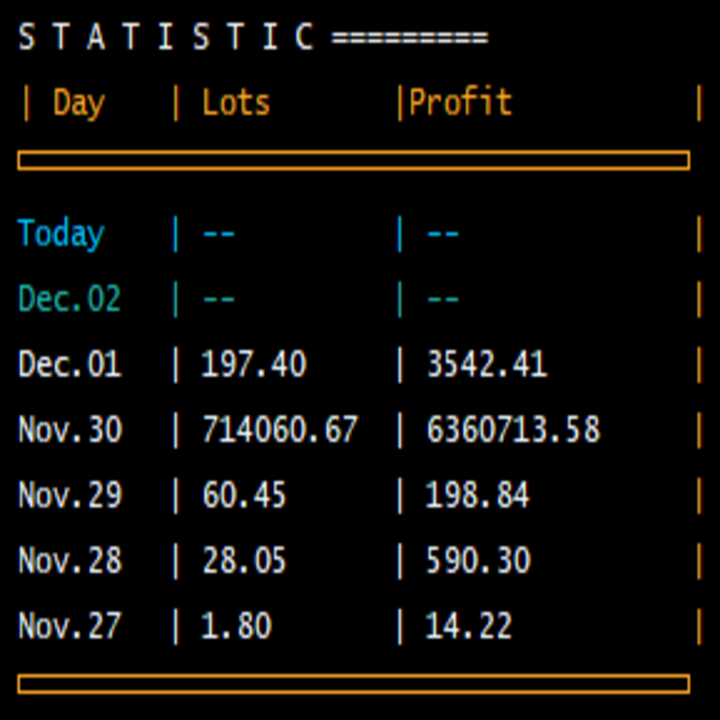
3. Statistics by Day
- Statistics by Say and Volume
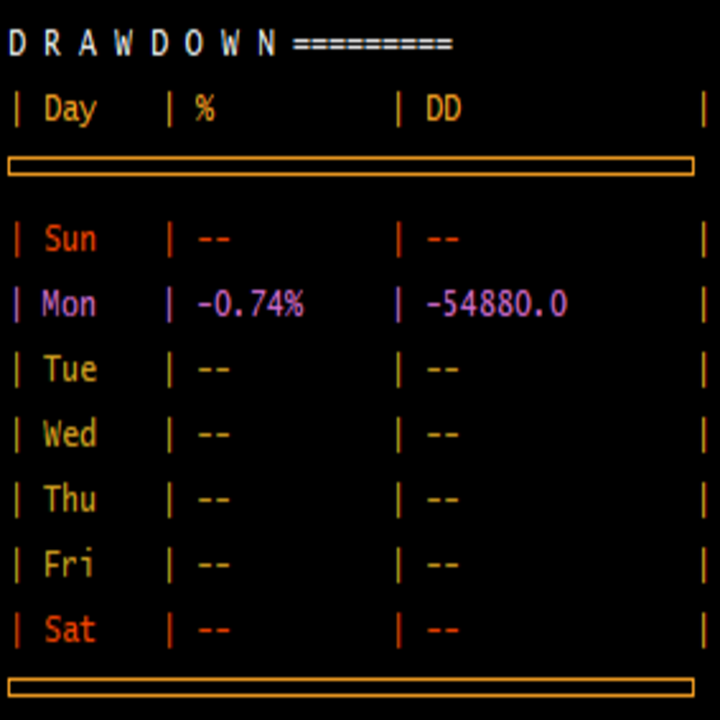
4. DrawDown by Day
- Each day DrawDown in Week
- Percent of DrawDown
Contact me at Telegram @MaiMew68