Scalper Pivot Grid
- 指标
- Yosi Malatta Madsu
- 版本: 1.1
- 更新: 22 十二月 2023
- 激活: 5
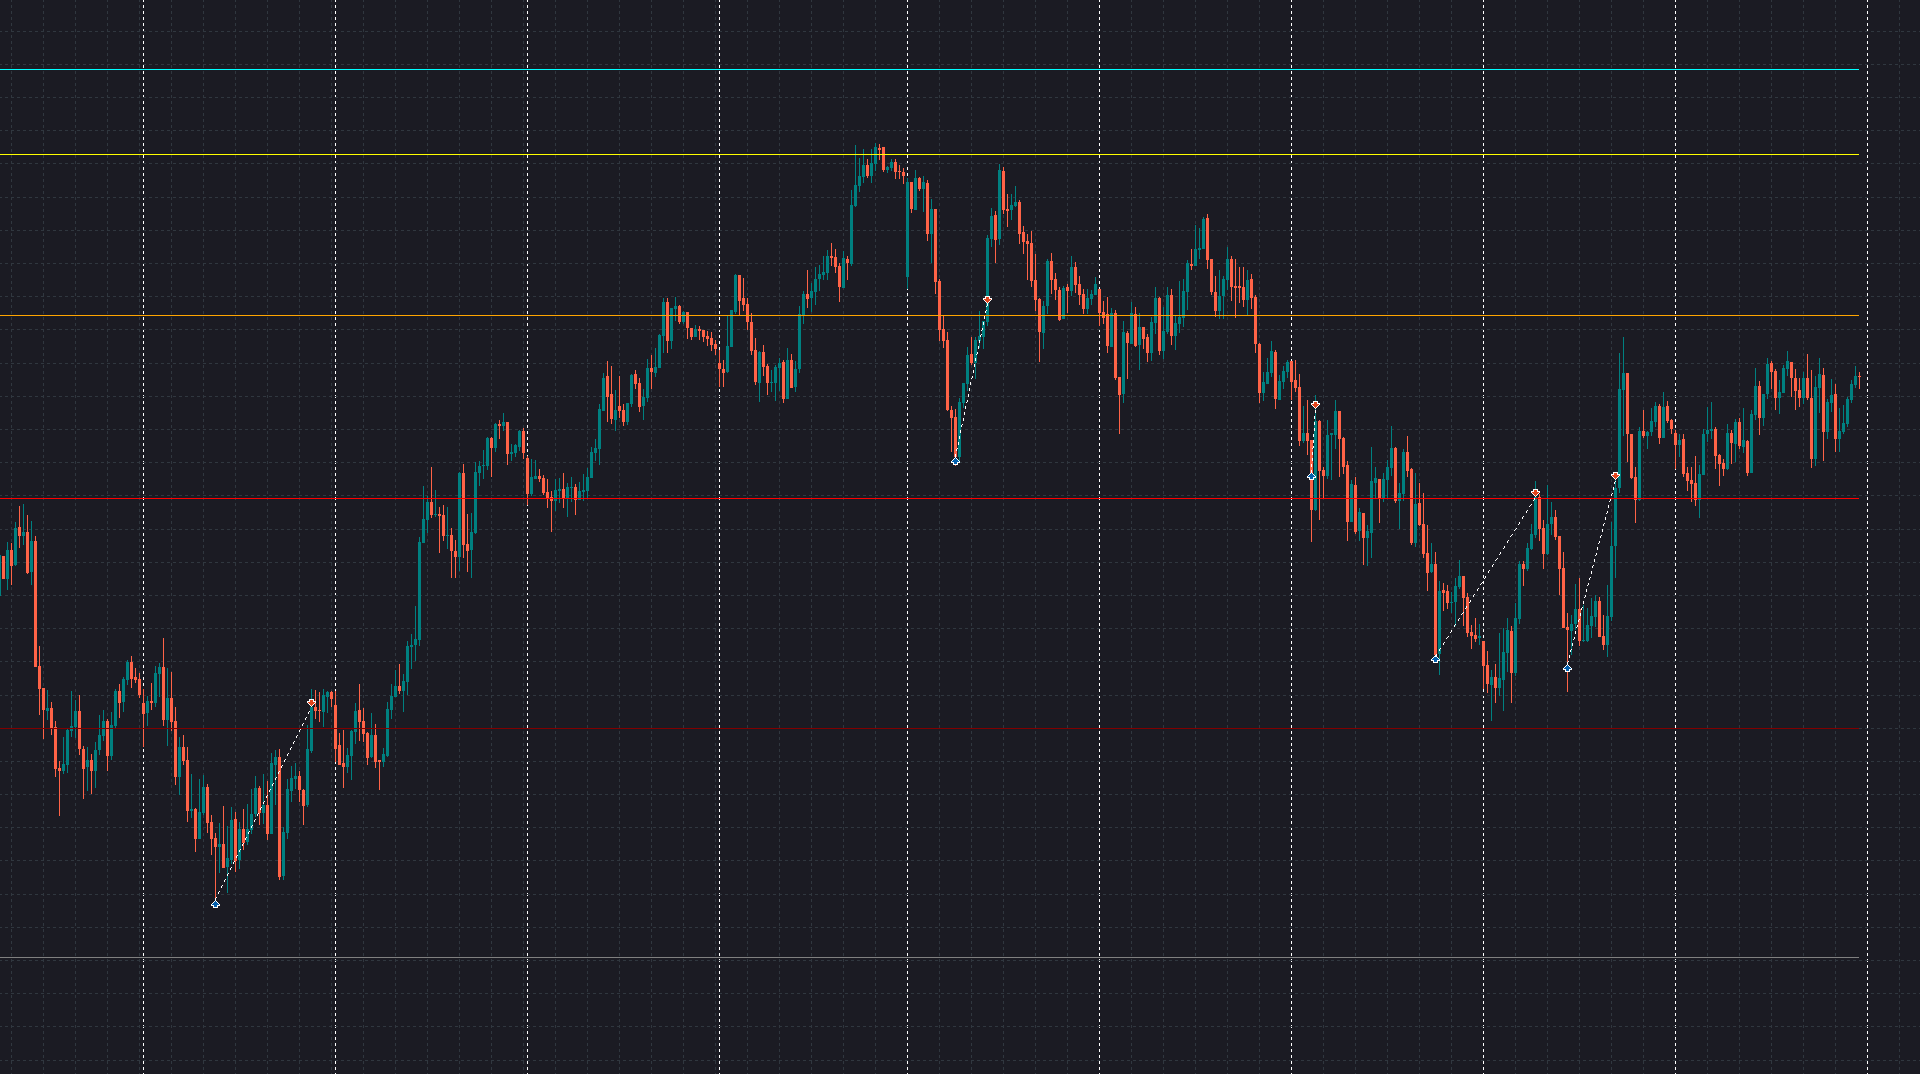
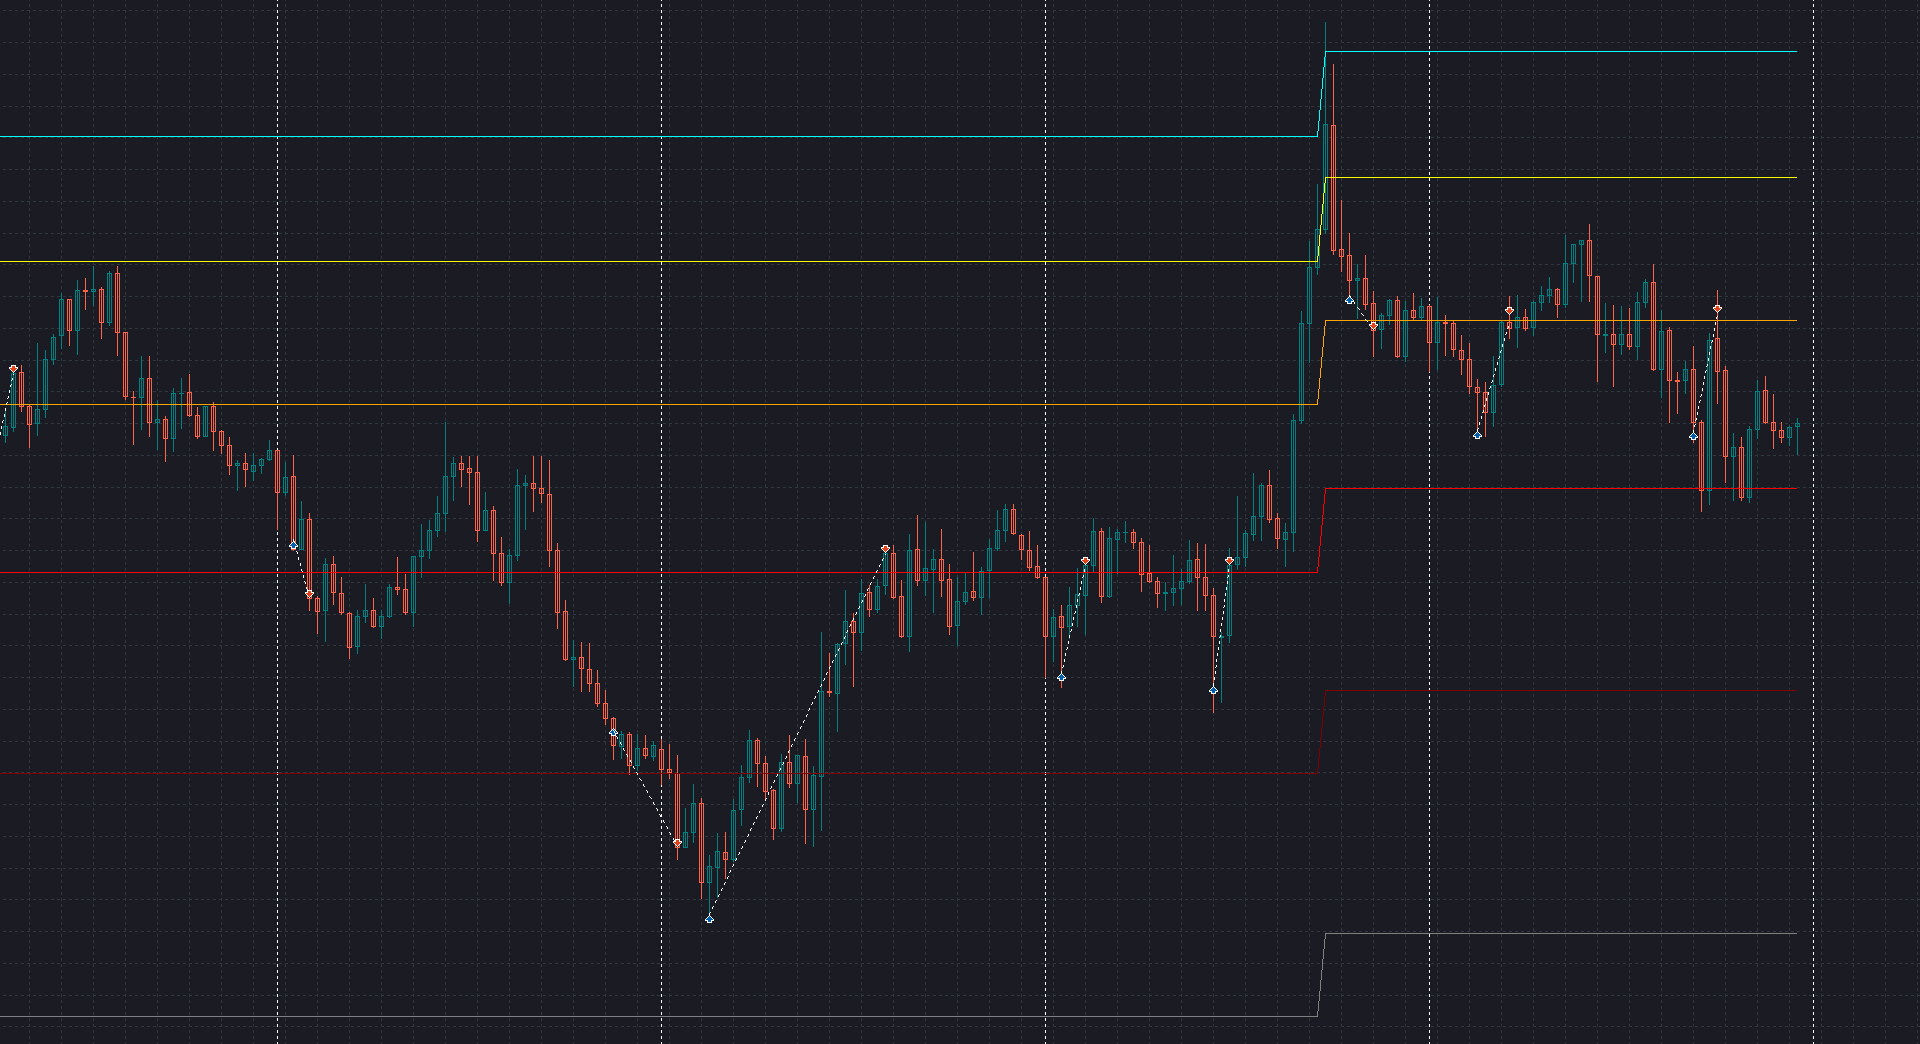
Scalper Pivot Grid indicator reveals five distinct scalping zones strategically positioned to capture numerous reversal entry opportunities centered within each area. Initially designed for timeframes ranging from M15 to H1, this indicator allows manual adjustment of the area height. This feature enables users to customize the distance between lines, promoting enhanced equity resilience.
Originally made for M1 timeframe.
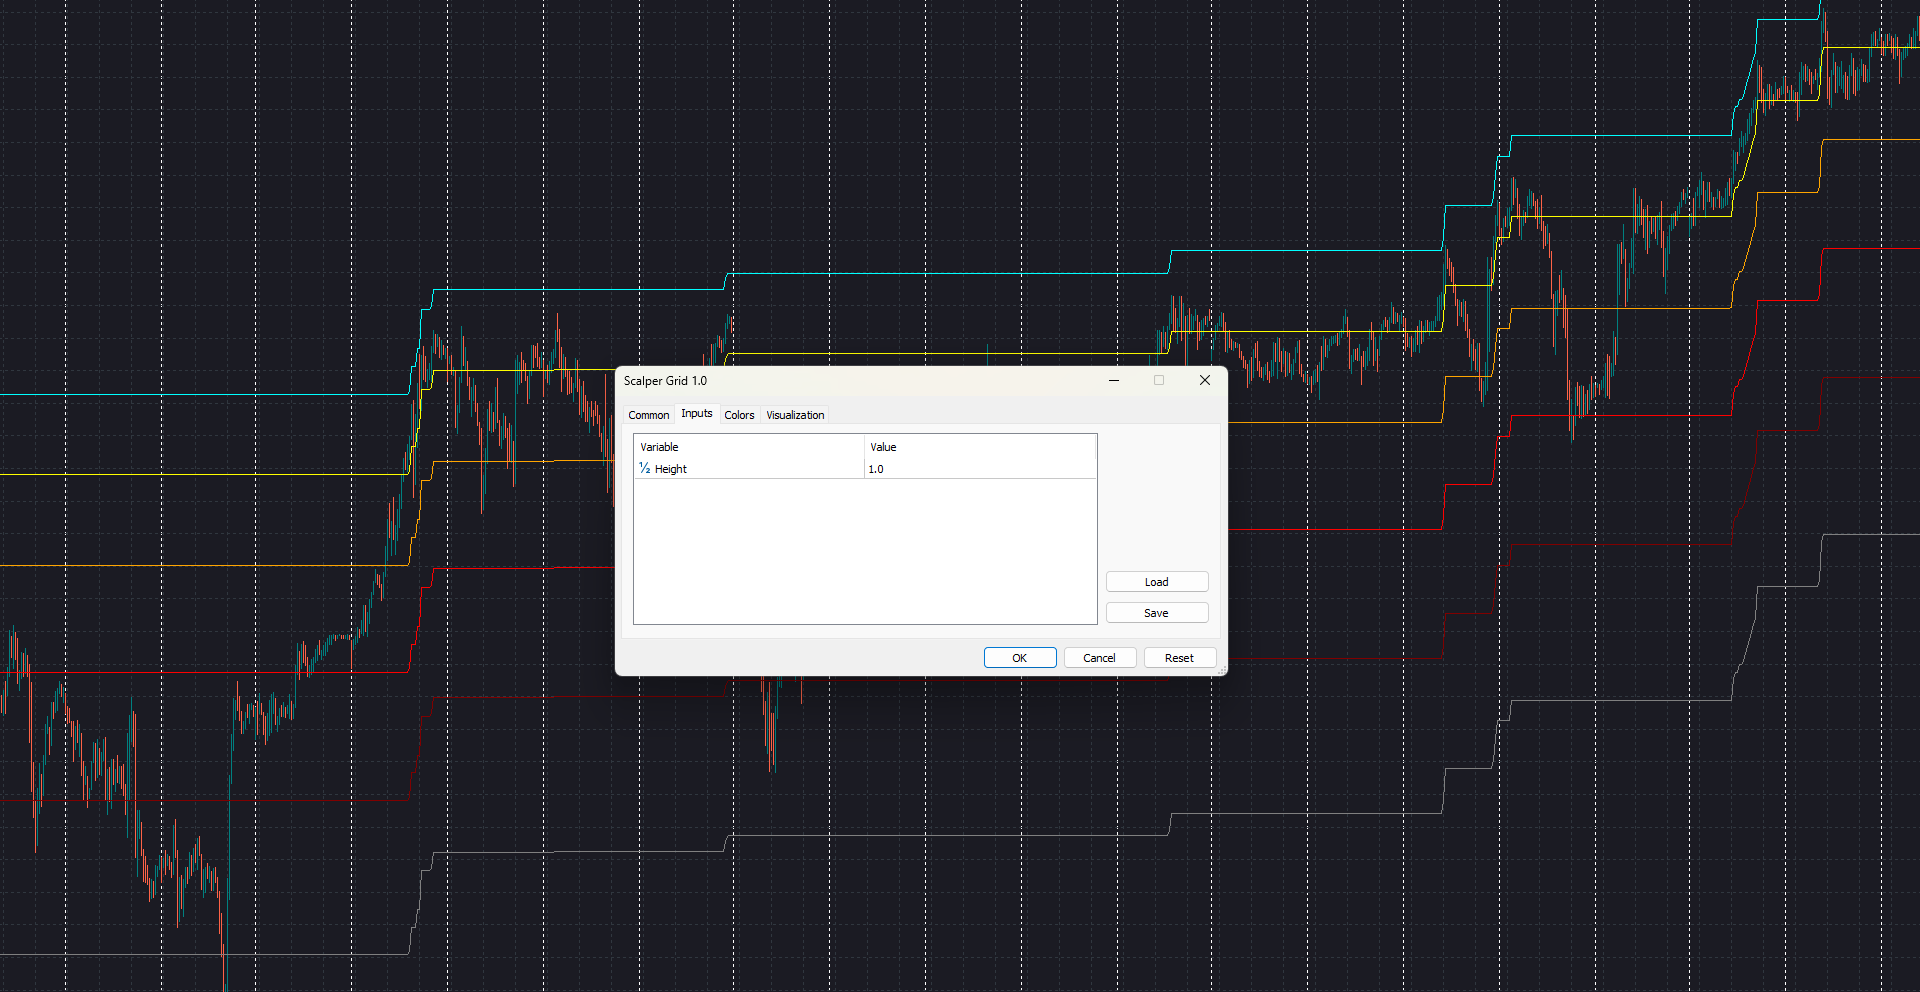
Setup/Inputs:
Recommended Height value is 1. Increasing/decreasing the Height will also change the chance of switching trend on indicator.