• 概述
  • 评论
  • 评论

Candle Formula

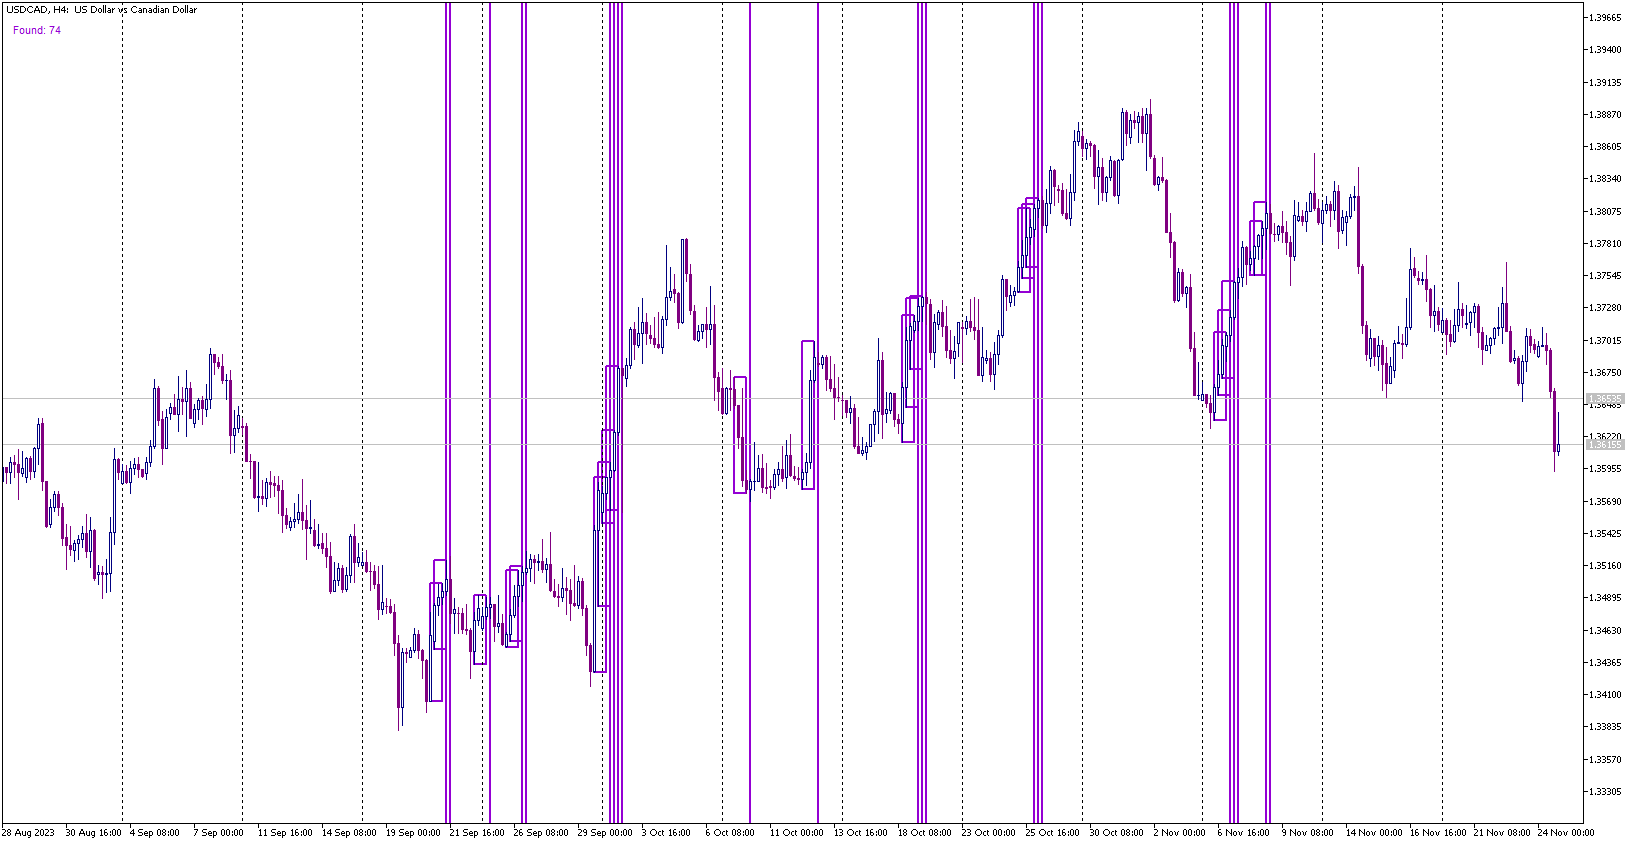
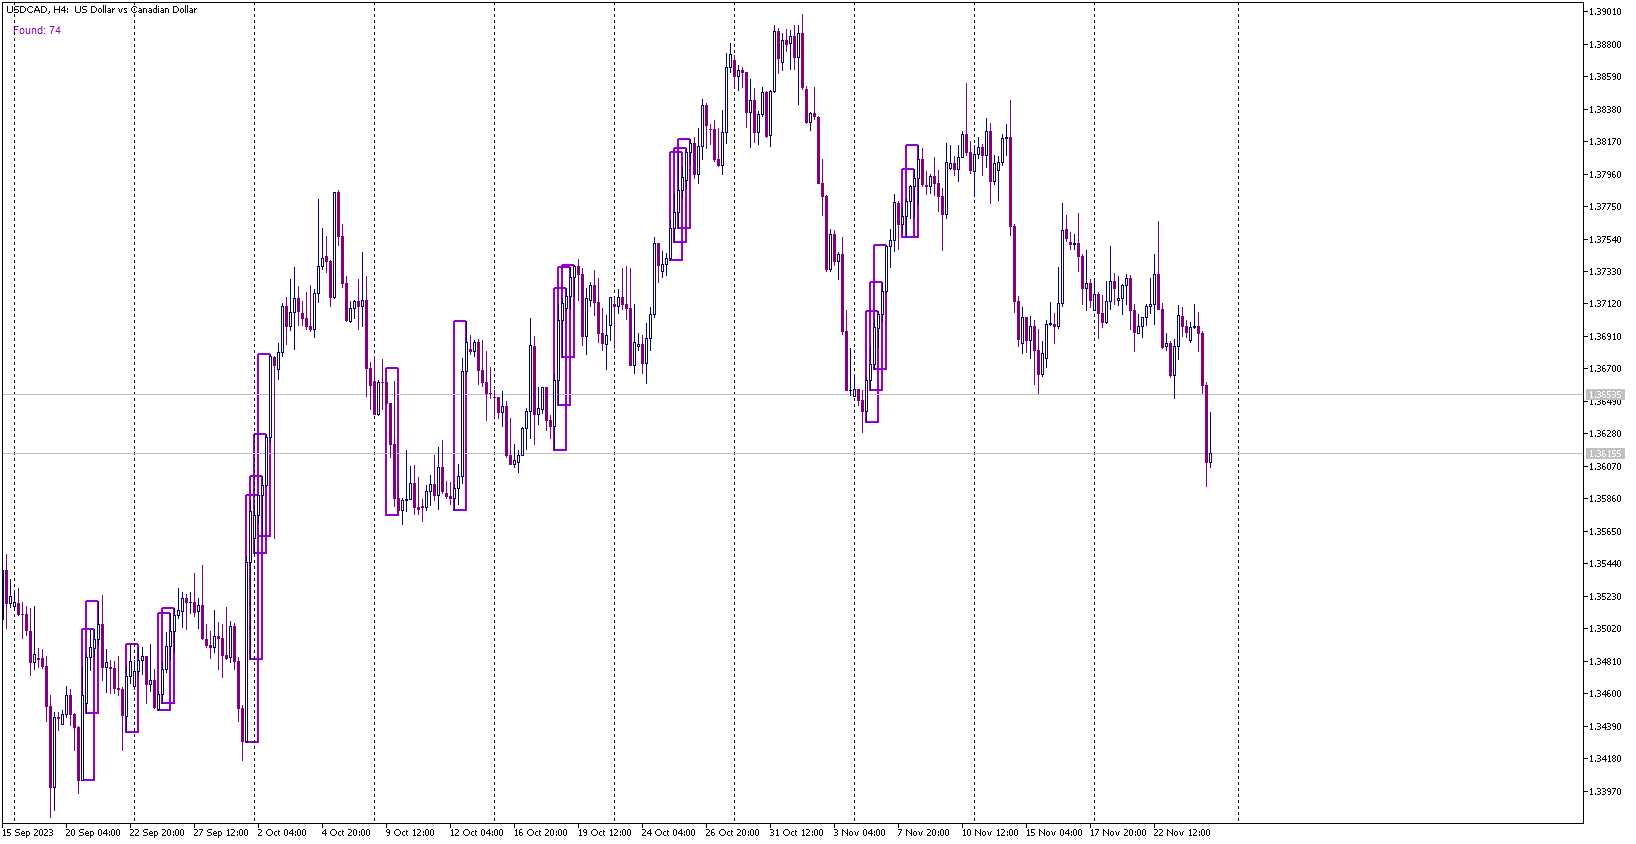
Indicator for research and finding candle bars patterns real time.
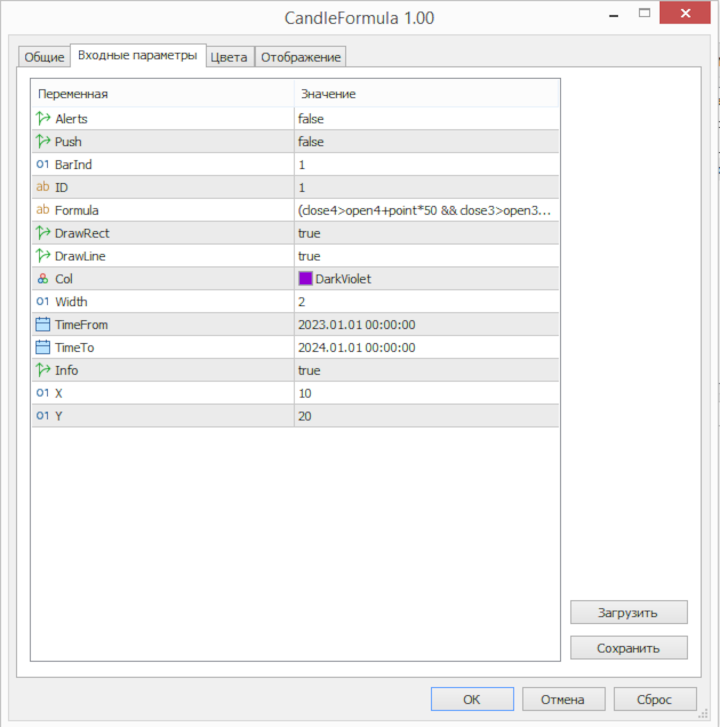
Options:

Alerts - Enabling alerts
Push - Enable push notifications
BarInd - On which bar to look for patterns for notifications (1 - formed, 0 - forming)
ID - Identifier. Appended to the names of graphic objects and to the message
Formula - Formula. In the bar price formula: open1, high1, low1, close1, etc. (open0, high25... any number, 0 is also possible - low0, open0...). Counting bars from right to left from zero.
You can use the min() and max() functions in formulas (two parameters separated by commas).
You can use point - this is the value of the point. You can also use numerical constants: 1, 2... 0.5, etc.

You can use logical operators: && is "and", || - this is "or". Therefore, there is no need for several variables for conditions; everything can be written in one.

Just use parentheses () more actively so as not to get confused in priorities.

 
    In general, the formula can include arithmetic operations: +-/*
    Boolean: && ||
    Comparisons: >, <, >=, <=, ==

    Functions:
                abs
                arccos
                arcsin
                arctan
                sin
                cos
                tan
                exp
                log
                mod
                max
                min
                pow
                ceil
                sqrt
                log10
                floor
                round
   
DrawRect - Draw a rectangle
DrawLine - Draw a line
Col - Rectangle color
Width - The thickness of the rectangle frame. If the pattern consists of one bar, the frame turns into a vertical line, and its thickness is set to at least 3.
        
TimeFrom - Time "from"
TimeTo - Time "to" (if less than TimeFrom, then not checked)
Info - Show quantity on chart
X - X coordinate of quantity label
Y - Y coordinate of the inscription with quantity (since there can be more than one indicator on the chart, you need to specify them in different places to display the inscription)
推荐产品
CandleStick Pattern Indicator MT5
Driller Capital Management UG
5 (1)
This is a simple Candle Stick Pattern Indicator, which shows in the current time period all standardisized Patterns in the chart. All Patterns will be calculatet automatically based on standard conditions. Following Candle Stick Patterns are included: Bullish Hammer | Bearish Hammer Bullish Inverted Hammer | Bearish Inverted Hammer Bullish Engulfing | Bearish Engulfing Piercing | Dark Cloud Cover Bullish 3 Inside | Bearish 3 Inside There are only a few settings at the begining to take. Every Pat
FREE
Candlestick Patterns MT5  is a simple and convenient indicator able to define 29 candle patterns. Advantages Defines and highlights 29 candle patterns; Estimated trading direction is shown as an arrow; Each candlestick pattern can be disabled in the settings; The indicator can be used as an arrow indicator in EAs. Parameters TextSize  - chart text size; TextColor  - chart text color; Alert  - enable/disable alerts; ---------- Candlestick Patterns -------------  - settings separator; AdvanceB
Three Inside Up GA
Osama Echchakery
The   Three Inside Up   candlestick pattern is formed by three candles. Here’s how to identify the Three Inside Up candlestick pattern: The first candle must be bearish The second candle must be bullish The close of the second candle should ideally be above the 50% level of the body of the first one The third candle should close above the first one This 3-candle bullish candlestick pattern is a reversal pattern, meaning that it’s used to find bottoms. For this reason, we want to see this patter
PZ Sandwich Bars MT5
PZ TRADING SLU
5 (2)
This indicator detects Sandwich Bars of several ranges, an extremely reliable breakout pattern. A sandwich setup consists on a single bar that engulfs several past bars, breaking and rejecting the complete price range. [ Installation Guide | Update Guide | Troubleshooting | FAQ | All Products ] Easy and effective usage Customizable bar ranges Customizable color selections The indicator implements visual/mail/push/sound alerts The indicator does not repaint or backpaint The indicator could not b
FREE
Basing Candles
Abdelkhabir Yassine Alaoui
Basing Candles indicator is an automatic indicator that detects and marks basing candles on the chart. A basing candle is a candle with body length less than 50% of its high-low range. A basing candle or basing candlestick is a trading indicator whose body length is less than half of its range between the highs and lows. That's less than 50% of its range. The indicator highlights the basing candles using custom candles directly in the main chart of the platform. The percentage criterion can be
FREE
Candlestick Pattern Teller
Flavio Javier Jarabeck
5 (1)
Minions Labs' Candlestick Pattern Teller It shows on your chart the names of the famous Candlesticks Patterns formations as soon as they are created and confirmed. No repainting. That way beginners and also professional traders who have difficulties in visually identifying candlestick patterns will have their analysis in a much easier format. Did you know that in general there are 3 types of individuals: Visual, Auditory, and Kinesthetic? Don't be ashamed if you cannot easily recognize Candlest
Price Action Full
Bogdan Kupinsky
This indicator looks for 3 rather strong patterns: Spinning Top pattern Hammer or Hanging Man Inverted Hammer or Shooting Star These patterns may indicate a trend continuation or its reversal, depending on the location of the patterns. Input parameters Zero - consider candles without a body Multiplier for hammerhigh - multiplier for the larger shadow of the Hammer Multiplier for hammerlow - multiplier for the smaller shadow of the Hammer Multiplier for wolf - multiplier for the shadows of the
Candle Pattern Scanner
Bruno Goncalves Mascarenhas
Candlestick patterns The candlestick Pattern Indicator and Scanner is designed to be a complete aid tool for discretionary traders to find and analyze charts from powerful candle patterns. Recognized Patterns: Hammer Shooting star Bearish Engulfing Bullish Engulfing Doji Marubozu Scanner Imagine if you could look at all the market assets in all timeframes looking for candlestick signals.
LevelPAttern MT5 is a technical indicator based on the daily levels and Price Action patterns. The indicator is based on the standard ZigZag indicator + reversal candlestick pattens, such as Star, Hammer (also knows as Pin bar), Engulfing and others. The indicator generates audio and text notifications when a pattern is formed and a level is touched. It also supports sending email and push notifications. Indicator operation features It is suitable for working with any CFD and FOREX trading ins
Introduction to Harmonic Volatility Indicator Harmonic Volatility Indicator is the first technical analysis applying the Fibonacci analysis to the financial volatility. Harmonic volatility indicator is another level of price action trading tool, which combines robust Fibonacci ratios (0.618, 0.382, etc.) with volatility. Originally, Harmonic Volatility Indicator was developed to overcome the limitation and the weakness of Gann’s Angle, also known as Gann’s Fan. We have demonstrated that Harmonic
The Candlestick Patterns indicator for MT5 includes 12 types of candlestick signales in only one indicator. - DoubleTopsAndBottoms - SmallerGettingBars - BiggerGettingBars - ThreeBarsPlay - TwoBarsStrike - Hammers - InsideBars - OutsideBars - LongCandles - TwoGreenTwoRed Candles - ThreeGreenThreeRed Candles The indicator creats a arrow above or under the signal candle and a little character inside the candle to display the type of the signal. For long candles the indicator can display the exac
ACPD – «Auto Candlestick Patterns Detected» - The indicator for automatic detection of candlestick patterns. The Indicator of Candlestick Patterns ACPD is Capable of: Determining 40 reversal candlestick patterns . Each signal is displayed with an arrow, direction of the arrow indicates the forecast direction of movement of the chart. Each caption of a pattern indicates: its name , the strength of the "S" signal (calculated in percentage terms using an empirical formula) that shows how close is t
Engulfing Candle Indicator
Chioma Obunadike
5 (1)
This Engulfing Candle Indicator as the name implies can detect engulfing candlestick patterns on the chart. The indicator alerts the user of the presence of an engulfing candle (Bearish engulfing candle and Bullish engulfing candle) by using visual representation of arrows on the chart.  - Blue arrow for Bullish engulfing - Red arrow for Bearish engulfing Extra modifications can be added based on request.
FREE
The   Three White Soldiers candlestick pattern   is formed by three candles. Here’s how to identify the Three White Soldiers candlestick pattern: Three consecutive bullish candles The bodies should be big The wicks should be small or non-existent This 3-candle bullish candlestick pattern is a reversal pattern, meaning that it’s used to find bottoms. For this reason, we want to see this pattern after a move to the downside, showing that bulls are starting to take control. When a Three White Sold
Candle hunter
Ruslan Khasanov
5 (1)
圖形分析指標。 在圖表上標記主要的日本燭台形態。 目前,交易者可以使用以下一組模式:  - Bearish/Bullish Abandoned Baby;  - Bearish Advance Block;  - Bearish Deliberation;  - Bearish/Bullish Belt Hold;  - Bearish/Bullish Engulfing;  - Bearish Shooting Star;  - Bearish Evening Star;  - Bearish Evening Doji Star;  - Bearish/Bullish Doji Star;    - Bearish/Bullish Tri-Star;  - Bearish Hanging Man;  - Bearish/Bullish Harami;  - Bearish/Bullish Harami Cross;  - Bearish Two Crows;  - Bearish Identical Three Crows;  - Bearish Three Black Crows
Japan CandleStick Patterns
Nguyen Duc Quy
4.33 (6)
Japanese candlestick analysis has been in existence for hundreds of years and is a valid form of technical analysis. Candlestick charting has its roots in the militaristic culture that was prevalent in Japan in the 1700s. One sees many terms throughout the Japanese literature on this topic that reference military analogies, such as the Three White Soldiers pattern Unlike more conventional charting methods, candlestick charting gives a deeper look into the mind-set of investors, helping to establ
FREE
Amiguinhos Inside Outside Color Bar
Eduardo Correia Da Silva
5 (2)
A simple price action indicator to highlight inside and outside bars (candles) with colors. It is possible to choose what type of bar can be highlighted among: inside, ouside or both. It is can be possible to choose a first specific color for the shadow and the border of bars (candles), a second specific color for high/bull bar (candle) and a third specific color for down/bear bar (candle)
FREE
Candlestick Pattern Detector
Adhemar Braganca Correa Travassos
This indicator can identify more than 60 candlestick patterns on the chart, including their bullish and bearish variants. Just choose the pattern you want in the settings. Available Patterns 2 Crows Gravestone Doji On Neck 3 Black Crows Hammer Piercing 3 Inside Hanging Man Rick Shawman 3 Line Strike Harami Rising and Falling Three Method 3 Outside Harami Cross Separating Lines 3 Stars in South High Wave Shooting Star 3 White Soldiers Hikkake Short Line Abandoned Baby Hikkake Modified Spinning
A machine translation from the English product description was used. We apologize for possible imprecisions. 使用了英文 产 品描述的机器翻 译。 我 们对可能的不准确表示歉意 。 最喜 欢的烛台价格行为模式的可视化系统 。 附加后,指 标将自动在图表上标记下一个模式 : 匹 诺曹酒吧  - 带有长 “ 鼻子 ” 的小型条形杆,非常著名的反向模式; 内柱  -  一个柱,其范 围位于前一个柱的范围内。   它代表市 场的不确定性 ; 外柱  -  其范 围超出前一个柱的范围的柱。   它代表市 场的不确定性 ; 导轨图案  - 两个随之而来的 对立柱,具有几乎相等的、较大的实体。 反向模式, 实际上与更高时间框架的匹诺曹柱线模式相吻合 ; 主蜡 烛形态  -  蜡 烛的第五根,其中四个后续蜡烛的范围 在第五根蜡 烛的范围内   -   主蜡 烛。   这种模式代表市场整合,尤其是在较短的时间范围内 。 差距  -  后 续柱的收盘价和开盘价之间的差距,不应忽视 。 该指标的开发考
The indicator identifies two most important patterns of technical analysis - Pin Bar and Engulfing. MT4-version:    https://www.mql5.com/en/market/product/53591 Settings: Mincandle size for PinBar   - The minimum size of the Pin-Bar candlestick; Percentage of candle body on size   - The percentage of the candle body in relation to its length; PinBar Alert   - Alert when a Pin-Bar is detected; PinBar Mail   - Sends an email when a Pin Bar is found; PinBar Notification   - Sends a push notificati
MP Pin Bar for MT5
Pierre Ksachikian
A pin bar pattern consists of one price bar, typically a candlestick price bar, which represents a sharp reversal and rejection of price. The pin bar reversal as it is sometimes called, is defined by a long tail, the tail is also referred to as a “shadow” or “wick”. The area between the open and close of the pin bar is called its “real body”, and pin bars generally have small real bodies in comparison to their long tails. The tail of the pin bar shows the area of price that was rejected, and
FREE
该指标可识别30多种日本烛台图案,并在图表上突出显示它们。这只是价格行为交易者不能没有的那些指标之一。 一夜之间增强您的技术分析 轻松检测日本烛台图案 交易可靠且通用的反转模式 使用延续模式安全跳入已建立的趋势 指示器不重涂并实施警报 该指标实现了一个多时间框架 仪表板 它检测到的模式太多,以至于图表看起来非常混乱,难以阅读。交易者可能需要禁用指标输入中的不良图案,以使图表更具可读性。 它检测1条,2条,3条和多条样式 它检测逆转,持续和弱点模式 模式可以启用或禁用 看涨模式用 蓝色 标记,空头模式用 红色 标记,中性模式用 灰色 标记。 检测到的烛台模式列表 从1到5小节的突破距离(又名线罢工) 法基(又名Hikkake) 反间隙 三名士兵/三只乌鸦 锤子/流星/吊人 吞没 外上/外下 Harami 由上至下 晨星/晚星 踢球者 刺穿/乌云 皮带托 从1到5小条上升三分/下降三分 田木峡 并排间隙 视窗 前进块/下降块 审议 Marubozu 挤压警报(又称主蜡烛) Dojis 设置 PaintBars 使用条形的颜色打开/关闭图案的突出显示。 DisplayLabel
The Bheurekso Pattern Indicator for MT5 helps traders automatically identify candlestick pattern that formed on the chart base on some japanese candle pattern and other indicator to improve accurate. This indicator scans all candles, recognizes and then displays any candle patterns formed on the chart. The candle displayed can be Bullish or Bearish Engulfing, Bullish or Bearish Harami, and so on. There are some free version now but almost that is repaint and lack off alert function. With this ve
The   Bullish Engulfing candlestick pattern   is formed by two candles. Here’s how to identify the Bullish Engulfing candlestick pattern: The first candle must be bearish The second candle must be bullish The body of the second candle must cover the body of the first candle This 2-candle bullish candlestick pattern is a reversal pattern, meaning that it’s used to find bottoms. For this reason, we want to see this pattern after a move to the downside, showing that bulls are starting to take cont
Identify Pinbar Candle Pattern with Arrows & Alert (built-in RSI filter). This indicator helps you to identify Pin bar Candlestick Pattern (or shooting star & hammer pattern) on the chart with arrows, along with an alert when a new Pin bar appears. Pin bar pattern is one of the most important reversal Price Action signals. You can set Minimum Percent of Wick (or Tail) Length over full bar length (Recommended: 60%, 70%, 75%). Alerts can be turned on and off: Popup Email Push Notification S
MP Candle Size MT5
Pierre Ksachikian
5 (2)
Candle size oscillator is an easy to use tool to figure out candle size from highest to lowest price of each candle. It's a powerful tool for price action analysts specifically for those who works intraday charts and also a perfect tool for short term swing traders. Kindly note that you can also edit the Bullish and Bearish candles with different colors. #Tags: Candle size, oscillator, price action, price range, high to low, candle ticks _________________________________________________________
FREE
HoD LoD Time Price Studies
Aurthur Musendame
4.33 (3)
High of the Day and Low of the day Time and Price Fractal Studies is an indicator that will help you identify certain patterns that tend to repeat themseleves at certail times of the day or at certain prices.  It is used to study Daily Highs ad Lows in relation to time and price.  You will get to answer certail questions like: At what time of day does this market usually turn around. At what price does the market turn. Is it at round numbers etc
FREE
King Binary Profit System 1 minute candle 3-4 minute expire Alright. This indicator works on MT5 and is very easy to use. When you receive a signal from it, you wait for that candle with the signal to close and you enter your trade at the beginning of the next new candle. A red arrow means sell and a green arrow means buy. All arrows comes with a long dotted like for easy identification of trade signal. Are you okay with that?
Soldiers Crows
Alexey Topounov
5 (1)
The indicator displays the "Three white soldiers and Three black crows" candlestick model on a chart. Three white soldiers are color in blue. Three black crows are colored in red. Input parameters: Max Bars - maximum number of bars calculated on the chart. Make Signal Alert - use alert. Type of pattern rules - use a strict model of determining the pattern (short lower shadows for the three soldiers, short upper shadows for the three crows), or a simplified model. Max Shadow Ratio - coefficient o
50+ Candlestick Patterns, Simulated Trading Results, Top Five Performers Candle Analysis extends Candlesticks Pattern Analysis by not only identifying Patterns but also recording the Past Performance of the Patterns. What it Does:- Identifies and plots results on chart Displays Top Patterns for both Bullish and Bearish type.  Log can be printed in experts tab to see Simulated Trading results Displays All or Selected Patterns Alerts on Pattern formation More detailed information in   Blog
该产品的买家也购买
首先,值得强调的是,这个交易系统是一个非重绘、非重画和非滞后的指标,这使得它非常适合手动和机器人交易。 “智能趋势交易系统 MT5”是专为新手和经验丰富的交易者量身定制的综合交易解决方案。它结合了超过 10 个优质指标,具有 7 多个强大的交易策略,使其成为适用于各种市场条件的多功能选择。 趋势跟随策略:提供精确的入场和止损管理,以有效地跟随趋势。 反转策略:识别潜在的趋势反转,使交易者能够利用区域市场的机会。 剃头策略:专为快速准确的日内交易和短期交易而设计。 稳定性:所有指标都不会重绘、不会重画和不会滞后,确保可靠的信号。 定制:支持自定义策略,以满足个人交易偏好。超过 7 种策略和组合可帮助您找到最佳策略。 信号清晰度:提供箭头信号,以指示清晰的入场和退出点。 实时警报:通过交易进出警报使交易者保持了解。 深入分析:提供更高时间框架的趋势分析和实时交易监控。 自适应颜色编码:利用蜡烛颜色编码来显示成交量、趋势和反转蜡烛信号。通过蜡烛颜色分析市场方向。 “智能趋势交易系统 MT5”赋予交易者必要的工具,以便在各种市场条件下做出明智和战略性的交易决策。无论当前市场状态如何,都能够充满
Atomic Analyst MT5
Issam Kassas
5 (11)
首先值得强调的是,该交易指标是非重绘、非延迟的指标,这使其成为手动和机器人交易的理想选择。 Atomic Analyst是一种PA价格行动指标,利用价格的力量和动量来寻找市场上更好的机会。配备了高级过滤器,可帮助去除噪音和假信号,并提高交易潜力。使用多层复杂的指标,Atomic Analyst扫描图表,并将复杂的数学计算转化为任何初学者都能理解并用来做出一致交易决策的简单信号和颜色。 “Atomic Analyst”是专为新手和经验丰富的交易者量身定制的综合交易解决方案。它将高级指标和一流功能融合为一体的交易策略,使其成为所有类型交易者的多功能选择。 日内交易和剥头皮策略:专为快速准确的日内交易和短期交易而设计。 日内和摆动交易策略:可用作追求价格大幅波动的日内和摆动交易者的可靠工具。 多货币和市场:凭借其可靠的精度,在不同的工具和市场上运作。 多个时间框架:可在多个时间框架上使用,性能良好。 稳定性:所有指标均不重绘、不重绘和不滞后,确保可靠的信号。 信号清晰度:提供箭头信号,用于清晰的入场和出场点。 实时警报:通过交易入场、SL和TP警报通知交易者。 多个利润水平:使用
Quantum Trend Sniper
Bogdan Ion Puscasu
5 (37)
介绍   量子趋势狙击指标 ,突破性的 MQL5 指标,正在改变您识别和交易趋势反转的方式!由拥有超过13年交易经验的资深交易员团队开发,     量子趋势狙击指标   旨在通过其创新的方式以极高的准确度识别趋势反转,将您的交易之旅推向新的高度。 ***购买量子趋势狙击指标,即可免费获得量子突破指标!*** 当量子突破指标识别出趋势反转时,它会向您发出警报和信号箭头,并建议您三个止盈水平。 它既适合新手交易者,也适合专业交易者。 量子 EA 通道:       点击这里 MT4版本:       点击这里 建议: 时间范围: 所有时间范围。为了获得最佳结果,我们建议在 M15、M30 和 H1 时间范围内使用它。 货币对:欧元兑美元、英镑兑美元、澳元兑美元、欧元兑英镑、, EURAUD,  XAUUSD 账户类型:ECN、Raw 或 Razor,点差极低 经纪时间:任意 经纪商:IC Markets、Pepperstone with Raw 和 Razor 的点差最低 建议止损:50 点 建议止盈水平:20 点、50 点和
FX Volume MT5
Daniel Stein
4.94 (17)
通过 mql5 和 Telegram 上 的 " 晨间简报 "获取每日市场更新,包括详细信息和屏幕截图 ! 外汇交易量(FX Volume)是第一个也是唯一一个从经纪商角度真正洞察市场情绪的交易量指标。 直接在您的图表上看到这些信息是真正改变游戏规则和突破性的交易解决方案。 受益于独特的市场数据洞察,如 比率(Ratios )显示货币多头和空头头寸的比率(百分比 比率变化 显示所选时间段内的多头比率及其百分比变化 总交易量 显示货币的总交易量(多头和空头),以手为单位 多头 交易量显示货币所有多头头寸的交易量 空头 交易量显示所有货币空头头寸的交易量 净多头 显示净多头交易量,即所有多头头寸减去所有空头头寸(以手为单位)。 净多头百分比 显示货币净多头交易量的变化 请阅读我们的基本教程 -> "如何使用外汇交易量进行交易 " 获取更多信息,如常见问题、交易技巧和教程视频,请访问我们的 外汇交易量公共信息频道 请 安装并运行 SI Connect 以建立与我们数据中心的持续连接 背景信息 我们都知道,外汇是一个分散的市场。这就是为什么我们必须打破常规思维,开发一个独
Entry Points Pro for MT5
Yury Orlov
4.54 (157)
这款指标用于 MT5,可提供准确的入场交易信号,且无重绘。 它可应用在任何金融资产:外汇、加密货币、贵金属、股票、指数。 它将提供极其精准的评估,并告诉您何时开仓和平仓的最佳时机。 观看 视频 (6:22),其中包含一个仅处理单一信号的示例,该信号即可值回指标购价! 大多数交易者在 Entry Points Pro 指标的帮助下,在第一个交易周内即改善了他们的交易结果。 订阅我们的 Telegram 群 ! Entry Points Pro 指标的益处。 入场信号无重绘 如果信号出现,并得到确认,则它不会再消失;不像是重绘指标,它会导致重大的财产损失,因为它们可以在显示信号后再将其删除。 无差错开仓 指标算法可令您找到入场交易(买入或卖出资产)的理想时机,从而提高每位交易者的成功率。 Entry Points Pro 可操作任何资产 它允许您在 MT5 平台上交易任何经纪商的加密货币、股票、贵金属、指数、大宗商品和货币。 提供任何方向的信号 Entry Points Pro 指标提供针对任意价格走势的入场交易信号 - 上涨、下跌或横盘(横向)。
FX Power MT5 NG
Daniel Stein
5 (4)
通过 mql5 和 Telegram 上 的晨间简报获取每日市场更新,包括详细信息和屏幕截图 ! FX Power MT5 NG 是我们长期以来非常受欢迎的货币强度计算器 FX Power 的下一代产品。 这款下一代强度计算器能提供什么?您所喜爱的原版 FX Power 的所有功能 附加功能 黄金/XAU 强度分析 更精确的计算结果 可单独配置的分析周期 可自定义计算限制,以获得更好的性能 为希望查看更多信息的用户提供特殊的多实例设置 无尽的图形设置,可在每个图表中设置您最喜欢的颜色 无数的通知选项,让您再也不会错过任何重要信息 采用 Windows 11 和 macOS 风格的全新圆角设计 神奇的移动指标面板 FX Power 主要功能 所有主要货币的完整强势历史 所有时间框架内的货币强弱历史 所有经纪商和图表的计算结果完全相同 100% 可靠的实时计算 -> 无重绘 可通过下拉列表选择分析时段 通过自定义模式单独配置分析时段 可在一个图表中使用多个实例 可移动 FX Power 显示屏(通过拖放) 适用于高分辨率 QHD、UHD 和 4K 显示器 自动终端配置 针对平板电脑
首先,值得强调的是,这个交易工具是非重绘、非重画和非滞后的指标,非常适合专业交易。 智能价格行动概念指标是一个非常强大的工具,既适用于新手,也适用于经验丰富的交易者。它将超过20个有用的指标合并到一个指标中,结合了高级交易思想,如内圈交易员分析和智能资金概念交易策略。该指标侧重于智能资金概念,提供有关大型机构交易方式的见解,帮助预测它们的动向。 它在流动性分析方面尤其擅长,有助于理解机构的交易方式。它擅长预测市场趋势,并仔细分析价格波动。通过将您的交易与机构策略对齐,您可以更准确地预测市场走向。该指标多才多艺,擅长分析市场结构,识别重要的订单区块,并识别各种模式。 它擅长识别BOS和CHoCH等模式,理解动量的转变,并突出显示供需强劲的关键区域。它还擅长发现强大的不平衡,并分析价格创造更高高点或更低低点的模式。如果您使用斐波那契回撤工具,该指标可以满足您的需求。它还可以识别相等的高点和低点,分析不同的时间框架,并通过仪表板显示数据。 对于使用更高级策略的交易者,该指标提供了工具,如公平价值差指标和优惠和折扣区域的识别。它特别关注高时间框架订单区块,并在较长时间框架内彻
RelicusRoad Pro MT5
Relicus LLC
4.82 (22)
现在$ 147(更新后增加到$ 499) - 无限帐户(PC或Mac) RelicusRoad 用户手册 + 培训视频 + 访问 Private Discord Group + VIP 身份 一种看待市场的新方式 RelicusRoad 是世界上最强大的外汇、期货、加密货币、股票和指数交易指标,为交易者提供保持盈利所需的所有信息和工具。我们提供技术分析和交易计划,帮助每一位交易者取得成功,从初学者到高级。它是一个关键的交易指标,可以提供足够的信息来预测未来的市场。我们相信一个完整的解决方案,而不是图表上几个没有意义的不同指标。这是一个多合一指标,显示无与伦比且非常准确的信号、箭头 + 价格行为信息。 RelicusRoad 基于强大的人工智能,提供缺失的信息和工具来教育您并使您成为交易专家,成为成功的交易者。 几乎所有技术指标都滞后,这意味着它们只能报告已经发生的事情。因此,他们只确认您过去可以看到的价格已经在哪里。我们相信领先指标可以预测未来价格,而无需重新绘制,也不要过度依赖可能改变并导致重新绘制的滞后指标。如果您根据滞后指标进行交易并建立头寸,您就知道您已
Auto Order Block with break of structure based on ICT and Smart Money Concepts Futures Break of Structure ( BoS )             Order block ( OB )            Higher time frame Order block / Point of Interest ( POI )    shown on current chart           Fair value Gap ( FVG ) / Imbalance   ,  MTF      ( Multi Time Frame )    Volume Imbalance     ,  MTF          vIMB Gap’s Equal High / Low’s     ,  MTF             EQH / EQL Liquidity               Current Day High / Low           HOD /
Advanced Supply Demand MT5
Bernhard Schweigert
4.53 (15)
任何新手或专业交易者的最佳解决方案! 该指标是一款独特、高质量、且价格合理的交易工具,因为我们已经整合了许多专有功能和新公式。 依据此更新,您将能够显示双重时间帧区域。 您不仅可以显示一个较高的时间帧,还可以同时显示图表时间帧,加上更高的时间帧:显示嵌套时区。 供需双方所有交易者都会喜欢它。 :) 重要信息披露 高级供需的最大潜力,请访问 https://www.mql5.com/zh/blogs/post/720245   想象您的交易如何得以改善,是因为您能够精准定位入场或目标位吗? 构建于新的底层算法,它可以更轻松地识别出买卖双方之间的潜在失衡。 这是因为它以图形方式展示供需最强劲区域,及其过去的表现(显示旧区域)。 这些功能旨在帮助您更轻松地发现最佳入场区域和价位。 现在您可以针对您的交易品种和时间帧来优化和编辑区域强度! 高级供需指标适用于所有产品和时间帧。 它是一个新的公式,非常新的功能是两个区域强度函数可由用户输入进行调整! 这在交易中是一大优势。 当您学习如何使用专有功能,例如带有价格游离最小 X 因子的区域强度时,您能够判断该区域强劲与否。 供需区域用作警报触发器
AW Trend Predictor MT5
AW Trading Software Limited
4.76 (55)
一个系统中趋势和故障水平的组合。先进的指标算法过滤市场噪音,确定趋势、进入点以及可能的退出水平。指标信号记录在统计模块中,您可以选择最合适的工具,显示信号历史的有效性。该指标计算获利和止损标记。 手册和说明 ->   这里 / MT4 版本 ->   这里 如何使用指标进行交易: 使用趋势预测器进行交易只需三个简单的步骤: 第 1 步 - 开仓 收到买入信号,成功率超过 70% 第 2 步 - 确定止损 通过相反的信号选择中继线 第 3 步 - 定义止盈策略 策略一:达到 TP1 时平仓 策略 2:达到 TP1 时平仓 50%,达到 TP2 时平仓剩余 50% 策略三:在趋势反转时平仓 好处: 从不重绘结果,信号严格位于蜡烛收盘时 它可以在顾问中使用 获利和止损标记 对交易策略或独立策略的重要补充 市场噪音过滤算法 适用于任何工具 统计模块: 为了更好地选择配对,请使用内置的统计计算。 计算交易 - 给出统计数据的信号总数 成功评级 - 达到 TP1 的信号百分比,或反转那些正获利的信号时的百分比 TakeProfit1 Hit - 达到 TP1 的信号百分比 TakeProfit2
TPSpro RFI Levels MT5
Roman Podpora
5 (5)
A key element in trading is zones or levels from which decisions to buy or sell a trading instrument are made. Despite attempts by major players to conceal their presence in the market, they inevitably leave traces. Our task was to learn how to identify these traces and interpret them correctly. Reversal First Impulse levels (RFI)   -  Version MT4                  INSTRUCTIONS                 RUS                 ENG                         R ecommended to use with an indicator   -  TREND PRO  
ICT, SMC, SMART MONEY CONCEPTS, SMART MONEY, Smart Money Concept, Support and Resistance, Trend Analysis, Price Action, Market Structure, Order Blocks, BOS/CHoCH,   Breaker Blocks ,  Momentum Shift,   Supply&Demand Zone/Order Blocks , Strong Imbalance,   HH/LL/HL/LH,    Fair Value Gap, FVG,  Premium  &   Discount   Zones, Fibonacci Retracement, OTE, Buy Side Liquidity, Sell Side Liquidity, BSL/SSL Taken, Equal Highs & Lows, MTF Dashboard, Multiple Time Frame, BigBar, HTF OB, HTF Market Structure
Professional Scalping Tool on Deriv Attention! The indicator will be sold in limited quantities!!! Description: This trading indicator is designed for professional traders focused on scalping. Designed with the market in mind, it provides highly accurate spike trading signals. It works on the M1 timeframe and supports the following symbols: Boom 300 Index, Boom 500 Index, Boom 1000 Index, Crash 300 Index, Crash 500 Index, Crash 1000 Index. Functional Features: - Direction: - Trading is ca
Blahtech Supply Demand MT5
Blahtech Limited
4.57 (14)
Was: $299  Now: $99   Supply Demand uses previous price action to identify potential imbalances between buyers and sellers. The key is to identify the better odds zones, not just the untouched ones. Blahtech Supply Demand indicator delivers functionality previously unavailable on any trading platform. This 4-in-1 indicator not only highlights the higher probability zones using a multi-criteria strength engine, but also combines it with multi-timeframe trend analysis, previously confirmed swings
介绍     Quantum Breakout PRO   ,突破性的 MQL5 指标,正在改变您交易突破区域的方式!由拥有超过13年交易经验的资深交易员团队开发,     量子突破 PRO     旨在通过其创新和动态的突破区域策略将您的交易之旅推向新的高度。 量子突破指标将为您提供带有 5 个利润目标区域的突破区域的信号箭头,以及基于突破框的止损建议。 它既适合新手交易者,也适合专业交易者。 量子 EA 通道:       点击这里 重要的!购买后请私信我领取安装手册。 建议: 时间范围:M15 货币对:GBPJPY、EURJPY、USDJPY、NZDUSD、XAUUSD 账户类型:ECN、Raw 或 Razor,点差极低 经纪商时间:GMT +3 经纪商:IC Markets、Pepperstone with Raw 和 Razor 的点差最低 规格: 不重漆! 最多 5 个建议利润目标区域 建议止损水平 可定制的盒子。您可以设置自己的 Box Time Start 和 Box Time End。 接触 如果您有任何疑问或需要帮
XQ Indicator MetaTrader 5
Marzena Maria Szmit
5 (1)
Step into the realm of Forex trading with confidence and precision using XQ, a cutting-edge Forex indicator designed to elevate your trading game to unprecedented heights. Whether you're a seasoned trader or just stepping into the world of currency exchange, XQ Forex Indicator empowers you with the insights and signals needed to make informed trading decisions. The signal conditions are a combination of three indicators, and XQ Forex Indicator only display  medium and long-term trends . The ind
TrendDecoder Premium MT5
Christophe, Pa Trouillas
5 (1)
确定范围和下一步可能的走势    |     获得早期信号和趋势强度   |     在反转之前获得明确的退出   |     了解价格将测试哪些斐波水平   |  非重绘、非延迟指标 - 手动和自动交易的理想选择 - 适用于所有资产和所有时间单位 推出时为   69 美元 --然后恢复到 >>   149 美元 购买后,  请联系我的频道  获取推荐设置 MT4 版本: 点击此处 使用 BladeSCALPER 和 PowerZONES 获取我们的完整方法 它是什么? TrendDECODER 集多种创新于一身,使趋势监测变得简单易行。 投射趋势线(Projective TrendLine )--快速参考即将到来的趋势 实时趋势线(RealTime TrendLine) 与投射趋势线(Projective TrendLine)的对比 - 与之前的同方向走势相比,市场是加速还是放缓? 实时趋势线交叉 -   趋势正在偏离轨道 使用 GreyBox -   市场不再是趋势并进入新的过渡序列 使用 DecoderSignals 和 Blue/Orange Clouds
MetaBands M5
Vahidreza Heidar Gholami
4.67 (3)
MetaBands使用强大且独特的算法绘制通道并检测趋势,以便为交易者提供进出交易的潜在点。它是一个通道指标和强大的趋势指标。它包括不同类型的通道,可以通过使用输入参数简单地合并以创建新通道。MetaBands使用所有类型的警报通知用户市场事件。 功能 支持大多数通道算法 强大的趋势检测算法 能够合并不同类型的通道 多时间帧和多货币(信号矩阵) 所有类型的警报功能(声音、屏幕闪烁、推送通知、电子邮件、弹出窗口、箭头) 它永远不会重绘 趋势检测 MetaBands使用在通道内振荡的蓝色线来检测趋势。当该线遇到通道的上界时,表明开始下跌趋势,当它遇到下界时,表明开始上涨趋势。如果蓝线接近中线,则市场处于整理期。 该指标使用独特的方法来检测趋势。一开始可能看起来有些复杂,但如果您观看视频教程,您就会意识到它是多么强大且易于使用。 入场和出场信号 当趋势变化或价格穿过上下通道时,MetaBands会立即通过不同的方法提醒交易者,这些方法可以在指标设置中启用。 信号矩阵 要监视来自不同时间框架的多个符号并在一个地方查看信号,请单击右上角按钮或按键盘上的M键以打开信号矩阵。该矩阵可以
首先值得强调的是,这个交易系统是一个不重绘、不重画和不滞后的指标,这使它非常适合专业交易。 “智能支撑和阻力交易系统”是专为新手和经验丰富的交易者量身定制的先进指标。它赋予交易者在外汇市场上精确和自信的能力。这个综合系统结合了7+种策略、10个指标和各种交易方法,包括日内交易策略、波段交易策略、支撑和阻力策略、蜡烛图模式策略、VWAP策略、多时间段趋势策略等。它提供箭头信号、入场和出场点、交易警报、更高时间框架的趋势分析、实时交易监控以及见解深刻的趋势和成交量蜡烛染色。通过自动支撑和阻力检测,这是一个多面手的指标,帮助交易者在不同的市场条件下做出明智的决策。 “智能支撑和阻力交易系统”是一个强大的技术分析方法,融合了一套高端和强大的指标和工具。在其核心,这个系统识别关键的支撑和阻力水平,这些水平作为潜在市场反转或延续的关键区域。该系统无缝集成了多时间框架趋势面板,增强了交易者在不同时间框架下评估当前趋势方向的能力。此外,蜡烛图模式检测器扫描价格图表以获取重要的蜡烛图模式,为潜在的市场走势提供宝贵的见解。此外,VWAP(成交量加权平均价格)的加入帮助交易者评估市场情绪和日内趋势
Blahtech Market Profile MT5
Blahtech Limited
5 (8)
Was: $249  Now: $99   Market Profile defines a number of day types that can help the trader to determine market behaviour. A key feature is the Value Area, representing the range of price action where 70% of trading took place. Understanding the Value Area can give traders valuable insight into market direction and establish the higher odds trade. It is an excellent addition to any system you may be using. Inspired by Jim Dalton’s book “Mind Over Markets”, this indicator is designed to suit the
Malaysian SNR Levels
Matthias Horst Pieroth
This indicator can be used to display Support and Resistance levels according to  the  Malaysian SNR concept , in which Support and Resistance are exact levels of a line chart. Malaysian SNR There are 3 different horizontal levels in Malaysian SNR: A-Level : This level is located at the peak of this line chart. (shape looks like the letter A) V-Level : Level at the valley of a line chart, (shape looks like the letter V) Gap-Leve l: This level is located at the Close/Open gap between two cand
Volume by Price MT5
Brian Collard
5 (3)
The Volume by Price Indicator for MetaTrader 5 features Volume Profile and Market Profile TPO (Time Price Opportunity). Get valuable insights out of currencies, equities and commodities data. Gain an edge trading financial markets. Volume and TPO histogram bar and line charts. Volume Footprint charts. TPO letter and block marker charts including split structures. Versatile segmentation and compositing methods. Static, dynamic and flexible ranges with relative and/or absolute visualizations. Lay
Account Graph MT5
Kyra Nickaline Watson-gordon
5 (1)
An indicator to draw a graph of account current and historical state such as Balance, Equity, Margin, Free Margin, Margin Level, Drawdown, Account Profit, Deposit and Withdrawals. Indicator Inputs : Draw Balance Graph Draw Equity Graph Draw Margin Graph Draw Free Margin Graph Draw Margin Level Graph Draw Drawdown Graph Draw Account Profit Graph Hide Data on Chart and Buffers Connect Gaps by Lines Sign of DDs on Profit Sign of DDs on Loss Tips : The Indicator will draw historical balance gra
对任何新手或专家交易者来说都是最好的解决方案! 这个指标是一个独特的、高质量的、负担得起的交易工具,因为我们已经纳入了一些专有的功能和一个秘密的公式。只需一张图表,它就能给出所有28种货币对的警报。想象一下,你的交易将如何改善,因为你能够准确地确定新趋势或剥头皮机会的触发点 建立在新的基础算法上,它使识别和确认潜在交易变得更加容易。这是因为它以图形方式显示了一种货币的强势或弱势是否正在加速,并测量了这种加速的速度--把它想象成你汽车中的速度表。当你加速时,事情显然会发生得更快,这在外汇市场上也是一样的,即如果你配对的货币正在向相反的方向加速,你就会发现一个潜在的有利可图的交易。 货币动量的垂直线和箭头将指导你的交易! 动态的市场斐波那契23水平被用作警报触发器,将适应市场活动。如果冲动触及黄色触发线,您将在MetaTrader或您的电子邮件或推送警报中收到警报。然后你就知道作为一个交易员应该做什么。货币对和方向已经给出。只要点击警报按钮,就可以切换到该货币对或打开一个新的图表,以便进一步分析。警报级别可以通过用户输入来改变,可以选择3个敏感度级别。 尽早获得新趋势的初
TPA True Price Action indicator reveals the true price action of the market makers through 100% non-repainting signals strictly at the close of a candle! TPA shows entries and re-entries, every time the bulls are definitely stronger than the bears and vice versa. Not to confuse with red/green candles. The shift of power gets confirmed at the earliest stage and is ONE exit strategy of several. There are available now two free parts of the TPA User Guide for our customers. The first "The Basics"
IX Power MT5
Daniel Stein
5 (2)
IX Power 终于将 FX Power 的无与伦比的精确性带到了非外汇交易符号中。 它能准确判断您喜爱的指数、股票、商品、ETF 甚至加密货币的短期、中期和长期趋势强度。 您可以 分析 终端提供的 一切 。试试吧,体验一下您在交易时如何把握 时机 。 IX Power 主要功能 100% 精确的非重绘计算结果 - 适用于您终端中的所有交易符号 下拉式选择预配置以及可单独配置的强度分析周期 通过电子邮件、消息和手机通知的无数种通知选项 可访问的 EA 请求缓冲区 可自定义计算限制,以获得更好的性能 为希望查看更多信息的用户提供特殊的多实例设置 无尽的图形设置,让您在每个图表中都能找到最喜欢的颜色 采用 Windows 11 和 macOS 风格的圆角新面板设计 神奇的移动指标面板,可在子窗口和主图表之间无缝移动 适用于高分辨率 QHD、UHD 和 4K 显示器,并针对平板电脑和触摸屏进行了优化 IX Power 参数 最重要的参数不言自明,但我们很快会在另一篇文章中为您提供所有 IX Power 参数的完整说明。 使用别名 "参数可为技术交易符号
Italo Volume Indicator MT5
Italo Santana Gomes
4.73 (15)
BUY INDICATOR AND GET EA FOR FREE AS A BONUS + SOME OTHER GIFTS! ITALO VOLUME INDICATOR  is the best volume indicator ever created, and why is that? The Indicator works on all time-frames and assets, indicator built after 7 years of experience on forex and many other markets. You know many volume indicators around the internet are not complete, does not help, and it's difficult to trade, but the Italo Volume Indicator is different , the Italo Volume Indicator shows the wave volume, when market
Owl Smart Levels MT5
Sergey Ermolov
4.47 (36)
MT4版本  |   FAQ Owl Smart Levels Indicator 是一個完整的交易系統,包含 Bill Williams 的高級分形、構建正確的市場波浪結構的 Valable ZigZag 以及標記準確入場水平的斐波那契水平等流行的市場分析工具 進入市場和地方獲利。 策略的详细说明 指示灯使用说明 顾问-贸易猫头鹰助手助理 私人用户聊天 ->购买后写信给我,我会将您添加到私人聊天中,您可以在那里下载所有奖金 力量在於簡單! Owl Smart Levels 交易系統非常易於使用,因此適合專業人士和剛開始研究市場並為自己選擇交易策略的人。 策略和指標中沒有隱藏的秘密公式和計算方法,所有策略指標都是公開的。 Owl Smart Levels 允許您快速查看進入交易的信號,突出顯示下訂單的水平並向您發送有關已出現信號的通知。 優點很明顯: 清楚地顯示主要和更高時間框架的趨勢方向。 指示儀器信號的出現。 標記開單、止損設置和固定利潤的水平。 沒有多餘的,只有必要的結構! ZigZag 表示全球趨勢的方向,因此也表示貿易方向。 市場反轉點的短線清楚地表明在什麼水平上構建斐波
作者的更多信息
BoxFibo MT5
Sergei Kiriakov
It is just an alternative fibo lines. mt4 have is a very strange drawing of fibo lines, this utilites was written for mt4, but for mt5 it may not be particularly useful. A simple Box (Rectangle) graphic element with adjustable levels binding: it is possible to specify up to 17 custom levels, all rectangles on the chart with the given prefix in their name are processed. Levels are specified in % of the height of the rectangle. A convenient graphical element for analyzing charts by growth-correct
FREE
Levels tool
Sergei Kiriakov
Just a panel for drawing levels. Minimal but very useful thing. This is a reimagining of Color Levels Pro. ---- 4 types of customized levels. support for rectangle and line levels. The indicator parameters are very simple and are divided into blocks. For any update idea please contact me here. ---- Extension version " Levels tool pro " ---- don't suffer don't suffer ---- Enjoy your work!!!!!!!! ----
FREE
BoxFibo
Sergei Kiriakov
It is just an alternative fibo lines, because mt4 have is a very strange drawing of fibo lines A simple Box (Rectangle) graphic element with adjustable levels binding: it is possible to specify up to 17 custom levels, all rectangles on the chart with the given prefix in their name are processed. Levels are specified in % of the height of the rectangle. A convenient graphical element for analyzing charts by growth-correction levels. Enjoy your work!
FREE
Just a panel for drawing levels. Minimal but very useful thing. This is a reimagining of Color Levels Pro. ---- 4 types of customized levels. support for rectangle and line levels. The indicator parameters are very simple and are divided into blocks. For any update idea please contact me here. ---- don't suffer don't suffer ---- Enjoy your work!!!!!!!! ----
FREE
The tool for exploring seasonal patterns. It compares the chart with charts of other years and compares with the average for other years. Allows you to shift charts if necessary.  Explore any year by specifying the zero point. Up to 10 charts in one tool. Works only on the daily chart ! The best for you! Enjoy your work! (It's not indicator - do not download demo it not work) for mt5 Seasonly
Just a panel for drawing levels. Minimal but very useful thing. This is a further development of the free version. This is the version that I use myself and it has many behavior adjustments. ---- 12 types of customized levels. Support for rectangle and line levels. If you need to prevent a level from extending, add "noext" to the end of the name level object. For any update idea please contact me here. ---- This is not an indicator, don't download the demo, it doesn't work For test see free ver
Seasonly
Sergei Kiriakov
The tool for exploring seasonal patterns. It compares the chart with charts of other years and compares with the average for other years. Allows you to shift charts if necessary.  Explore any year by specifying the zero point. Up to 10 charts in one tool. Works only on the daily chart ! The best for you! Enjoy your work! (It's not indicator - do not download demo it not work) for mt4 Seasonly MT4
Just a panel for drawing levels. Minimal but very useful thing. This is a further development of the free version. This is the version that I use myself and it has many behavior adjustments. ---- 12 types of customized levels. Support for rectangle and line levels. If you need to prevent a level from extending, add "noext" to the end of the name level object. For any update idea please contact me here. ---- This is not an indicator, don't download the demo, it doesn't work For test see free ver
筛选:
无评论
回复评论