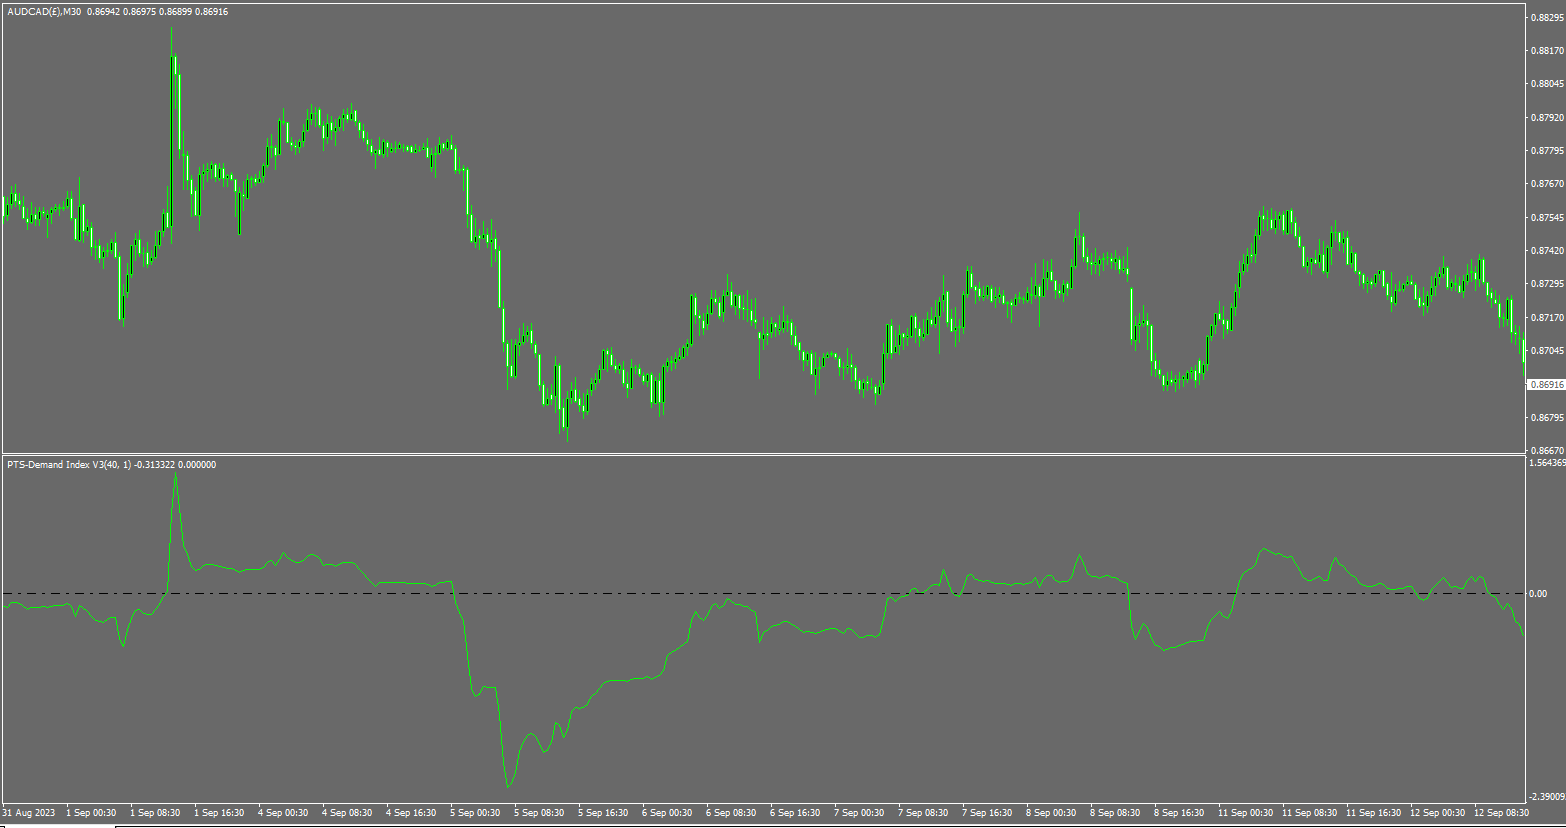
PTS Demand Index MT5
- 指标
- PrecisionTradingSystems
- 版本: 2.0
- 激活: 10
Precision Trading Systems的PTS Demand Index代码
Demand Index是James Sibbet的创作,使用复杂的代码来简化对成交量和价格组合的解释工作。
理解成交量从未是一项容易的任务,但这个美丽的编程作品确实让这项工作变得更加轻松。
这个指标有几种方式可以使交易者和投资者受益匪浅。
背离(作为领先指标)
多年来,我研究了许多技术指标,我认为Demand Index是发现有意义的背离的佼佼者之一。
如果市场价格创出新高,而Demand Index没有创出新高,这被称为熊市背离。在我的网站上有几张极端背离案例的照片,可以帮助您理解要寻找什么。背离的差异越大,从趋势变化事件的预测角度来看,它就越重要。
趋势检测(作为滞后指标,带有内置的警报功能)
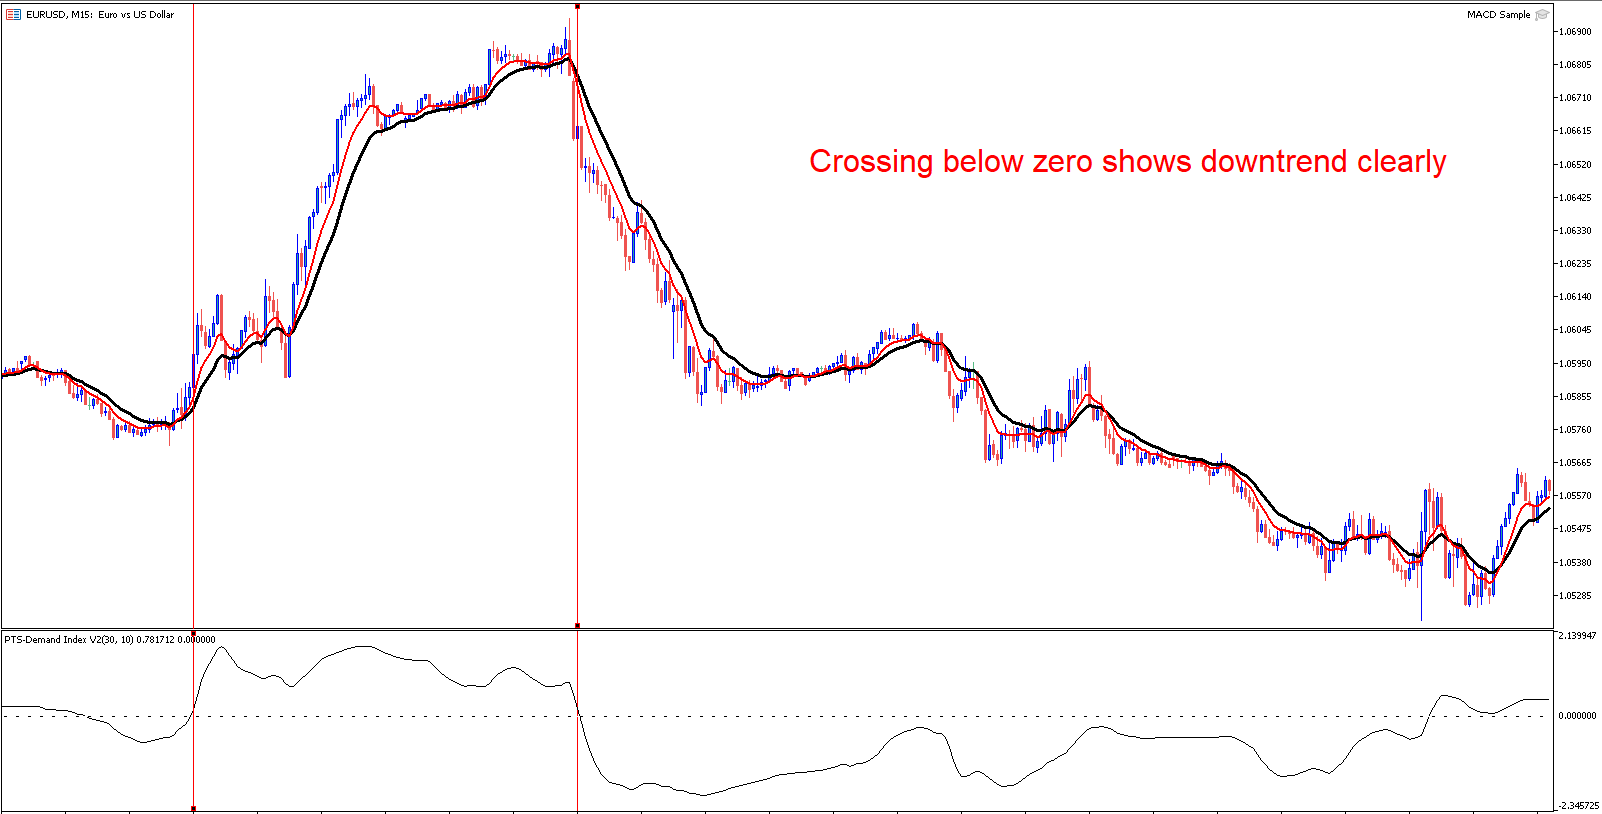
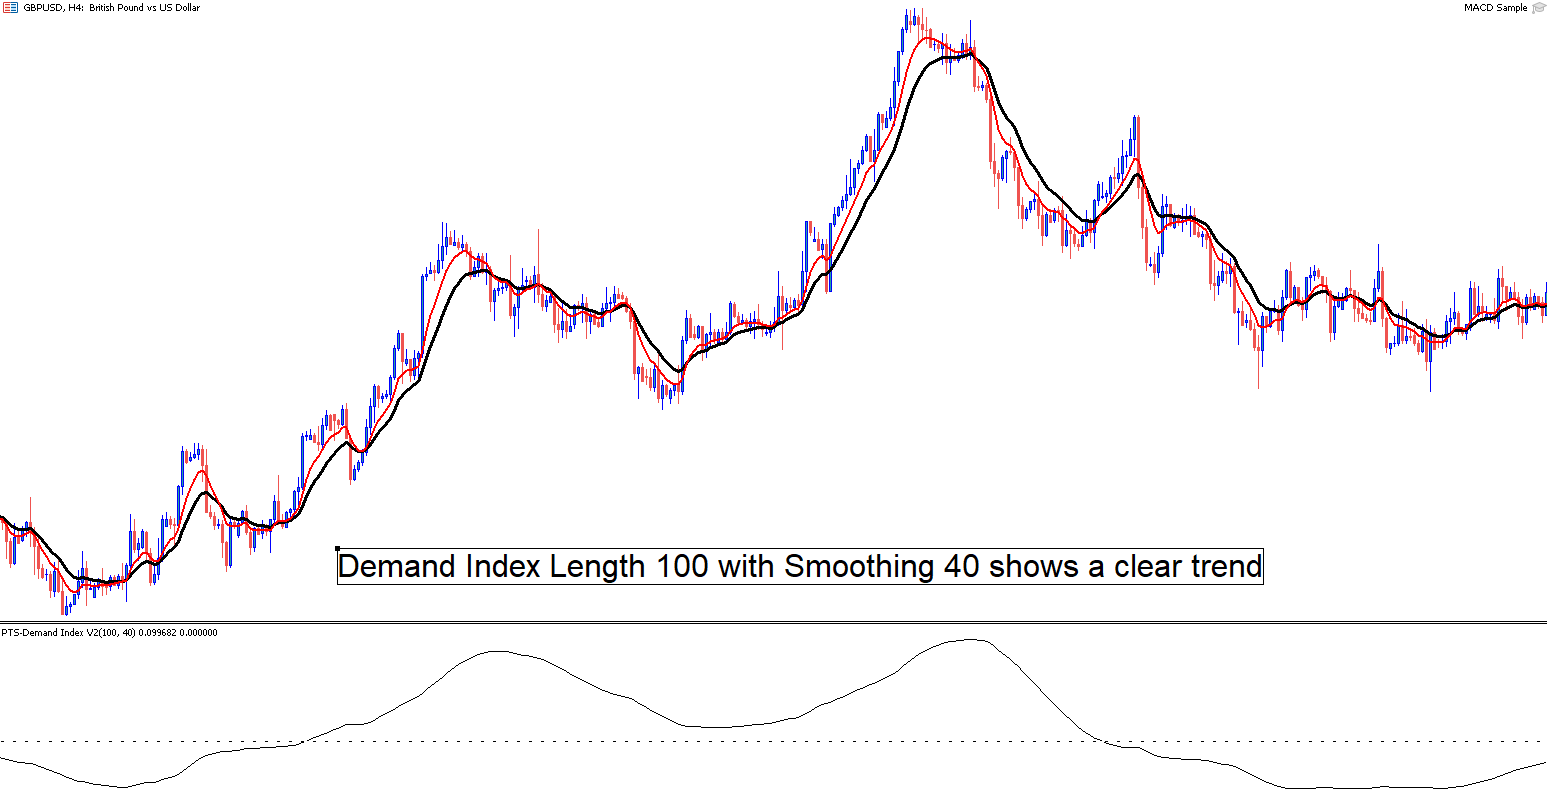
零线的交叉表示在您指定的长度内进行净卖出或净买入的迹象,必须注意,在这种情况下,该指标充当滞后指标,并且需要更长的长度以及一些平滑来提供有意义的结果。我建议为此目的使用至少>40的长度,添加一些平滑>5以减少虚假信号。
要启用零线交叉的警报,请单击指标属性、输入,使用警报= true。
当警报触发时,消息窗口将弹出,显示符号名称和消息“Demand Index已经上穿(或下穿)零”。
警报的默认设置为false(假)。
尽管如上所述,但了解“真正的零线穿越”趋势变化和虚假信号之间的区别非常重要。
如果Demand Index在零附近徘徊并波动,那么它并没有什么意义,但是醒目的突破是您需要寻找的那种移动。正是成交量通过引起供需失衡来推动价格,从而导致更多积极的买家或卖家,从而导致市场沿着指标的方向移动。
这款产品旨在以最清晰的方式显示确切的信息。
突破(作为领先指标)
当您可以在Demand Index指标中看到一段范围或紧密拥挤的区域时,值得注意的是,当从该范围中明确定义的突破发生时,它很可能会随之而来,且方向与基础市场相同。
与上述情况一样,了解“噪声”和真正的突破模式之间的区别也很重要,这必须是一个明显的观察,如果您不得不花时间自问它是否真实,那么它可能不是值得采取行动的信号。
下一次移动的预测(作为领先指标)
当Demand Index出现极端上升峰时,意味着有大量的买盘,通常会随之而来市场的另一个上升峰。
同样的情况反过来,当出现大幅下行峰时,意味着市场将再次创出新的低点。
通常,这些动作后面会出现背离,随后导致趋势反转。
一段时间内的扩展背离(作为领先指标)
当市场继续下跌,Demand Index继续上涨时,这是一个主要底部正在形成的迹象,反之亦然。
我已经确定了可以与Demand Index一起使用的五个新规则,可以在我的网站上搜索找到。许多图表示例清楚地说明了这一点。