USA Indexes Quant Indicator
- 指标
- Thunder Investment Group Limited
- 版本: 2.0
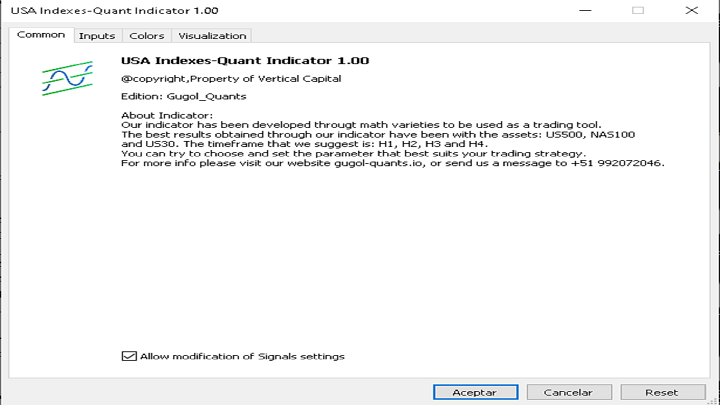
Property of Vertical Capital
Edition: Gugol_Quants
About USA INDEXES QUANT_INDICATOR:
This is a indicator created by math modulation to be used as a trading tool, which was developed in MQL. (MT5)
This indicator is for use only with US500(S&P500), NAS100(Nasdaq Composite) and US30(Dow Jones). Signals are activated on "Open" Candle.
It’s based on Intraday/Swing Trades whose main timeframe is H1, H2, H3 and H4.
However you can use it with other assets by testing with the appropriate settings.
** About indicator, we can recommend you the best commercial analysis settings, just contact us**
@copyright
Recommendations
- The Recommended Timeframe that you can use is H1, H2, H3 and H4.
- You can use the indicator on the following assets: US500, NAS100 and US30. Signals are activated on "Open" Candle.
- An ECN broker is always recommended for your manual trading(We suggest: PEPPERSTONE).
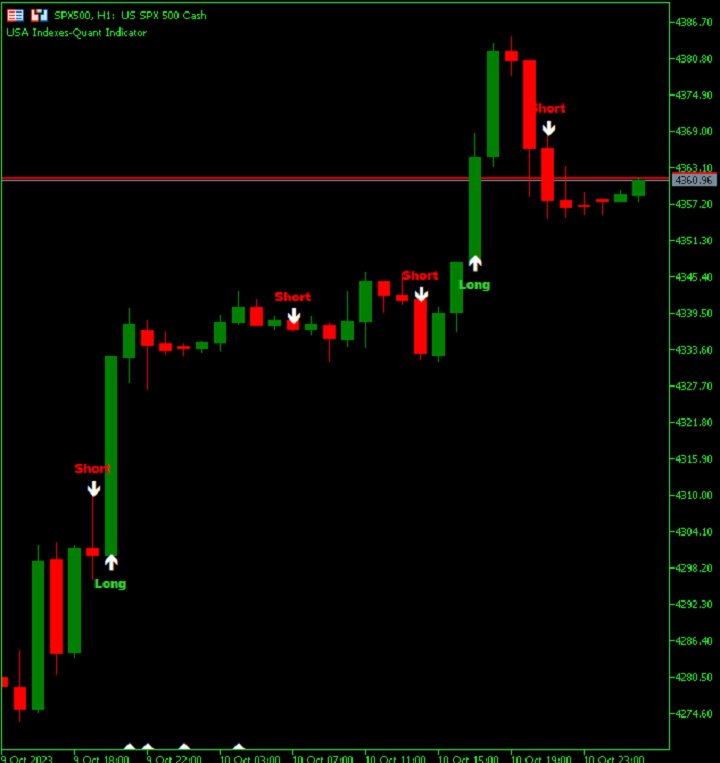
- The indicator is very intuitive, follow the arrows to open the trades.
- If the chart appears distorted, reset and configure the timeframe until the signals appear clean (As shown in the reference image)
- When trading in risk assets, you should always have a trading plan associated with good risk management.