• 概述
  • 评论
  • 评论

Price Feed Alert

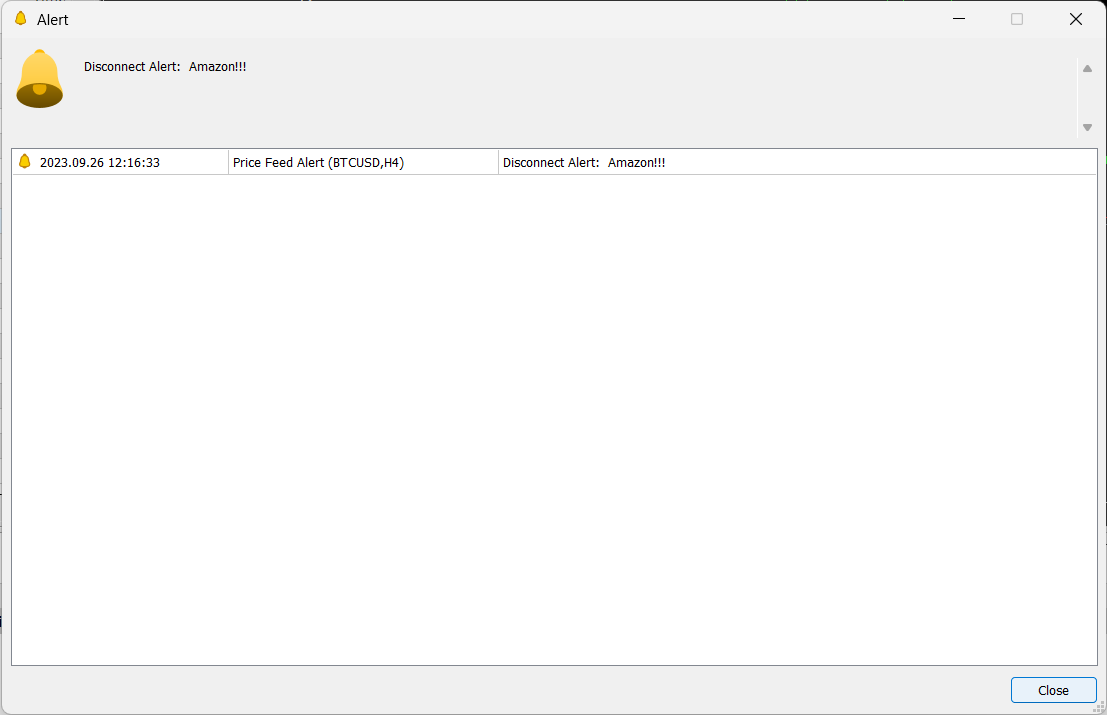
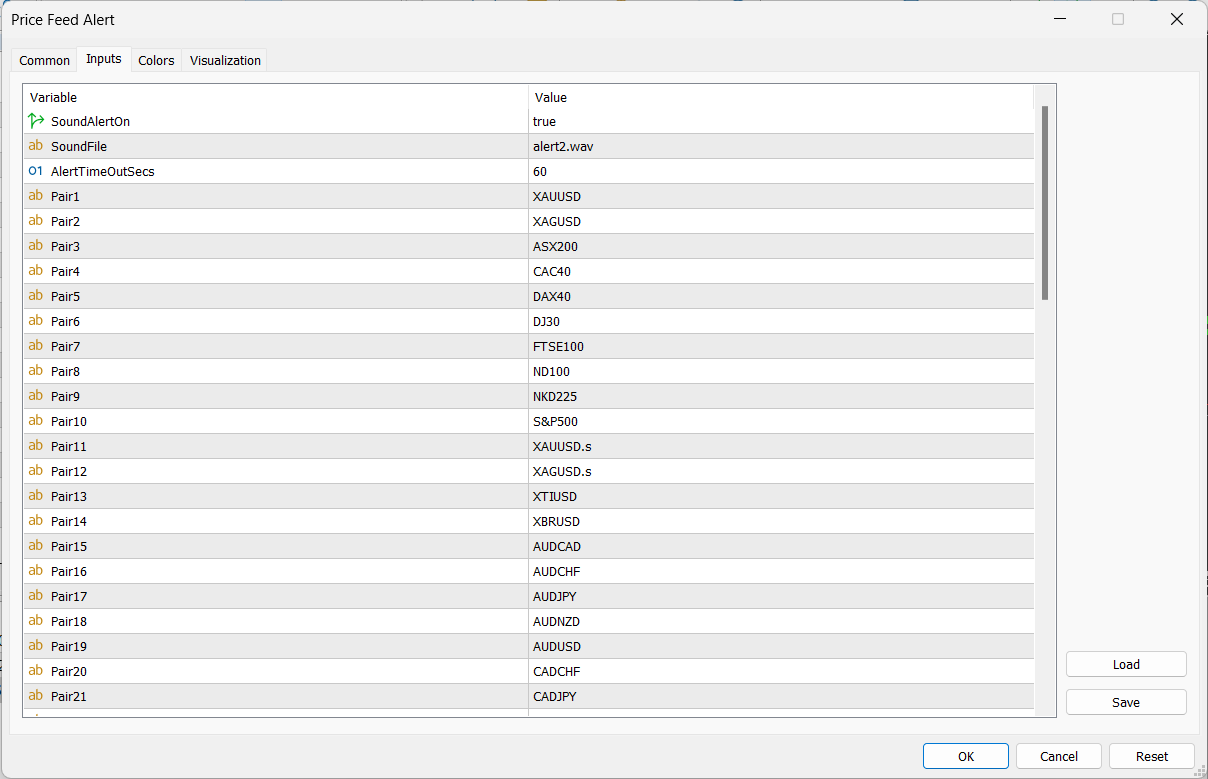
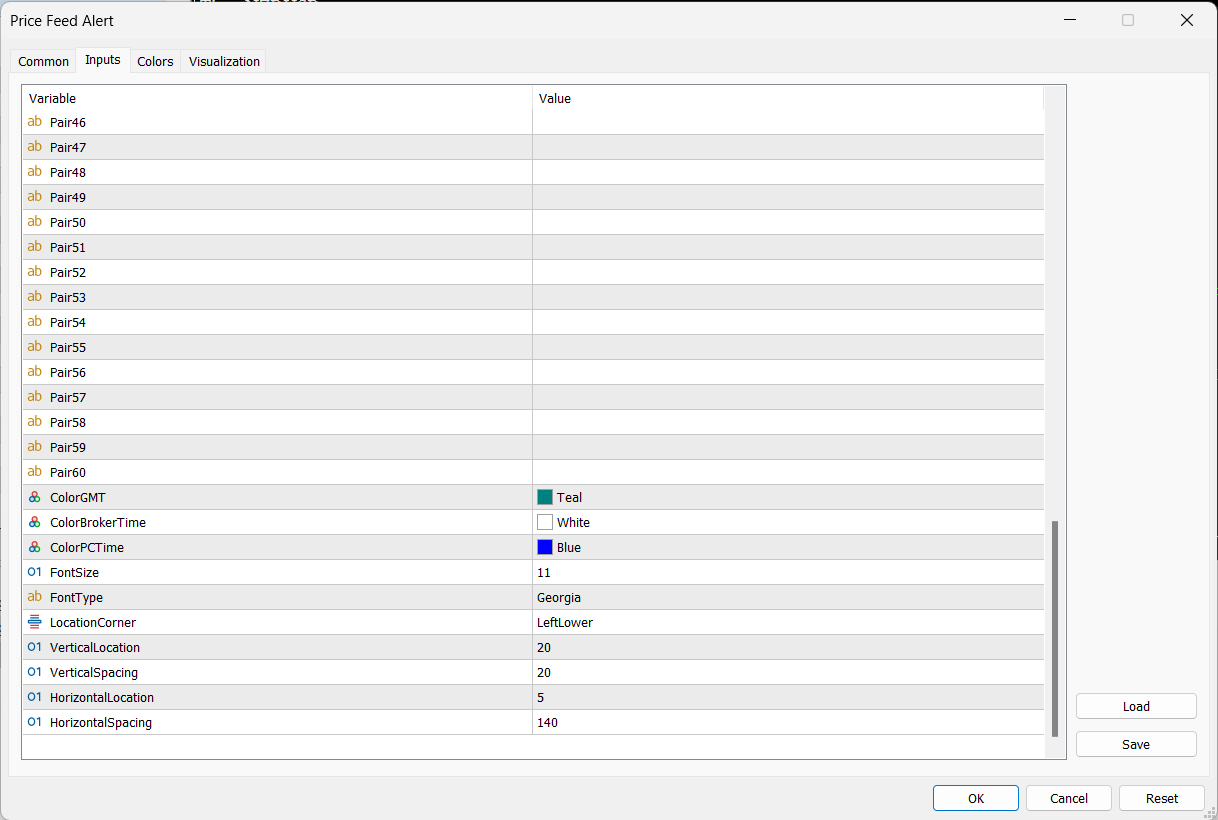
Top indicator for MT5 providing alert and notification for symbols if any price freezes!
Guys, try to buy at least one month version for testing purposes!

This indicator displays the current time for multiple Forex pairs and alerts when there's a disconnection between broker and PC time. It'll be very help full for trading platforms administrator who are monitoring hundreds of symbols in a time.

推荐产品
Trend Info
Vitalii Zakharuk
By launching the Trend Info indicator, the user will see two lines and bars of different colors, which can change color to green during an uptrend, to red during a downtrend or to be yellow during an uncertainty. The indicator is based on the calculation of price values, in order to answer questions about what direction the trend is acting on the market at the moment and when this trend will end. The trader uses the Trend Info indicator to determine the market situation. This is a trending al
By using (MOMENTUM and VELOCITY and ACCELLERATION) and the power of machine learning we can accurately calculate the current strength of the currencies of each time frame. - It's really easy to use: Choosing to trade between currency pairs that have clear and dominant trends will give you a great advantage. -The currency pair strength meter is rated from -100 to + 100
This indicator is a unique, high quality and affordable trading tool because we have incorporated a number of proprietary features and a new formula. With this update, you will be able to show double timeframe zones. You will not only be able to show a higher TF but to show both, the chart TF, PLUS the higher TF: SHOWING NESTED ZONES. All Supply Demand traders beautifully integrated with Moving Average Clouds. I am sure you will love it. Tips User Manual Use my template  Optimize Zone Strength f
Trend speed vector - is the oscillator for manual trading. System measures trend direction and it's speed. Histogram shows 4 colors: Lime --> Strong up movement with good gain speed; Green --> Up movement with low gain speed Red --> Strong down movement with good gain speed; Orange --> Down movement with low gain speed Green and Orange histograms show weak market's movements and thуese places excluded from signal points. Buy arrow is plotted during strong down movement when bearish gain speed i
The default input values are already optimized for EURUSD at time frame M1, spread at 14 and hedged account mode with leverage 1:100 and initial deposit of US$ 10,000, if you don't have this balance, I suggest you to use a CENT account. Always use the strategy tester optimization to set the best values for your assets, time frame, spread and account mode. It is very important and strongly recommended for successful trading. Optimize the input values as your needs.The EA's Strategy The Strategy T
Hedging Star
Pran Gobinda Basak
介绍一下 Hedging Star - 一个强大的专家顾问,旨在通过内置的止损保护来保障您的投资。在实盘交易之前,强烈建议在模拟环境中进行彻底的测试。从保守的 0.01 手开始,以评估其表现。该专家顾问经过优化,适用于 GBPUSD 和 USDJPY 货币对的交易。 Hedging Star 的一个突出特点是其追踪止损功能,可以动态调整以最大化利润并最小化风险。此外,用户可以灵活调整参数,如手数、止损、获利等,使他们能够根据自己的偏好和风险承受能力定制策略。 放心,有了 Hedging Star,您的资金就安全了,因为它采取了全面的风险管理措施。如有任何疑问或需要帮助,请随时通过私信与我联系。您的成功是我的首要任务。感谢您选择 Hedging Star。 #套保 #剃头 #交易 #机器人 #PranGoninda
Indicator Statistics MultiPairs 1. Current Openning Ords - Symbols Openning + Buy Orders + Buy Volume + Sell Orders +Sell Volume - DrawDown by Symbols - Floating by Symbols 2. Closed Orders - Statistics by Today, Week, Month, YTD and Volume - Sum of Closed Orders by Symbol 3. Statistics by Day - Statistics by Say and Volume 4. DrawDown by Day - Each day DrawDown in Week - Percent of DrawDown Contact me at Telegram @MaiMew68
Dragon Ultra
Dang Cong Duong
5 (1)
At first, I got my teeth into   Dragon Ultra   Expert Advisor. Build a smart grid both with the trend and against the trend. The powerful combination of locking and partial loss closure. The program is constantly being improved and upgraded. You should use the  Dragon Training proficiently before buying the product. You can run in real environment with the Dragon Lite , note that the input parameters are hidden. Advantages of the Dragon Ultra Smart recovery system with Fibonacci grid Good resist
Demarker pullback system - is the manual trading system for choppy markets. It show 2 colored histogram.  When histogram is blue - market is quite bullish, when histogram ir orange - market is more bearish. Up arrow is plotted when histogram is in oversold zone but blue color. Down arrow is plotted when histogram is in overbought zone but orange color. These patterns shows false breakout and possible soon reverse(price is overbought but shows bearish signs and price is oversold but shows bullis
Zona de Trade
Edson Cavalca Junior
The robot operates within pre-configured channels at the beginning of the operation. Use a Demo account or the Strategy Tester to find the best setup for the asset you want to trade. If you have any doubts about handling the robot, send a comment in the "Comments" tab and we will respond and insert you in our private group. Follow the steps below to configure it. After dragging the robot onto the chart, go to "input parameters and configure the following data: Enter th
FundMaster
Riccardo Moreo
This expert advisor uses a multy currency grid strategy that avarages the purchase price to close the grid operations when they are in profit, i have written the inputs so that you can just plug it in, decide the risk and pairs you want to use and it's done! as of now you can run it on GBPUSD, AUDUSD and NZDUSD beacause as of now these are the best pairs that this expert works on. RECOMMENDATION - MINIMUM ACCOUNT OF 1000$ - VPS FOR OPTIMAL RESULTS - 1:500 LEVERAGE TO HAVE A GOOD MARGIN TO WORK
Delving deep into the sphere of finance and trading strategies, I decided to conduct a series of experiments, exploring approaches based on reinforcement learning as well as those operating without it. Applying these methods, I managed to formulate a nuanced conclusion, pivotal for understanding the significance of unique strategies in contemporary trading. Neural network advisors, despite showcasing impressive efficiency in the initial stages, proved to be highly unstable in the long run. Vario
Introduction This indicator detects volume spread patterns for buy and sell opportunity. The patterns include demand and supply patterns. You might use each pattern for trading. However, these patterns are best used to detect the demand zone (=accumulation area) and supply zone (=distribution area). Demand pattern indicates generally potential buying opportunity. Supply pattern indicates generally potential selling opportunity. These are the underlying patterns rather than direct price action. T
该指标基于离散哈特利变换。使用此转换允许您在处理金融时间序列时应用不同的方法。该指标的一个显着特点是它的读数不是指图表上的一个点,而是指指标周期的所有点。 处理时间序列时,指标允许您选择时间序列的各种元素。过滤的第一种可能性是建立在这种方法上的——所有不必要的高频分量都被简单地丢弃。第一个图展示了这种方法的可能性,选择CutOff参数,可以选择原始时间序列的细节(红线-只剩下主要信息CutOff = 0,黄色-主要和最低频率周期CutOff = 1 , 蓝色 - 所有最高频的噪声都被丢弃 CutOff = 4 )。然而,这不是唯一的可能性——噪声分量可以通过额外的过滤来抑制。 这两个选项都在该指标中实施。它的参数是: iPeriod - 指标周期 Shift - 指标相对于当前柱的偏移。通过更改此参数,您可以评估指标过去的表现。 NoiseReduction 是一种降低噪音的方法。可能的值:none - 不抑制噪声(在这种情况下只有 CutOff 参数起作用),constant - 噪声通过常数衰减,linear - 线性噪声抑制,对数 - 对数衰减,square - 根据平方根进行
斐波那契折返和扩展画线工具 适用于MT5平台的斐波那契折返和扩展画线工具,非常适合于利用 帝纳波利点位交易法 和黄金分割交易的交易者 试用版: https://www.mql5.com/zh/market/product/35884 主要功能: 1.可以直接画线多组斐波那契折返,重要折返点之间的关系一目了然 2.可以画出斐波那契扩展 3.画线的斐波那契折返和扩展均可左右移动方便观察,有数值显示 4.图表显示非常清爽 5.可通过数字键切换周期 功能键: 1.按 [ 画折返,按需画折返,最多可画8组 2.按 ] 画扩展 3.按 \ 删除当前周期下的所有扩展和折返 4.移动、删除折返和扩展 (1)点击第一组折返的F5线条, 点击1次(变成黄色),按键盘上的Delete可删除该焦点的折返。 点击2次(恢复颜色),可以移动折返到合适的位置 (2)点击COP的线条 点击1次(变成黄色),按键盘上的Delete可该组折返 点击2次(恢复颜色),可以移动扩展到合适的位置 5.修改折返和扩展: (1)选择焦点F或反弹点数字(F或
Volume Trade Levels
Mahmoud Sabry Mohamed Youssef
The idea behind this indicator is very simple , First it contains 2 mechanisms to place your trades: 1- Enter the Pips you want to duplicate to price levels. 2- Automatically let the indicator specify the largest Buy / Sell Volume Candle and place duplicated levels based on the candle itself. How it works: 1- Enter the Pips you want to duplicate to price levels:    1- once the indicator is loaded you will need first to Specify the number of pips in the indicator Configuration window ,you can
SL Sniper
Chalin Saranga Jayathilake
SL Sniper I coded. to trade with the trap system of the main market with vsa   for more information and you want vsa system  please  pm me Suggested timeframes to trading : M1- M2- M3- M5 - M15-M30 -H1  Wait london and newyork markert open after wait best then select the best strong index and weakest index by sniper Histogram is indicated by one arrow at a time. The signal in the end direction of weak and strong All red and green mean trending index,natural market is displayed only in white SL
This product is designed for the MT5 platform and offers two key features: VWAP (Volume Weighted Average Price) calculation and Volume Profile analysis. Advantages: VWAP Calculation: The product calculates the VWAP, which is a popular indicator used by traders to determine the average price of a security based on its trading volume. It helps identify potential buying or selling opportunities by comparing the current price to the average price weighted by volume. Volume Profile Analysis: The prod
News Hedging Pro  is a unique robot that allows you to trade during the most critical news announcement periods by your predefined strategy. You can preset the strategy to trade, and then it will trade that news automatically when the news comes. News release gives opportunity to have pips since the price usually has big move at that time. Now with this tool, trading news become easier, more flexible and more exciting than ever. No waiting, no confusing anymore. Product Links Fully  Descripti
Sinal IFR
Aurenice Barros De Abreu Carvalho
Sinal com base no indicador RSI, que indica compra marcando com uma seta verde quando o preco sai da região de sobrevendido, e sinaliza venda quando o preco sai da regiao de sobrecomprado. A sinalizacão é  feita com uma seta verde para compra e seta rosa para venda. Permite configurar o nível de sobrecompra e de sobrevenda, além do período do RSI. Funciona em qualquer período gráfico.
Boom coins indicator and crash coins
Waleed Hamood Said Al Rawahi
YouTube上的指標直播。更多可信度請點擊下面的鏈接。還有指標的視頻可以觀看。注意直播晚了,不要依賴,只有對指標的回顧僅回顧指標的準確性,幾乎不輸,利潤率達到 95%。我將在 CRASH coin 1000 INDICES 上非常準確地工作 YouTube上的指標直播。更多可信度請點擊下面的鏈接。還有指標的視頻可以觀看。注意直播晚了,不要依賴,只有對指標的回顧僅回顧指標的準確性,幾乎不輸,利潤率達到 95%。我將在 CRASH coin 1000 INDICES 上非常準確地工作 YouTube上的指標直播。更多可信度請點擊下面的鏈接。還有指標的視頻可以觀看。注意直播晚了,不要依賴,只有對指標的回顧僅回顧指標的準確性,幾乎不輸,利潤率達到 95%。我將在 CRASH coin 1000 INDICES 上非常準確地工作
Ticks CCI
Andrej Nikitin
The Commodity Channel Index(CCI) indicator drawn using a tick chart. After launching it, wait for enough ticks to come. Parameters: period - number of single periods used for the indicator calculation. calculated bar - number of bars for the indicator calculation. The following parameters are intended for adjusting the weight of CCI signals (from 0 to 100). You can find their description in the Signals of the Commodity Channel Index section of MQL5 Reference. The oscillator has required directio
place a vwap line starting from the line placed on the chart parameters: tick_mode: enable to use ticks instead of bars. this uses a lot more cpu processing power prefix: prefix to add for line created by indicator line_color: set the color of the line created line_style: set the line style of the line created applied_price: set the price of bar to use of the bar std_dev_ratio: set the multiplier for the std dev channel
该交易策略适合USDJPY,根据过往历史数据回测,平均年化 20%~25% ,属于相当稳健的交易策略。策略充分利用BUY/SELL对冲,有效的降低损失,提高收益。 交易条件提示: 选择USDJPY货币对;请不要将该程序应用于其他货币对,本程序不支持其他货币对; 初始入金:不低于1000刀;如果起始金额过低,在交易的过程中,很可能会导致维持保证金率过低,导致自动平仓风险; 杠杆为:>1:100,推荐1:500模式; 本策略为全自动化交易脚本,无需手动开仓、平仓;当然也支持手动开仓、平仓;如果在程序运行过程中出现亏损,请耐心等待市价波动,不要轻易手动平仓;亏损的部分在未来有可能弥补回来。 如果你也追求稳健的收益,请选择它。 P.S 耐心和毅力总是会得到回报
Ershov 38 parrots MT5
Aleksei Ershov
5 (1)
The indicator is designed to close positions on the market in time. For example: to take profits ahead of schedule if the price has not reached TakeProfit, and the market is turning around. The indicator analyzes the momentum, not the trend. He does not give any information about the trend. The indicator is well suited for finding divergence. The Ershov 38 Parrots indicator dynamically adjusts to the market and detects price movement impulses of medium and high amplitude. It almost does not rea
Swiss Burger
Karthik Gopalakirshnan
SWISS BURGER                                             Kindly use this expert Advisor in Higher time Frame HAI FRIENDS AM KARTHIK GOPALAKIRSHNAN Before going for Demo make sure the Your MT5 Broker. Every broker has different rules and regulation. when you going for demo. just change the different settings and try it I have used fixed lot size if you want you can change it. As per your wish.                          
FREE
The Squat is a function of the range of a given price bar and the volume, or TIC volume, that occurs while that range is being created. The basic idea is that high volume and little price movement indicate substantial support or resistance. The idea behind the approach to this indicator is to first look for likely Fibonacci support and resistance and then see if Squat manifests when that point is reached. The indicator determines one of the high probability patterns of DiNapoli. It does not re
TradingX Hotkeys
Johannes Stephanus Lombard
Inputs Available Lotsizes Partial Close % You can change lotsizes as you require On an open chart click once to select chart to be able to use hotkeys on specific chart. All Pairs can be used with this expert We created this expert to be able to still trade C300 with a 0.06 Lotsize If you enter a 0.6 lot and close 0.90% you can trade with 0.06 Lot Keys to be used: B -Buy S -Sell C -Close Profitable D -Breakeven (Note if stoploss is set it won't break even) P -Partial close
Session Control
Vitalii Zakharuk
Session Control session indicator. Depending on from which continent the trading activity takes place in a certain period, the entire daily routine is divided into several trading sessions. Due to the fact that at each separate time interval exchange and banking platforms from different parts of the world are connected to the trading process, and the Forex market operates around the clock. There are 4 main trading sessions: Pacific. European. American. Asian. This indicator allows you t
RSImaxmin
Carlos Andrés Moya Erazo
4.5 (10)
The indicator shows when there are overprice and divergences on the RSI. In addition, it has configurable alerts, dynamic overprice levels and a special “RSI cleaner” function. The indicator that automatically calculates the premium rates! RSImaxmin is an indicator based on the Relative Strength Index (RSI) oscillator that effectively identifies changes in price trends as it reflects the relative strength of bullish movements compared to bearish movements. It is widely used by traders to measur
该产品的买家也购买
TrendMaestro5
Stefano Frisetti
note: this indicator is for METATRADER4, if you want the version for METATRADER5 this is the link:  https://www.mql5.com/it/market/product/108106 TRENDMAESTRO recognizes a new TREND in the bud, he never makes mistakes. The certainty of identifying a new TREND is priceless. DESCRIPTION TRENDMAESTRO identifies a new TREND in the bud, this indicator examines the volatility, volumes and momentum to identify the moment in which there is an explosion of one or more of these data and therefore the mome
VTrende Pro
Andrii Diachenko
5 (1)
VTrende Pro - MTF indicator for trend trading with a display panel for MT5 *** Videos can be translated into any language using subtitles (video language - Russian) Although the signals of the VTrende Pro indicator can be used as signals of a full-fledged trading system, it is recommended to use them in conjunction with the Bill Williams TS. VTrende Pro is an extended version of the VTrende indicator. Difference between Pro version and VTrende: - Time zones - Signal V - signal 1-2 waves
IVISTscalp5
Vadym Zhukovskyi
5 (3)
我们向您介绍iVISTscalp5指标,它不仅独特,而且在交易操作中也非常有效。该指标基于时间数据,是多年金融市场经验和深入分析的结果。iVISTscalp5指标是手动交易的优秀工具。便利性、简单性和可视化 - 所有的复杂性都隐藏在内部。我们将iVISTscalp5指标的设置和使用简化到了最大程度。该指标适用于MT5终端中您所拥有的所有金融工具。 操作时间为UTC+3的早上4点到晚上8点。 iVISTscalp5指标菜单(见截图1): History - 计算行情的周数 dT_min - 选择时间间隔的时间(分钟) TFline - 绘制水平成交量(时间帧) BARSline - 绘制水平成交量(条数) TFtrend1 - 绘制日线通道(时间帧) BARStrend1 - 绘制日线通道(条数) TFtrend2 - 绘制周线通道(时间帧) BARStrend2 - 绘制周线通道(条数) ALERT_TIMER - 设置闹钟 ALERT - 开启/关闭闹钟 Save - 开启/关闭将时间记录到文本文件。 图表上的红色和蓝色旗帜表示时间(VIST智能剃须系统的信号)。卖出信号为红旗,买入
Weis Wave with Alert MT5
Trade The Volume Waves Single Member P.C.
4.93 (15)
Rental/Lifetime Package Options and Privileges  * For optimum results the yearly or lifetime package is suggested due to live training ! Rent Monthly Six Months   Yearly/Lifetime Weis Wave with Speed with Alert+Speed Index x x x Manual  x x x Quick Set up Video x x x Blog x x x Lifetime Updates x x x Setup and Training Material x x Free Rectangle Break Alert Tool      x Discord Access Channel "The SI traders" x 2-hour live methodology training x How to trade with it:    http://
RAD Real Acummulation and Distribution
Jose Alejandro Jacome Jimenez
RAD CRITICAL LEVES RAD indicator tracks “Relevant Volume” in real time, identifying accumulation and distribution processes, projecting them in the chart as SUPPORT or RESISTANCE zones. Natural   support   and resistance levels are generated by Volume Accumulation and Distribution processes. As these processes evolve, levels at which the relevant volume in the market place is positioned, become difficult areas to cross upwards or downwards. By using this information, traders can identify very s
Big Player Range
Thalles Nascimento De Carvalho
5 (2)
欢迎使用"BigPlayerRange"指标,这是一款技术分析工具,旨在识别市场中金融机构关注的重要区域。该指标提供了对大型市场参与者表现出相当活跃和关注的价格范围的精确分析。 主要特点: 1. 机构兴趣区域映射: "BigPlayerRange" 准确地突出显示金融机构表现出强烈活动的图表区域。这些点具有战略重要性,提供了对可能市场走势的见解。 2. 投影作为退出参考:除了识别关注区域,该指标还使用投影作为两个不同阶段可能退出的参考。这些投影帮助投资者基于未来可能的价格方向规划策略。 3. 返回到识别范围时的回撤概率: "BigPlayerRange" 的一个独特功能是当价格返回到关注范围时计算回撤概率。这有助于评估潜在的趋势反转。 如何使用 "BigPlayerRange": - 辨识关注区域:使用该指标辨识金融机构活动较多的区域。这些点可能对于预测重大波动至关重要。 - 投影作为退出参考:在计划市场退出时,使用投影作为参考。这些投影提供在关闭仓位时可能价格方向的见解。 - 评估回撤概率:在价格返回到已识别范围时注意回撤的概率。这有助
Tatino Super Signals is Non Repaint Indicator for Binary Option trading and Forex trading. Recommendations: Timeframe: All timeframes. For best results we recommend using it on M1, M5 and M15 timeframes. Currency pairs: All Pairs Account type: All Type Broker time: Any Brokers : Alls Binary Trading : Expired 1 Candle Buffer Buy=1, Sell=0, Entry Next Candle Recommended Forex trading stop loss : 15 pips Recommended  Forex tradingTake profit levels : 15 pips Specifications: Does not repaint  
Smooth price for Monarch
Konstantin Gruzdev
5 (1)
The Smooth Price technical indicator is used for plotting a smoothed line as close to the price of the financial instrument as possible, and serves to eliminate its noise components. The indicator is part of the Monarch trading system, but here it is presented as an independent technical analysis tool. The indicator is based on the cluster digital filter , which, unlike the ClusterSMA , is applied directly to the price time series. Smooth Price does not redraw (except the very last, zero bar) an
ZigZag de Suavizador
Cesar Juan Flores Navarro
Teniendo una entrada de precios suavizados, los cuales son procesador por un ZigZag en tiempo real, dando como resultado un suavizador ajustado a un ZigZag. Con valores de entrada (periodo) mayores se vuelve un poco lenta en M1,, Ideal para H1, H4, D1 Trabaja bien con otros suavizadores, ya que su intersección es ideal Al iniciar empiza con mayor precisión desde el momento de activación, siendo el historial (anterior) de referencia ----------------------------------------------------------------
Recommended TimeFrame >= H1. 100% Non Repainted at any moment.  Use it carefully, only with Trend Direction. Trading Usage: 2 Variants: as Range System or as BreakOut System (Both Only With Trend Direction)::: (Always use StopLoss for minimise Risk); [1] as Range System: (Recommended) in UP TREND:  - BUY in Blue Line , then if price goes down by 50 points (on H1) open Second BUY.   Close in any Profit you wish: TrailingStop(45 points) or Close when Price touches upper Gold Line. in DOWN TR
Super Suavizador
Cesar Juan Flores Navarro
Indicador en MQL5 que obtiene el promedio de 10 EMAS que son alineadas y procesadas según Fibonacci luego el promedio es suavizado"  Se ingresa un número de 2 a N que multiplica los EMA-Fibonacci y por consiguiente aumenta los fibonacci, resultando un promedio.   Se ingresa un número que suaviza los EMA-Fibonacci. Considerando los números 1/1 seria la suavización minima. Considerando los números 3/5 seria la suavización media. Considerando los números 10/30 seria la suavización alta.....etc
Entry Pro
Bartlomiej Tadeusz Tomaja
Entry Pro Indicator is a powerful multi-functional trading tool designed to increase your market entry accuracy. It combines the power of several key market trend indicators, including ATR Trailing Stop and both fast and slow EMA, to provide comprehensive market insight. It offers easy-to-interpret market entry signals represented by colored arrows. Also, it's fully customizable, allowing you to adjust ATR and EMA periods to suit your trading strategy. Trend filters and alerts can be toggled on
WanaScalper
Isaac Wanasolo
1 (1)
A scalping indicator based on mathematical patterns, which on average gives signals with relatively small SL, and also occasionally helps to catch big moves in the markets (more information in the video) This indicator has three main types of notifications: The first type warns of a possible/upcoming signal on the next bar The second type indicates the presence of a ready signal to enter the market/open a position The third type is for SL and TP levels - you will be notified every time price r
Классификатор силы тренда. Показания на истории не меняет. Изменяется классификация только незакрытого бара. По идее подобен полной системе ASCTrend, сигнальный модуль которой, точнее его аппроксимация в несколько "урезанном" виде, есть в свободном доступе, а также в терминале как сигнальный индикатор SilverTrend . Точной копией системы ASCTrend не является. Работает на всех инструментах и всех временных диапазонах. Индикатор использует несколько некоррелируемых между собой алгоритмов для класси
Pendiente de Precio
Cesar Juan Flores Navarro
Indicador en base a la pendiente de la linea de precio, dibuja una línea de color cuando sube a base de los precios que previamente has sido procesados o linealizados, y cuando baja la pendiente la linea linealizada toma otro color. En este caso se a considerado 6 lineas de diferentes procesos desde pendientes largas hacia las cortas, observándose que cuando coincidan las pendientes se produce un máximo o mínimo, lo que a simple vista nos permitirá hacer una COMPRA O VENTA.
Индикатор Coefficient Of Determination (COD) представляет собой значение коэффициента детерминации или квадрат коэффициента корреляции между зависимой переменной — ценой и объясняющей переменной — тиковым объемом. Что это дает нам на практике? COD отлично распознает кульминацию трендовых движений, что позволяет подбирать оптимальные точки и ловить развороты рынка. Как использовать индикатор: Наиболее популярная торговая стратегия строится совместно с трендовым индикатором Moving Average (MA), пе
Fibonacci Multiple 12
Cesar Juan Flores Navarro
Fibonacci Múltiple 12, utiliza la serie fibonacci plasmado en el indicador fibonacci, aumentadolo 12 veces según su secuencia. El indicador fibonacci normalmente muestra una vez, el presente indicador se mostrara 12 veces empezando el numero que le indique siguiendo la secuencia. Se puede utilizar para ver la tendencia en periodos cortos y largos, de minutos a meses, solo aumentado el numero MULTIPLICA.
Linea Horizontal Inteligente
Cesar Juan Flores Navarro
En base a cálculos matemáticos de determino una linea Horizontal que cruza a todas las señales de trading, mostrando los máximos y mínimos. La linea horizontal parte en dos las subidas y bajadas de las señales de trading, de tan manera que es fácil identificar los máximos y mínimos, y es inteligente por que es sensible a las subidas y bajadas, afín de no quedarse en un solo lado por siempre, trabaja excelentemente con otros indicadores suavizadores ya que les garantiza que en un intervalo de tie
Spike Detector
Tete Adate Adjete
this indicator is a Spike detector indicator, it is specially designed to trade Boom 1000, Boom 500, Crash 1000 and Crash 500 We recommend using it on Deriv Boom and Crash indices only Its setting is intuitive, familiar, easy to use it has notification functions; audible notifications and push notifications. this tool is simple to use, easy to handle This update is based on different strategies for spikes
Limitless MT5
Dmitriy Kashevich
Limitless MT5 is a universal indicator suitable for every beginner and experienced trader. works on all currency pairs, cryptocurrencies, raw stocks Limitless MT5 - already configured and does not require additional configuration And now the main thing Why Limitless MT5? 1 complete lack of redrawing 2 two years of testing by the best specialists in trading 3 the accuracy of correct signals exceeds 80% 4 performed well in trading during news releases Trading rules 1 buy signa
Escalera Inteligente
Cesar Juan Flores Navarro
Indicador en MQL5, recibe la información del precio SUAVIZADO, lo procesa anulando los picos inteligentemente, y el resultado lo envía al desarrollo de la escalera que iniciara y subirá o bajara según el peldaño o INTERVALO ingresado Ingreso PERIODO = 50 (variar segun uso) Ingreso MULTIPLICA AL PERIODO = 1 (variar segun uso) Segun la configuración la escalera puede pegarse o separarse de los precios,, Se aplica toda la linea de tiempo, y a todas las divisas, etc.  
Fibonacci Suavizado
Cesar Juan Flores Navarro
Indicador en MQL5, que obtiene el promedio de 10 EMAS, que son alineadas según Fibonacci, obteniendo un promedio, que sera suavizado.  Se puede ingresar un numero desde 2 a N, que multiplica a los EMA-Fibonacci. Funciona en cualquier criptomoneda, etc. etc... pudiendo calcular el futuro segun la tendencia de las EMAS. Funciona excelentemente en tramos largos, determinando exactamente el mejor inicio/salida. El precio inicial por apertura sera por un periodo de tiempo, luego aumentará.
Seconds Charts
Aleksandr Goryachev
Micro  ******************* Секундные графики MT5 ********************** Более точного инструмента для входа в сделку вы не найдёте. Входные параметры: Timeframe, sek - период построения графика, секунды Displayed bars - отображаемые бары Step of price levels, pp, 0-off - шаг отрисовки ценовых уровней, пункты Scale points per bar, 0-off - масштаб в пунктах на бар Show lines - отображение текущих уровней Show comment - отображение комментария Standard color scheme - стандартная цветовая сх
QuantXSTocks Trading Range Indicator for MT5: INSTRUCTIONS TO USE OUR INDICATOR:- User needs to take trade on Arrow or after an Arrow CandleStick, You can achieve up-to 35-125 pips target by this Indicator. Best Timeframes for Stocks and Indices are M30 and H1: AMAZON M30 (50 pips) TESLA M30 (50 pips) APPLE M30 (50 pips) ADOBE M30 (50 pips) NASDAQ100 H1 (125 pips) The above are the approximate amount of pips you can achieve by this Indicator, Green arrow appears to be buy arrow while the Red a
Trend and Signals MT5  indicator scans  30 trading Instruments (Forex, Metals and Indices).     It uses special algorithm on the  current market   based on   Pure Price Action   and display the overall trend and signal on the dashboard. When signals are produced the indicator sends alert and notification. Strategy for Signals This indicator uses the daily timeframe to determine the direction of the trend. The hourly timeframe is used to identify possible entries. Main trend and is determined by
Cycles Forecast
Pooriya Alirezaee
This indicator is based on a mathematical formula and an ANN combined, designed to make a model(using previous prices) of the most recent market condition (any chart*) in order to use the model as a forecasting tool. *This indicator can operate on any chart/timeframe, but it's suggested you use multiple timeframes for each trade because this method relies solely on the time factor, you can not use this indicator to predict price volatility, but if it's fit correctly it will show you when the nex
Robos
Namu Makwembo
Big promotion on the Robos, Get yours now Robos Indicator The   ROBOS   indicator is a multi timeframe oscillator that targets the   overbought   and   oversold  regions of a price chart, a signal is indicated by the two lines crossing, compatible with all tradable instruments Latest Release The latest release is the version 4.0 #What's new in version 4.0 ? Features Extreme oversold and overbought levels ROBOS version  4.0  comes with cool new feature , the ability to target on
OrderFlowWay
Jean Jacques Huve Ribeiro
Indicator tested for 7 years with excellent results when used correctly An order flow tracking indicator when used at support and residence points simply shows the direction of the Big Players, validating good opportunities seek optimal risk-adjusted returns on their investments. Use when Flow line crossing at signal line after candle closed , works with absolutely everything
BC Scalper Aroow
Tete Adate Adjete
This indicator is based on the crossing of two Moving Average with the RSI It is intended for scalpers Specially designed for Boom and Crash syhtetic indices from Binary.com/Deriv.com It is easy to use and intuitive. We recommend its use on M1 and is equipped with three types of notification Email alert Sound notification Push notification these parameters can be activated and deactivated.
筛选:
无评论
回复评论