• 概述
  • 评论
  • 评论

Symbol Changer Inside Frame

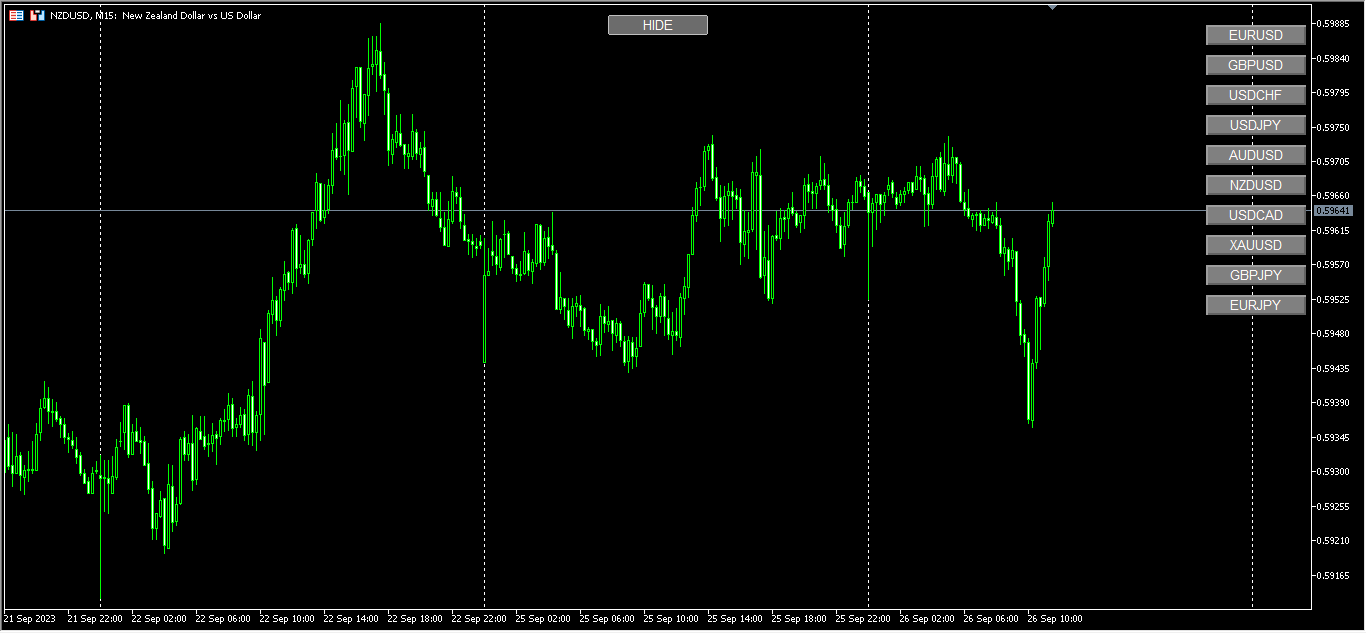
The Symbol Changer Indicator is a powerful tool designed to enhance your trading experience by providing quick access to switch between different financial

Instruments on your MetaTrader 5 platform. 

Quickly switch symbols and Show/Hide Buttons.

A clean and intuitive graphical interface ensures that traders of all experience levels can use this indicator with ease.

推荐产品
Aussenstab Markttechnik
Alexander Josef Zeidler
This indicator shows external bars ("Aussenstäbe") in the chart in candle form. The colors of the candles can be set individually. Also different colors for bearish and bullish bars are possible. In addition, the color of the wicks or outlines is also adjustable. Outside bars are mentioned e.g. by Michael Voigt in the book "Das große Buch der Markttechnik". All other candles are inner bars.
Save your time . Select area and the trend line will draw automatically . Draw a support and resistance line for the selected range with two mouse clicks .  If you need to, you can also draw a line for support and resistance based on separate areas. The resistance trend line is drawn based on the first and last highs inside the selected area; The support trend line is drawn based on first and last lows inside the selected area;
Volume by price
Zhongquan Liang
成交量在交易中扮演着至关重要的角色,它是衡量市场活跃度和投资者情绪的关键指标。以下是成交量对交易的几个重要作用: 确认趋势 :道氏理论强调了成交量在确定市场趋势中的重要性。较大的成交量通常表明市场多空双方的分歧较大,而较小的成交量则可能意味着市场对当前价格的认同度较高。 捕捉主力动作 :通过一段时间的成交量分析,可以捕捉到主力资金的动向。一天的成交量可能会被操纵,但长期的成交量更能真实反映市场主力的行为。 预测价格变动 :成交量的变化往往先于价格变动。例如,价格上涨时伴随着成交量的增加,可能预示着后市将继续上涨;相反,如果价格上涨但成交量减少,则可能意味着上涨动力不足。 衡量市场活跃度 :成交量的大小可以直接反映市场的活跃程度。高成交量表明市场活跃,低成交量则可能意味着市场冷淡。 供需关系的体现 :成交量是市场供需关系的直接表现。供不应求时,成交量会放大;供过于求时,成交量会萎缩。 辅助技术分析 :在技术分析中,成交量与价格、时间和空间一起构成了分析的四大要素。成交量的分析可以帮助投资者更准确地判断市场趋势和转折点。 决策依据 :有经验的投资者会将成交量作为进出市场的依据之一。例如,带
β指标,也被称为贝塔指标,作为对冲机构参考指标之一。 允许您测量个别资产(如货币和大宗商品)相对于市场组合、跨货币对、美元指数和股票指数的相对风险。通过了解您的资产与市场基准相比的表现,您将更清晰地了解您的投资风险状况。 显著特点: 准确的风险评估:β指标提供了资产相对于更广泛市场的风险的精确评估,帮助您做出明智的投资选择。 多样化策略:使用该指标优化您的投资组合,探索各种资产类别的多样化机会。 适用于多货币对冲:参与多货币对冲的投资者可以将该指标视为重要参考点。 实时见解:随时了解实时数据分析,以及时做出决策。 通过将β指标融入您的交易工具箱,解锁数据和风险分析的力量。开始做出更明智的选择,减少投资组合暴露于不必要风险。 β = 1:如果β等于1,表示资产的价格波动与市场整体的波动一致,即资产的价格变化与市场一致,通常意味着资产的风险与市场相当。 β > 1:如果β大于1,表示资产的价格波动比市场整体更大,即资产的价格变化波动较大,通常意味着资产更具风险。 β < 1:如果β小于1,表示资产的价格波动比市场整体更小,即资产的价格变化波动较小,通常意味着资产相对较低风险。 β = 0:
BS Trend MA Color
Bruno Gomes Falcao Seixas
Transform your financial chart analysis with our innovative Candle Coloring Indicator. This powerful tool allows you to instantly visualize market trends based on closing prices relative to a customized average. Customized Coloring: Choose colors that best suit your analysis style. Highlight candles above the average in a vibrant color of your choice and candles below the average in another distinctive color. Adjustable Average: Tailor the indicator to your trading strategies by setting the aver
FREE
Hello This EA for send any indicator Signals (buffer) to your channel in Telegram with photo for chart also you can share your signals with your clients in your telegram please watch the photos you must have Telegram channel then make bot and give it Permission and get token (watch this video to know how do it) https://www.youtube.com/watch?v=x1bKWFOjSBE and you must download this files https://drive.google.com/file/d/1pYpnWUr4Kb4aIwdoGVD_9zSH1HWX-tt3/view?usp=sharing then unzip files the
According to trading experience: Some symbols are easy to reverse on certain days, such as Monday, or afternoon, and so on. So comparing the current price with the corresponding historical moment price is valuable. If the price coordinate system uses a logarithmic price, you will get a lot of valuable information. 1. What is this? This program can convert the symbol price and add it to your Chart. You can compare it with your major chart. The DEMO version Link: https://www.mql5.com/en/market/p
Presenting NUMERO UNO Expert Advisor for MT5 that will revolutionize the way you trade the worlds most traded currency pair EURUSD. The EA effectively harnesses the lowest spread benefit of the instrument, to its advantage. EA is build on MQL5 platform. The Strategy : The EA automatically takes the most refined low risk trades, based on Data Analysis combined with Deep Machine Learning Algorithm. Trade with lightning speeds with efficient Risk Management which is not possible by a human manua
A probability of bankruptcy
Kiyoshi Mizu Miyabi Nori
This is a tool to estimate your probability of bankruptcy. features. estimate a probability of bankruptcy (Nauzer J. Balsara) from your trade history usually, it is small print and never interfere with trades alert in large prints and color when it exceed the alert level you can set parameters(i.e. winning ratio) fixed and simulate freely *1: this value is for reference only and is not guaranteed to occur.
FREE
KT SSL Indicator MT5
KEENBASE SOFTWARE SOLUTIONS
SSL stands for Semaphore Signal Level channel. It consists of two moving averages applied to high and low, respectively, to form a price following envelope. Buy Signal: When the price closes above the higher moving average. Sell Signal: When the price closes below the lower moving average. Features It comes with a multi-timeframe scanner that scans for the new signals across all the timeframes. A straightforward personal implementation of the classic SSL effortlessly finds the trend directio
Hidden Gap by MMD MT5
Mariusz Maciej Drozdowski
Hidden Gap by MMD Hidden Gap by MMD is a unique indicator that detects hidden gaps between three consecutive candles. This observation isn't my own, but in the MMD methodology, it has its application alongside other original indicators. You can apply this indicator to the chart multiple times and set the interval from which you want to see the hidden gaps. You can show or hide these gaps as needed. For example, you can view the chart at an M5 interval and see hidden gaps from an M15 chart, etc.
The   Correlation Matrix   indicator shows the actual correlation between the selected instruments. The default setting is set to 28 currency pairs, gold, and silver, but the indicator can compare any other symbols. Interpretation of the indicator Positive correlation  (correlation is above 80 %). Negative correlation  (correlation is below -80 %). Weak or no correlation  (correlation is between -80 and 80 %). Main features The indicator shows the actual correlation between the selected ins
亲爱的外汇交易者, 我很高兴向您介绍GoldenCeres指标,这是我们过去一年交易旅程中的重要工具。我最亲密的朋友和我一直在使用这个指标成功地导航外汇市场,现在我们迫不及待地想与MQL5社区分享它。 GoldenCeres是一个直观且用户友好的指标,专为有一些外汇交易经验的交易者设计。它直接在图表上提供清晰的买入或卖出信号,简化决策过程,没有任何延迟。此外,它提供了一个推荐的TakeProfit水平,以图表上的小紫线表示。可以使用我们命名为“风险水平”的输入变量来自定义此推荐水平的准确性。 “风险水平”变量的范围从1到20。1的值表示保守策略,击中TakeProfit水平的概率很高,但奖励相对较小。10的值表明平衡的方法,有很好的机会击中TakeProfit水平并获得体面的奖励。20的值代表了一种激进的策略,击中TakeProfit水平的可能性较低,但潜在的奖励显著增大。 GoldenCeres专为XAUUSD 30分钟图表设计,尽管它可以应用于其他XAU图表。请注意,由于它针对30分钟的XAUUSD图表进行了优化,因此其在不同时间框架上的性能可能会有所不同。 我们致力于持续改进,
iVolX indicator horizontal volumes for all time periods Main settings of the indicator: VolumeSource - select data for volumes (tick or real) PeriodMinutes - selection period for rendering of volumes PeriodsNumber - number of periods to show on the chart StartDate - the start date of the calculations ClusterPoints - cluster width Color - color MaxVolColor - maximum volume color ValueArea - the value of the zone of balance ValueAreaColor - color of the balance zone MaxVolFontSize - font size Ma
50+ Candlestick Patterns, Simulated Trading Results, Top Five Performers Candle Analysis extends Candlesticks Pattern Analysis by not only identifying Patterns but also recording the Past Performance of the Patterns. What it Does:- Identifies and plots results on chart Displays Top Patterns for both Bullish and Bearish type.  Log can be printed in experts tab to see Simulated Trading results Displays All or Selected Patterns Alerts on Pattern formation More detailed information in   Blog
Correlation indicator
Hendrikus Alberto Lauricella
Correlation indicator is a trading indicator that compares price correlations on up to 8 different instruments simultaneously. This indicator is designed to be very versatile. It can be used to trade many different strategies from scalping to hedging to simple trend-following based on an average trend direction of multiple currency pairs or it can signal only when all the pairs correlate on the same side of a particular moving average. The indicator automatically applies the same moving average
This indicator detects IDRN4 and IDNR7 two powerful patterns on 28 pairs on new daily bar. IDNR4 is the acronym for "Inside Day Narrow Range 4" where "Inside Day" is a lower high and higher low than the previous bar and "Narrow Range 4" is a bar with the narrowest range out of the last 4 bars so "Narrow Range 7" out of the last 7 bars. Hence, ID/NR4 and better ID/NR7 are an objective criterion for identifying days of decreased range and volatility. Once we find an ID/NR4 or an ID/NR7 pattern, we
Hello This EA for send Orders Signals when you open or close order and send statics to your channel in Telegram with sum of profit or Loss Pips you can share your orders with your clients in your telegram please watch our video  to see how it is fast. https://www.youtube.com/watch?v=u_7twtYZhyI you must have Telegram channel then make bot and give it Permission and get token (watch this video to know how do it) https://www.youtube.com/watch?v=x1bKWFOjSBE and you must download this files h
Breakeven Price MT5
Vladimir Chiosa
5 (1)
Nowadays a lot of traders need to open more positions for the same pair, because one position is not usually the best possible position. Thus a lot of trades are accumulated, sometimes with different lot sizes, and it is not easy to calculate the breakeven price of all opened positions. For solving this issue the Breakeven Price indicator was created. Breakeven Price is an MT5 indicator which calculates real time the breakeven price of all Buy & Sell positions opened by trader or EAs. It shows r
LT Rainbow Trend
Thiago Duarte
5 (1)
Do you, like me, like to trade with the trend? Then this indicator will help you! Rainbow Trend is a trend indicator, which uses several Moving Averages on the chart. It measures different trend strenght zones for different periods: very long term, long term, mid term, short term and very short term. Each zone has its color, and it is possible to have sound alert when the prices leaves a zone and enters another. Its configuration is very simple. If you find any bug or have any suggestions, co
Maximum Minimum Candle Indicator
Carlos Daniel Vazquez Rosas
5 (3)
Maximum Minimum Candle indicator  is a basic indicator (but useful) that shows the highest and lowest candle in a period of time . The indicator shows the maximum candle and the minimum candle for a defined period of time. You can choose the number of candles that make up the period The indicator will show with color points  the maximum and minimum values. A message tells you when the price reaches the maximum or minimum. Parameters number_of_candles: It is the number of candles that will b
FREE
Currency Power Pro
Makarii Gubaydullin
Current strength of the 8 major currencies My   #1 Utility:  includes 65+ functions, including this indicator  |   Contact me  if you have any questions The indicator is displayed in a separate window, it can be moved to any place on the chart. In the input settings   you can adjust: Interface theme : dark / white; Prefix and Suffix,  if the currency pairs on your broker have it: (e.g. if Symbol is "EURUSD .pro ", please set " .pro " as a Suffix); Panel size Font size
Hello, This is an easy symbol change panel. This is a full version of Symbol1 2Changer Symbols must be active on your Market Watch list. Parameters: SymbolList - you can add more symbols with a comma(,) ratio - change the size LineNumber - you can set that how many symbols are displayed per line. button_width - modify the button size button_height - modify the button size Thank you.
Leave a review for this product, and receive another "Free" product that you choose. You can see my other products here: https://www.mql5.com/en/users/zakri/seller Harmonic Patterns Detector indicator draws harmonic patterns on chart. Harmonic patterns have a high hit-rate of around 80% and are excellent for trade entries. They are used as price reversal points. Some of them have a long history of usage and were created by famous traders like H. M. Gartley. Many harmonic patterns are included
Multi Timeframe charts
Makarii Gubaydullin
Analyze up to 3 additional charts of other timeframes , without switching the main chart. My   #1 Utility : includes 65+ functions  |   Contact me  if you have any questions The indicator opens in a  separate window: The window   can be moved   to any place on the chart (using the   [<M>]   button). The window can also be minimized to save space ( [ <^>]  button) In the window that appears, you can configure: The period   of the 1st chart (left); The period   of the 2nd chart (center); The peri
The script allows to easily watch the date and time of several cities selected by the user from more than 30 important cities all over the world. It also shows GMT, Server time and Local time. The cities on the screen are automatically sorted by the date and time. You can save your setting on the Inputs tab and use them in future. Notice: Daylight saving time is not considered.
Market Ticker Free MT5
John Louis Fernando Diamante
5 (1)
A scrolling Market Ticker that displays price changes from all symbols in the Market Watch list. Provides an easy snapshot of symbol prices, and keeps scrolling automatically while you trade and analyse the chart. Options include: - MTF, eg choose to show price changes of the daily chart, or the hourly - use the live candle or the recently completed - font and background coloring
FREE
Open time indicator 4 Major sessions. 1. Sydney is open 0h - 9h (GMT + 3) 4h - 13h (VN - GMT + 7) 2. Tokyo is open 3h - 12h (GMT + 3) 7h - 16h (VN - GMT + 7) 3. Lodon is open 10h - 19h (GMT + 3) 14h - 23h (VN - GMT + 7) 4. Newyork is open 15h - 24h (GMT + 3) 19h - 4h (VN - GMT + 7) Link download indicator KIDsEA Session Please come to my youtube for free download, please feel free for like and subscribe for my channel. 
This tool gives you several informations about your broker and the current market events. The top Infolabel shows the current spread price . You can set whether the label should be displayed or hidden. You can adjust price levels for automaticly change of background color. The lower Infolabel shows the candle timer of the current time frame. You can set whether the label should be displayed or hidden. The bordercolor change to red if: 1. you have no connection to the tradeserver 2. y
将此指标添加到图表并设置 ZigZag 的 ExtDepth 设置 当价格触及趋势线上、下或中通道时,它会立即发出警报 特征 : -启用/禁用上、下或中线的警报 - 在几秒钟内发出警报后添加暂停 - 使用图表上的按钮暂停或取消暂停趋势通道 - 通过在输入字段中添加点来添加早期警报,例如 ETH 价格是 2900.25,这里的数字 25 是“点”,所以如果您在输入字段中添加 25 以点为单位,并且如果趋势通道下线的值为 2900.25,那么您将在 2900.50 获得早期警报(从设置中增加 25 点) - 启用/禁用定向触摸,更多信息请参见屏幕截图,当价格触及底部阻力和顶部支撑时考虑定向触摸,添加此功能是为了避免来自多个警报的噪音 如果您在 1 分钟到 5 分钟图表中交易,Extdepth 的推荐设置为 55 如果您交易 1 小时到 4 小时图表,Extdepth 的推荐设置为 21 您可以根据图表上的需要调整任何其他 Extdepth,找到最佳趋势通道并暂停它并等待买入或卖出警报, 此外,您可以使用价格行为信息或蜡烛形态来验证反转。 您可以将其添加到许多
该产品的买家也购买
Atomic Analyst MT5
Issam Kassas
5 (14)
首先值得强调的是,该交易指标是非重绘、非延迟的指标,这使其成为手动和机器人交易的理想选择。 用户手册:设置、输入和策略。 Atomic Analyst是一种PA价格行动指标,利用价格的力量和动量来寻找市场上更好的机会。配备了高级过滤器,可帮助去除噪音和假信号,并提高交易潜力。使用多层复杂的指标,Atomic Analyst扫描图表,并将复杂的数学计算转化为任何初学者都能理解并用来做出一致交易决策的简单信号和颜色。 “Atomic Analyst”是专为新手和经验丰富的交易者量身定制的综合交易解决方案。它将高级指标和一流功能融合为一体的交易策略,使其成为所有类型交易者的多功能选择。 日内交易和剥头皮策略:专为快速准确的日内交易和短期交易而设计。 日内和摆动交易策略:可用作追求价格大幅波动的日内和摆动交易者的可靠工具。 多货币和市场:凭借其可靠的精度,在不同的工具和市场上运作。 多个时间框架:可在多个时间框架上使用,性能良好。 稳定性:所有指标均不重绘、不重绘和不滞后,确保可靠的信号。 信号清晰度:提供箭头信号,用于清晰的入场和出场点。 实时警报:通过交易入场、SL和TP警报通知交
首先,值得强调的是,这个交易系统是一个非重绘、非重画和非滞后的指标,这使得它非常适合手动和机器人交易。 在线课程,手册和下载预设。 “智能趋势交易系统 MT5”是专为新手和经验丰富的交易者量身定制的综合交易解决方案。它结合了超过 10 个优质指标,具有 7 多个强大的交易策略,使其成为适用于各种市场条件的多功能选择。 趋势跟随策略:提供精确的入场和止损管理,以有效地跟随趋势。 反转策略:识别潜在的趋势反转,使交易者能够利用区域市场的机会。 剃头策略:专为快速准确的日内交易和短期交易而设计。 稳定性:所有指标都不会重绘、不会重画和不会滞后,确保可靠的信号。 定制:支持自定义策略,以满足个人交易偏好。超过 7 种策略和组合可帮助您找到最佳策略。 信号清晰度:提供箭头信号,以指示清晰的入场和退出点。 实时警报:通过交易进出警报使交易者保持了解。 深入分析:提供更高时间框架的趋势分析和实时交易监控。 自适应颜色编码:利用蜡烛颜色编码来显示成交量、趋势和反转蜡烛信号。通过蜡烛颜色分析市场方向。 “智能趋势交易系统 MT5”赋予交易者必要的工具,以便在各种市场条件下做出明智和战略性的交易决策。无论
Quantum Trend Sniper
Bogdan Ion Puscasu
5 (41)
介绍   量子趋势狙击指标 ,突破性的 MQL5 指标,正在改变您识别和交易趋势反转的方式!由拥有超过13年交易经验的资深交易员团队开发,     量子趋势狙击指标   旨在通过其创新的方式以极高的准确度识别趋势反转,将您的交易之旅推向新的高度。 ***购买量子趋势狙击指标,即可免费获得量子突破指标!*** 当量子突破指标识别出趋势反转时,它会向您发出警报和信号箭头,并建议您三个止盈水平。 它既适合新手交易者,也适合专业交易者。 量子 EA 通道:       点击这里 MT4版本:       点击这里 建议: 时间范围: 所有时间范围。为了获得最佳结果,我们建议在 M15、M30 和 H1 时间范围内使用它。 货币对:欧元兑美元、英镑兑美元、澳元兑美元、欧元兑英镑、, EURAUD,  XAUUSD 账户类型:ECN、Raw 或 Razor,点差极低 经纪时间:任意 经纪商:IC Markets、Pepperstone with Raw 和 Razor 的点差最低 建议止损:50 点 建议止盈水平:20 点、50 点和
Trend Screener Pro MT5
STE S.S.COMPANY
4.88 (64)
使用趋势筛选指标释放趋势交易的力量:由模糊逻辑和多货币系统提供支持的终极趋势交易解决方案! 使用趋势筛选器(由模糊逻辑提供支持的革命性趋势指标)提升您的趋势交易。 它是一个强大的趋势跟踪指标,结合了超过 13 种高级工具和功能以及 3 种交易策略,使其成为使您的 Metatrader 成为趋势分析器的多功能选择。 限时优惠:趋势筛选指标终身仅需 50 美元。 ( 原价 125$ ) (优惠延长) 体验趋势筛选器 100% 无需重新绘制的准确性,确保您的交易决策不受过去价格变化的影响。 释放多时间框架和多货币功能的多功能性,使您能够以无与伦比的信心在外汇、商品、加密货币和指数领域进行交易。 利用 Trend Screener 的综合策略套件增强您的交易: - 趋势跟踪策略和趋势延续策略 :趋势筛选器的趋势跟踪策略提供清晰的趋势延续信号,让您有效捕捉趋势走势并管理风险。 - 反转策略和早期入场点策略 :趋势筛选器的反转策略可检测市场方向的潜在变化,使您能够预测趋势反转并利用疲弱的市场趋势。通过早期入场点,您可以在潜在的趋势变化之前定位自己 获取可观的利润。 - 倒卖策略: 趋势筛选器的倒卖
首先,值得强调的是,这个交易工具是非重绘、非重画和非滞后的指标,非常适合专业交易。 在线课程,用户手册和演示。 智能价格行动概念指标是一个非常强大的工具,既适用于新手,也适用于经验丰富的交易者。它将超过20个有用的指标合并到一个指标中,结合了高级交易思想,如内圈交易员分析和智能资金概念交易策略。该指标侧重于智能资金概念,提供有关大型机构交易方式的见解,帮助预测它们的动向。 它在流动性分析方面尤其擅长,有助于理解机构的交易方式。它擅长预测市场趋势,并仔细分析价格波动。通过将您的交易与机构策略对齐,您可以更准确地预测市场走向。该指标多才多艺,擅长分析市场结构,识别重要的订单区块,并识别各种模式。 它擅长识别BOS和CHoCH等模式,理解动量的转变,并突出显示供需强劲的关键区域。它还擅长发现强大的不平衡,并分析价格创造更高高点或更低低点的模式。如果您使用斐波那契回撤工具,该指标可以满足您的需求。它还可以识别相等的高点和低点,分析不同的时间框架,并通过仪表板显示数据。 对于使用更高级策略的交易者,该指标提供了工具,如公平价值差指标和优惠和折扣区域的识别。它特别关注高时间框架订单
TPSpro RFI Levels MT5
Roman Podpora
5 (8)
Reversal First Impulse levels (RFI)      INSTRUCTIONS        RUS       -       ENG              R ecommended to use with an indicator   -   TREND PRO -  Version MT4                 A key element in trading is zones or levels from which decisions to buy or sell a trading instrument are made. Despite attempts by major players to conceal their presence in the market, they inevitably leave traces. Our task was to learn how to identify these traces and interpret them correctly. Main functions:: Di
Gold Stuff mt5
Vasiliy Strukov
4.89 (175)
Gold Stuff mt5 是专为黄金设计的趋势指标,也可用于任何金融工具。 该指标不会重绘,也不会滞后。 推荐时间框架 H1。 购买后立即联系我以获得设置和个人奖励!   你可以在我的个人资料中找到它。   重要! 购买后立即与我联系,以获得说明和奖金!   您可以免费收到我们的强力支持和趋势扫描指标的副本,请私信。大部头书!   设置 绘制箭头 - 打开关闭。 在图表上绘制箭头。 警报 - 打开关闭声音警报。 电子邮件通知 - 打开关闭。 电子邮件通知。 Puch-notification - 打开关闭。 推送通知。 接下来,调整色域。 Gold Stuff mt5 是专为黄金设计的趋势指标,也可用于任何金融工具。 该指标不会重绘,也不会滞后。 推荐时间框架 H1。 购买后立即联系我以获得设置和个人奖励!   设置 绘制箭头 - 打开关闭。 在图表上绘制箭头。 警报 - 打开关闭声音警报。 电子邮件通知 - 打开关闭。 电子邮件通知。 Puch-notification - 打开关闭。 推送通知。 接下来,调整色域。
FxaccurateLS
Shiv Raj Kumawat
WHY IS OUR FXACCCURATE LS MT5 THE PROFITABLE ? PROTECT YOUR CAPITAL WITH RISK MANAGEMENT Gives entry, stop and target levels from time to time. It finds Trading opportunities by analyzing what the price is doing during established trends. POWERFUL INDICATOR FOR A RELIABLE STRATEGIES We have made these indicators with a lot of years of hard work. It is made at a very advanced level. Established trends provide dozens of trading opportunities, but most trend indicators completely ignore them!
FX Volume MT5
Daniel Stein
4.94 (17)
通过 mql5 和 Telegram 上 的 " 晨间简报 "获取每日市场更新,包括详细信息和屏幕截图 ! 外汇交易量(FX Volume)是第一个也是唯一一个从经纪商角度真正洞察市场情绪的交易量指标。 直接在您的图表上看到这些信息是真正改变游戏规则和突破性的交易解决方案。 受益于独特的市场数据洞察,如 比率(Ratios )显示货币多头和空头头寸的比率(百分比 比率变化 显示所选时间段内的多头比率及其百分比变化 总交易量 显示货币的总交易量(多头和空头),以手为单位 多头 交易量显示货币所有多头头寸的交易量 空头 交易量显示所有货币空头头寸的交易量 净多头 显示净多头交易量,即所有多头头寸减去所有空头头寸(以手为单位)。 净多头百分比 显示货币净多头交易量的变化 请阅读我们的基本教程 -> "如何使用外汇交易量进行交易 " 获取更多信息,如常见问题、交易技巧和教程视频,请访问我们的 外汇交易量公共信息频道 请 安装并运行 SI Connect 以建立与我们数据中心的持续连接 背景信息 我们都知道,外汇是一个分散的市场。这就是为什么我们必须打破常规思维,开发一个独
XQ Indicator MetaTrader 5
Marzena Maria Szmit
5 (1)
Step into the realm of Forex trading with confidence and precision using XQ, a cutting-edge Forex indicator designed to elevate your trading game to unprecedented heights. Whether you're a seasoned trader or just stepping into the world of currency exchange, XQ Forex Indicator empowers you with the insights and signals needed to make informed trading decisions. The signal conditions are a combination of three indicators, and XQ Forex Indicator only display  medium and long-term trends . The ind
PZ Divergence Trading MT5
PZ TRADING SLU
3.75 (4)
棘手的发现和频率稀缺是最可靠的交易方案之一。该指标使用您喜欢的振荡器自动查找并扫描常规和隐藏的发散。 [ 安装指南 | 更新指南 | 故障排除 | 常见问题 | 所有产品 ] 容易交易 发现常规和隐藏的分歧 支持许多知名的振荡器 根据突破实现交易信号 显示适当的止损和获利水平 可配置的振荡器参数 可自定义的颜色和尺寸 按条形过滤大小差异 实现绩效统计 它实现了电子邮件/声音/视觉警报 为了提供广阔的市场前景,可以使用不同的振荡器在同一张图表中多次加载该指标,而不会产生干扰。该指标支持以下振荡器: RSI CCI MACD OSMA 随机 动量 很棒的振荡器 加速器振荡器 威廉姆斯百分比范围 相对活力指数 由于差异可能会扩大很多,尤其是在外汇市场中,因此该指标产生了转折:它在等待交易突破之前等待donchian突破确认差异。最终结果是带有非常可靠的交易信号的重新粉刷指示器。 输入参数 幅度:用于寻找差异的之字形周期 振荡器-选择要加载到图表的振荡器。 突破期-交易信号的突破期,以柱为单位。 发散类型-启用或禁用发散类型:隐藏,常规或两者。 最小散度单位为条形-最
ICT, SMC, SMART MONEY CONCEPTS, SMART MONEY, Smart Money Concept, Support and Resistance, Trend Analysis, Price Action, Market Structure, Order Blocks, BOS/CHoCH,   Breaker Blocks ,  Momentum Shift,   Supply&Demand Zone/Order Blocks , Strong Imbalance,   HH/LL/HL/LH,    Fair Value Gap, FVG,  Premium  &   Discount   Zones, Fibonacci Retracement, OTE, Buy Side Liquidity, Sell Side Liquidity, BSL/SSL Taken, Equal Highs & Lows, MTF Dashboard, Multiple Time Frame, BigBar, HTF OB, HTF Market Structure
Golden Spikes Detector
Batsirayi L Marango
3 (2)
Golden Spikes Detector This indicator is based on an advanced strategy primarily for trading spikes on Boom and Crash Indices. Complex algorithms were implemented to detect high probability entries only. It alerts on potential Buy and Sell entries. To trade spikes on the Deriv or Binary broker, only take Buy Boom and Sell Cash alerts. It was optimised to be loaded on 5-minute timeframe although multiple timeframe analysis is done in the background. Features ·             Desktop pop up and sound
Quantum Heiken Ashi PRO MT5
Bogdan Ion Puscasu
4.5 (8)
Quantum Heiken Ashi PRO 简介 Heiken Ashi 蜡烛旨在提供对市场趋势的清晰洞察,以其过滤噪音和消除虚假信号的能力而闻名。告别令人困惑的价格波动,迎接更流畅、更可靠的图表表示。 Quantum Heiken Ashi PRO 的真正独特之处在于其创新公式,它将传统烛台数据转换为易于阅读的彩色条。红色和绿色条分别优雅地突出了看跌和看涨趋势,让您能够以非凡的精度发现潜在的进入和退出点。 量子 EA 通道:       点击这里 MT4版本:       点击这里 这一卓越的指标具有以下几个关键优势: 增强清晰度:通过平滑价格波动,Heiken Ashi 金条可以更清晰地反映市场趋势,使您更容易识别有利的交易机会。 减少噪音:告别经常导致错误信号的不稳定价格变动。 Quantum Heiken Ashi 指标可过滤噪音,使您能够做出更明智的交易决策 无缝集成:Heiken Ashi 指标专为 MetaTrader 开发,可无缝集成到您的交易平台中。它用户友好、高度可定制,并且与您的其他交易指标和过滤器兼容 无论您是寻求新优势的经验丰富的交易者,
RelicusRoad Pro MT5
Relicus LLC
4.82 (22)
现在$ 147(更新后增加到$ 499) - 无限帐户(PC或Mac) RelicusRoad 用户手册 + 培训视频 + 访问 Private Discord Group + VIP 身份 一种看待市场的新方式 RelicusRoad 是世界上最强大的外汇、期货、加密货币、股票和指数交易指标,为交易者提供保持盈利所需的所有信息和工具。我们提供技术分析和交易计划,帮助每一位交易者取得成功,从初学者到高级。它是一个关键的交易指标,可以提供足够的信息来预测未来的市场。我们相信一个完整的解决方案,而不是图表上几个没有意义的不同指标。这是一个多合一指标,显示无与伦比且非常准确的信号、箭头 + 价格行为信息。 RelicusRoad 基于强大的人工智能,提供缺失的信息和工具来教育您并使您成为交易专家,成为成功的交易者。 几乎所有技术指标都滞后,这意味着它们只能报告已经发生的事情。因此,他们只确认您过去可以看到的价格已经在哪里。我们相信领先指标可以预测未来价格,而无需重新绘制,也不要过度依赖可能改变并导致重新绘制的滞后指标。如果您根据滞后指标进行交易并建立头寸,您就知道您已
AW Trend Predictor MT5
AW Trading Software Limited
4.78 (58)
一个系统中趋势和故障水平的组合。先进的指标算法过滤市场噪音,确定趋势、进入点以及可能的退出水平。指标信号记录在统计模块中,您可以选择最合适的工具,显示信号历史的有效性。该指标计算获利和止损标记。 手册和说明 ->   这里 / MT4 版本 ->   这里 如何使用指标进行交易: 使用趋势预测器进行交易只需三个简单的步骤: 第 1 步 - 开仓 收到买入信号,成功率超过 70% 第 2 步 - 确定止损 通过相反的信号选择中继线 第 3 步 - 定义止盈策略 策略一:达到 TP1 时平仓 策略 2:达到 TP1 时平仓 50%,达到 TP2 时平仓剩余 50% 策略三:在趋势反转时平仓 好处: 从不重绘结果,信号严格位于蜡烛收盘时 它可以在顾问中使用 获利和止损标记 对交易策略或独立策略的重要补充 市场噪音过滤算法 适用于任何工具 统计模块: 为了更好地选择配对,请使用内置的统计计算。 计算交易 - 给出统计数据的信号总数 成功评级 - 达到 TP1 的信号百分比,或反转那些正获利的信号时的百分比 TakeProfit1 Hit - 达到 TP1 的信号百分比 TakeProfit2
Advanced Supply Demand MT5
Bernhard Schweigert
4.53 (15)
任何新手或专业交易者的最佳解决方案! 该指标是一款独特、高质量、且价格合理的交易工具,因为我们已经整合了许多专有功能和新公式。 依据此更新,您将能够显示双重时间帧区域。 您不仅可以显示一个较高的时间帧,还可以同时显示图表时间帧,加上更高的时间帧:显示嵌套时区。 供需双方所有交易者都会喜欢它。 :) 重要信息披露 高级供需的最大潜力,请访问 https://www.mql5.com/zh/blogs/post/720245   想象您的交易如何得以改善,是因为您能够精准定位入场或目标位吗? 构建于新的底层算法,它可以更轻松地识别出买卖双方之间的潜在失衡。 这是因为它以图形方式展示供需最强劲区域,及其过去的表现(显示旧区域)。 这些功能旨在帮助您更轻松地发现最佳入场区域和价位。 现在您可以针对您的交易品种和时间帧来优化和编辑区域强度! 高级供需指标适用于所有产品和时间帧。 它是一个新的公式,非常新的功能是两个区域强度函数可由用户输入进行调整! 这在交易中是一大优势。 当您学习如何使用专有功能,例如带有价格游离最小 X 因子的区域强度时,您能够判断该区域强劲与否。 供需区域用作警报触发器
TPA True Price Action indicator reveals the true price action of the market makers through 100% non-repainting signals strictly at the close of a candle! TPA shows entries and re-entries, every time the bulls are definitely stronger than the bears and vice versa. Not to confuse with red/green candles. The shift of power gets confirmed at the earliest stage and is ONE exit strategy of several. There are available now two free parts of the TPA User Guide for our customers. The first "The Basics"
Dragon Multi Indicator MT5
Mansour Babasafary
5 (4)
3 Indicators in 1 indicator Strategy based on price action Made specifically for the best forex currency pairs Can be used in the best time frame of the market at a very reasonable price This indicator is basically 3 different indicatos . But we have combined these 3 indicators in 1 indicator so that you can use 3 indicators at the lowest price. All three strategies are based on price action. But based on different trends. Long term, medium term and short term Attributes : No repaintin
Italo Trend Indicator MT5
Italo Santana Gomes
4.89 (9)
BUY INDICATOR AND GET EA FOR FREE AS A BONUS + SOME OTHER GIFTS! ITALO TREND INDICATOR  is the best trend indicator on the market, the Indicator works on all time-frames and assets, indicator built after 7 years of experience on forex and many other markets. You know many trend indicators around the internet are not complete, does not help, and it's difficult to trade, but the Italo Trend Indicator is different , the Italo Trend Indicator shows the signal to buy or sell, to confirm the signal t
Matrix Arrow Indicator MT5
Juvenille Emperor Limited
5 (14)
矩阵箭头指标 MT5   是一种独特的 10 合 1 趋势,遵循   100% 非重绘多时间框架指标 ,可用于所有符号/工具: 外汇 、 商品 、 加密货币 、 指数 、 股票 。 Matrix Arrow Indicator MT5 将在其早期阶段确定当前趋势,从多达 10 个标准指标中收集信息和数据,它们是: 平均定向运动指数 (ADX) 商品渠道指数 (CCI) 经典 Heiken Ashi 蜡烛 移动平均线 移动平均收敛散度 (MACD) 相对活力指数 (RVI) 相对强弱指数 (RSI) 抛物线SAR 随机振荡器 威廉姆斯的百分比范围 当所有指标给出有效的买入或卖出信号时,相应的箭头将打印在图表上,在下一根蜡烛/柱线开盘时,指示强劲的上升趋势/下降趋势。用户可以选择使用哪些指标,并可以单独调整每个指标的参数。 Matrix Arrow Indicator MT5 仅从选定的指标中收集信息,并仅根据其数据打印箭头。   Matrix Arrow Indicator MT5   还可以为所有新信号发送终端、推送通知或电子邮件警报。无论您是黄牛、日内交易者还是波段交易者, Mat
Easy Buy Sell Signal Alert
Franck Martin
4.86 (7)
Easy BySell is a market indicator for opening and closing positions. It becomes easy to track market entries with the alerts. It indicates the trend reversal points when a price reaches extreme values and the most favorable time to enter the market. My other products  with its advanced technology   :   https://www.mql5.com/en/users/incepline/seller The algorithm is based on ATR and Stochastic Oscillator indicators. You can modify these two parameters as you wish to adapt the settings to t
IX Power MT5
Daniel Stein
5 (3)
IX Power 终于将 FX Power 的无与伦比的精确性带到了非外汇交易符号中。 它能准确判断您喜爱的指数、股票、商品、ETF 甚至加密货币的短期、中期和长期趋势强度。 您可以 分析 终端提供的 一切 。试试吧,体验一下您在交易时如何把握 时机 。 IX Power 主要功能 100% 精确的非重绘计算结果 - 适用于您终端中的所有交易符号 下拉式选择预配置以及可单独配置的强度分析周期 通过电子邮件、消息和手机通知的无数种通知选项 可访问的 EA 请求缓冲区 可自定义计算限制,以获得更好的性能 为希望查看更多信息的用户提供特殊的多实例设置 无尽的图形设置,让您在每个图表中都能找到最喜欢的颜色 采用 Windows 11 和 macOS 风格的圆角新面板设计 神奇的移动指标面板,可在子窗口和主图表之间无缝移动 适用于高分辨率 QHD、UHD 和 4K 显示器,并针对平板电脑和触摸屏进行了优化 IX Power 参数 最重要的参数不言自明,但我们很快会在另一篇文章中为您提供所有 IX Power 参数的完整说明。 使用别名 "参数可为技术交易符号
Bill Williams Advanced
Siarhei Vashchylka
5 (5)
Bill Williams Advanced is designed for automatic chart analysis using Bill Williams' "Profitunity" system. The indicator analyzes four timeframes at once. Manual (Be sure to read before purchasing) Advantages 1. Automatically analyzes the chart using the "Profitunity" system of Bill Williams. The found signals are placed in a table in the corner of the screen. 2. Equipped with a trend filter based on the Alligator indicator. Most of the system signals are recommended to be used only accordi
Legacy of Gann for MT5
Pavel Zamoshnikov
5 (5)
The indicator very accurately determines the levels of the possible end of the trend and profit fixing. The method of determining levels is based on the ideas of W.D.Gann, using an algorithm developed by his follower Kirill Borovsky. Extremely high reliability of reaching levels (according to K. Borovsky  - 80-90%) Indispensable for any trading strategy – every trader needs to determine the exit point from the market! Precisely determines targets on any timeframes and any instruments (forex, met
Dark Power MT5
Marco Solito
4.85 (60)
Dark Power  is an Indicator for intraday trading. This Indicator is based on   Trend Following  strategy, also adopting the use of an histogram to determine the right power . We can enter in good price with this Indicator, in order to follow the   strong trend   on the current instrument. The histogram is calculated based on the size of the bars and two moving averages calculated on the histogram determine the direction of the signal Key benefits Easily visible take profit/stop loss lines Int
成為突破者,隨著價格反轉,市場結構會改變利潤。 訂單突破者指示器可以識別趨勢或價格走勢何時接近枯竭並準備好逆轉。它會提醒您市場結構的變化,通常會在發生逆轉或重大回調時發生。 該指標使用專有計算來確定突破和價格動能。每當在可能的耗盡點附近形成新的高點時,指標就會繪製最後一個生成該高點的順序塊。然後,它將隨價格移動隨價格跟隨定單。然後,當價格轉向相反方向並突破該訂單塊時,它會提醒您,從而創建新的市場結構並開始趨勢或重大回調的可能逆轉。 訂單塊是在創建高/低之前的最後一個相反的彩色蠟燭,並且當價格跌破這些關鍵區域以下時,這表明趨勢可能會發生短期或長期反轉。 特徵 提醒您關鍵耗盡點的市場結構變化 價格接近耗盡水平時自動提取訂單塊 在一個方向繼續移動時,在價格後面跟踪定單,以提醒您最佳的反轉輸入 將顏色更改為純色塊,以顯示何時發生市場結構中斷。 適用於所有交易品種和時間範圍 內置集成的彈出窗口和電子郵件警報 策略和如何與定單破壞者指標進行交易 當斷路器塊發生時,您有兩個選擇。 看左邊!我們正在尋求供應/需求或支撐/阻力位嗎?市場結構轉變(逆轉)通常發生在價格重新測試舊水平或
首先值得强调的是,这个交易系统是一个不重绘、不重画和不滞后的指标,这使它非常适合专业交易。 在线课程,用户手册和演示。 “智能支撑和阻力交易系统”是专为新手和经验丰富的交易者量身定制的先进指标。它赋予交易者在外汇市场上精确和自信的能力。这个综合系统结合了7+种策略、10个指标和各种交易方法,包括日内交易策略、波段交易策略、支撑和阻力策略、蜡烛图模式策略、VWAP策略、多时间段趋势策略等。它提供箭头信号、入场和出场点、交易警报、更高时间框架的趋势分析、实时交易监控以及见解深刻的趋势和成交量蜡烛染色。通过自动支撑和阻力检测,这是一个多面手的指标,帮助交易者在不同的市场条件下做出明智的决策。 “智能支撑和阻力交易系统”是一个强大的技术分析方法,融合了一套高端和强大的指标和工具。在其核心,这个系统识别关键的支撑和阻力水平,这些水平作为潜在市场反转或延续的关键区域。该系统无缝集成了多时间框架趋势面板,增强了交易者在不同时间框架下评估当前趋势方向的能力。此外,蜡烛图模式检测器扫描价格图表以获取重要的蜡烛图模式,为潜在的市场走势提供宝贵的见解。此外,VWAP(成交量加权平均价格)的加入
ADR 警报仪表板一目了然地向您显示当前价格相对于其正常平均每日范围的交易位置。当价格超过您选择的平均范围和高于它的水平时,您将通过弹出窗口、电子邮件或推送获得即时警报,以便您可以快速跳入回调和反转。破折号旨在放置在空白图表上,只需坐在背景中并在达到水平时提醒您,因此您无需坐下来观看甚至看! 此处提供 MT4 版本: https://www.mql5.com/en/market/product/62756 新:现在还向您显示平均每周和每月范围,并提醒他们! 获取在您的图表上绘制水平的 ADR 反转指标: https://www.mql5.com/en/market/product/64477 大约 60% 的时间价格在其正常的平均每日范围 (ADR) 内交易并推高这些水平通常是价格急剧波动的指标,通常会出现回调(获利了结)走势。您可以通过交易从每日范围的顶部或底部回落到最近的支撑位或阻力位来利用这些急剧波动。 收集了超过 20 年的历史数据,以找出主要外汇对和一系列交叉盘的价格超出特定 ADR 水平的平均百分比。该数据表明价格仅在 3% 的时间内超过其 ADR 的
作者的更多信息
Title : Market Bias Indicator - Oscillator-Based Trading Tool Introduction : Discover the potential of the "Market Bias Indicator," a revolutionary oscillator-based trading tool designed for precise market analysis. If you're in search of a robust alternative to traditional bias indicators, your quest ends here. Market Bias Indicator offers unparalleled accuracy in identifying market sentiment and is your gateway to confident trading decisions. Recommended Trading Pairs : Market Bias Indicator i
Title : UT_Bot - ATR-Based Trading Indicator Introduction : Discover the power of "UT_Bot," the ultimate trading indicator that leverages the Average True Range (ATR) to provide unparalleled accuracy in your trading decisions. If you're seeking a more reliable alternative to the Super Trend indicator, look no further. UT_Bot is your key to precision trading. Key Features : ATR-Powered Precision: UT_Bot uses the ATR to deliver accurate signals that adapt to market volatility. Enhanced Trend Detec
筛选:
无评论
回复评论