Scalper Terminal X30
- 指标
- Kenan Ozkarakas
- 版本: 1.0
- 激活: 7
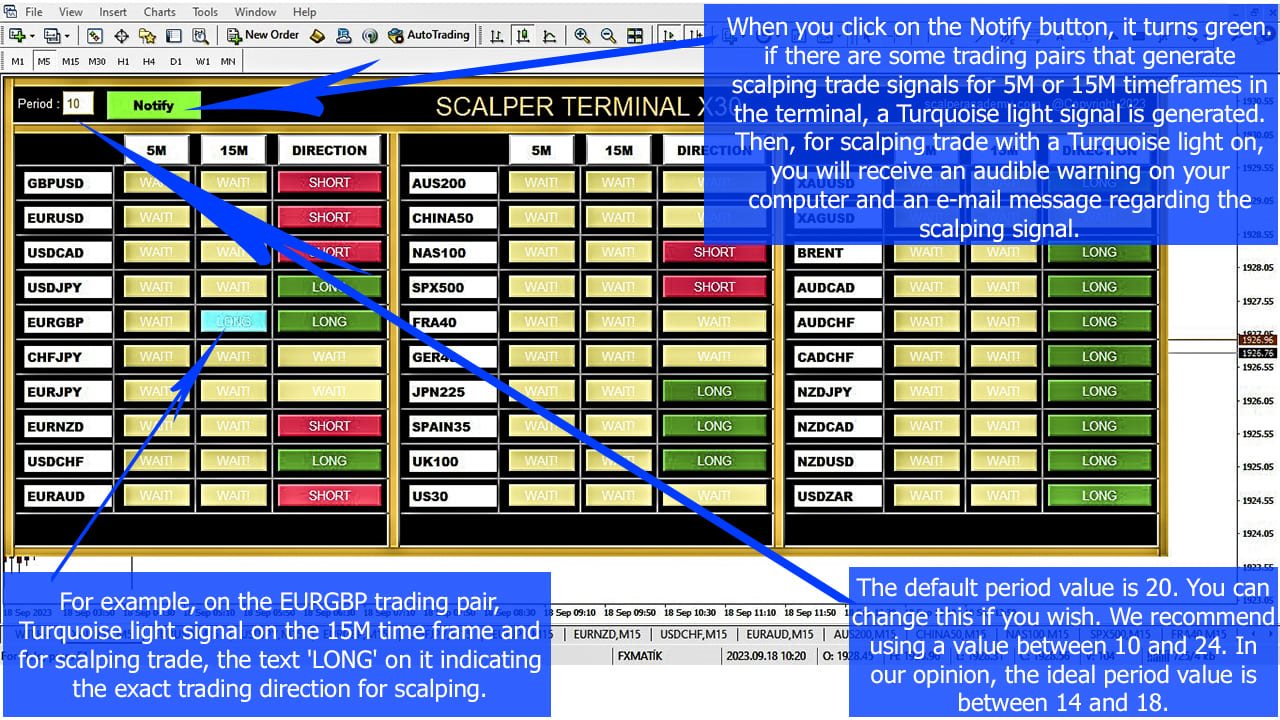
黃牛終端介面軟體是一個指標,它不從事自動買賣交易。 此指標顯示當前交易區域,當出現剝頭皮交易機會時可以進入交易。 當出現倒賣訊號時,相關交易對的右側,綠松石色燈亮起,並在其上方寫有確切的交易方向。 之後,點擊綠松石按鈕即可進入交易。 將開啟一個新分頁。 隨後,預計蠟燭收盤,這是進入倒賣交易的條件。
為了透過黃牛終端進行成功的黃牛交易;
- 請務必觀看說明部分中的影片。 像士兵一樣堅持使用黃牛終端軟體。
- 每個交易對的右側有 5M、15M 和 DIRECTION 欄。 首先,點擊“通知”按鈕並將其設為綠色。
- 您無需一直注視著螢幕。 只需等待綠松石燈訊號或 Metatrader 警報訊息聲音即可。
- 閱讀上面寫的確切操作方向(也是方向欄文字),它是綠松石色的。 在確切的交易方向上,點擊綠松石按鈕進行倒賣。
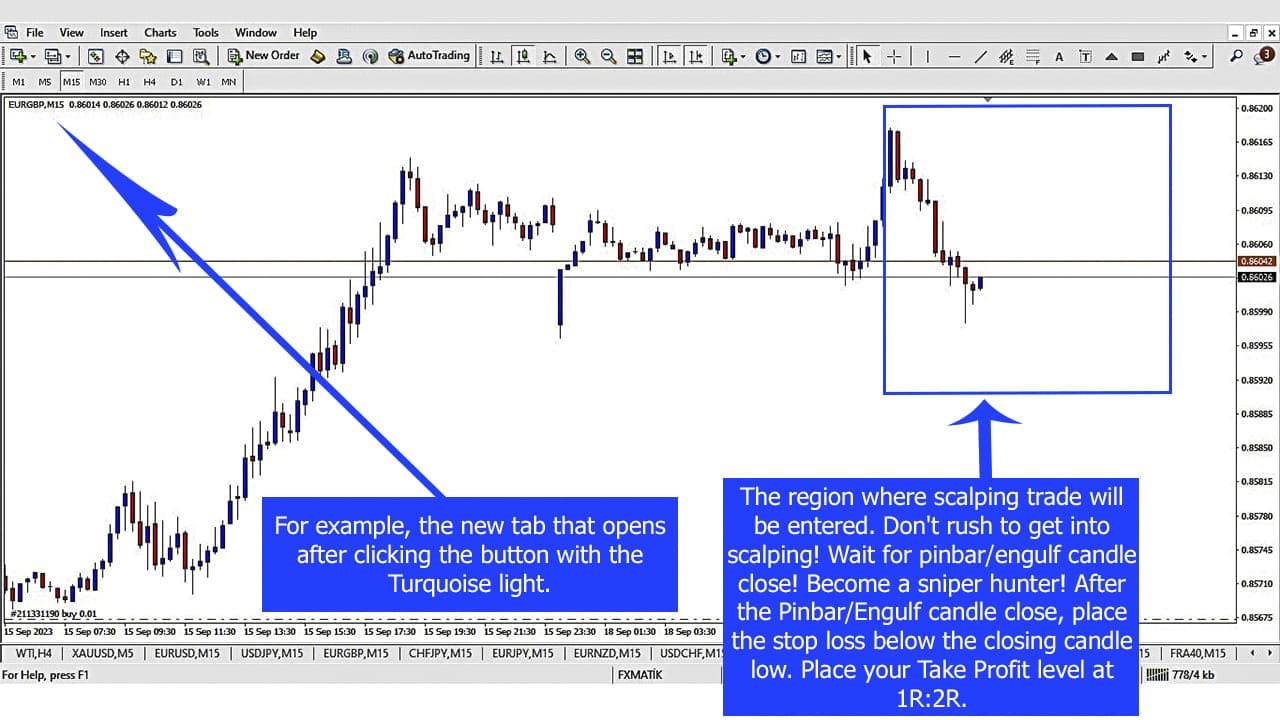
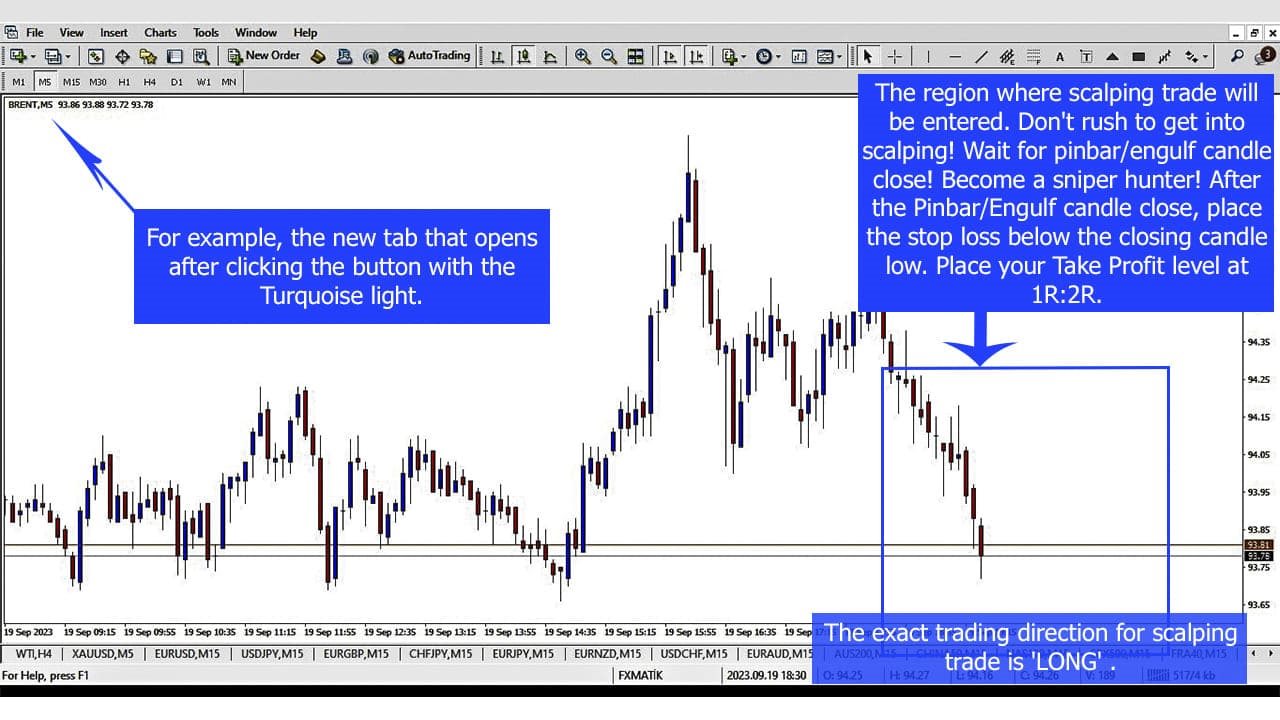
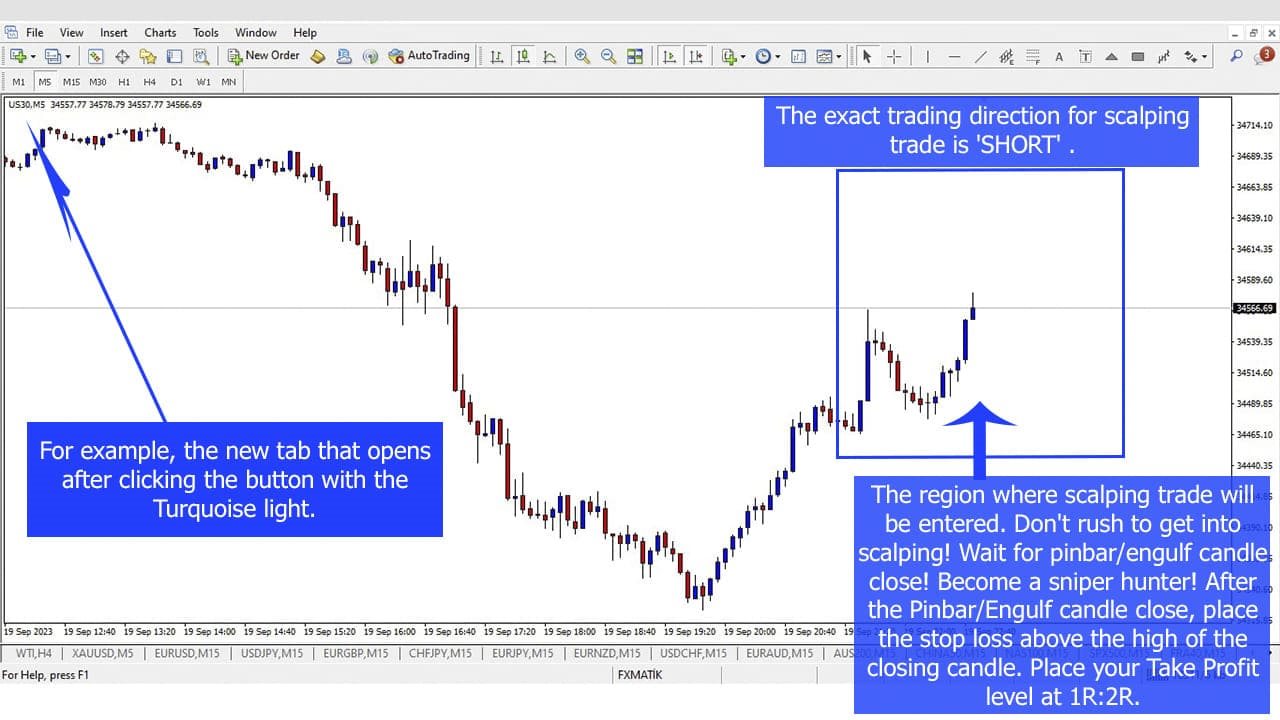
- 在為剝頭皮交易打開的新選項卡中,像獵人一樣等待 pinbar 或吞噬蠟燭關閉。
- 當 pinbar 或吞沒蠟燭收盤是建倉條件時,按照黃牛終端指示的方向建倉。
- 在與持倉入場方向相反的一側添加止損單。 (例如,如果是多頭交易,則止損單的位置是最後收盤蠟燭的最低價位。)
- 然後,將您的止盈訂單新增為 1R:2R。
- 成功的唯一條件是以相同的風險率進入所有部位,停損應為 1R,停損應為 2R。 使用額外的免費 Metatrader4 插件,例如頭寸規模計算器(例如,PSC Trader.ex4),根據您的固定風險輸入適當手數的頭寸。
- 剝頭皮終端可以在一天內產生 5-20 個剝頭皮交易訊號。 (取決於軟體左上角的周期值。我建議使用值18)
- 成為像狙擊手一樣的獵人! 要有耐心! 等待綠松石燈訊號,然後等待 pinbar/吞沒蠟燭收盤。
- 為您的所有職位保留一個 Excel 電子表格。 如果遵循 1R:2R 風險報酬規則,成功是必然的。
- 同時僅從指數組中選擇 1 對,並從外匯組同時選擇 1 對。 您不應在同一組中開啟多個奇偶校驗的交易。
- 當您在收到綠松石色光訊號的貨幣對上進行交易時,請休息 1-2 小時以進入下一筆交易。 因為連續兩次交易之間如果有時間的話會更理想。