SMC Trading Pro Tool
- 指标
- The Anh Pham
- 版本: 1.1
- 更新: 1 十月 2023
- 激活: 10
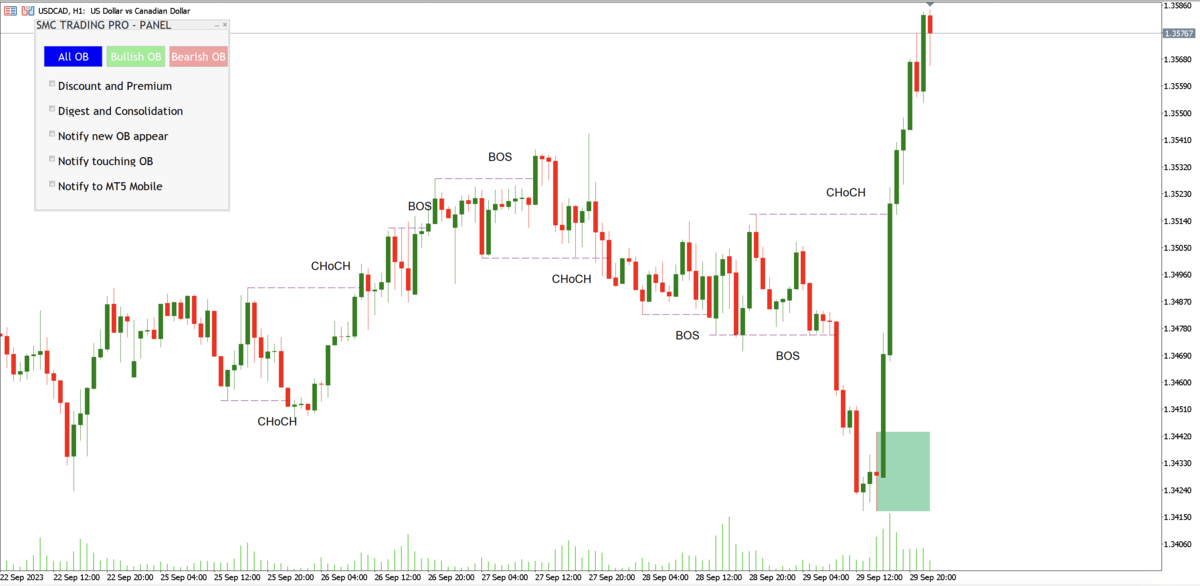
Welcome to the world of SMC (Smart Money Concepts) Trading, where we empower traders with the tools and knowledge to make smarter trading decisions. Our latest addition to our suite of trading tools is the SMC Trading Pro indicator, version 1.0.
Key Features:
-
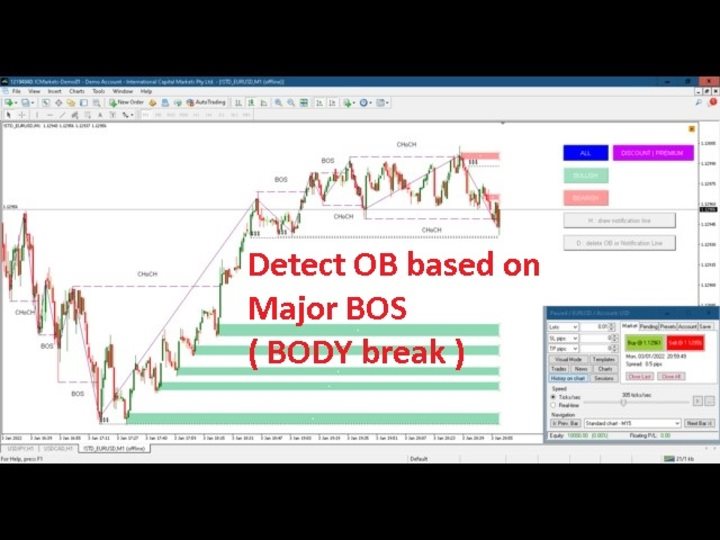
Major Market Structure Identification with BODY break.
-
Order Block must be in Major Swing ( not Small Swing ).
-
Order Block with Fair Value Gap Detection.
-
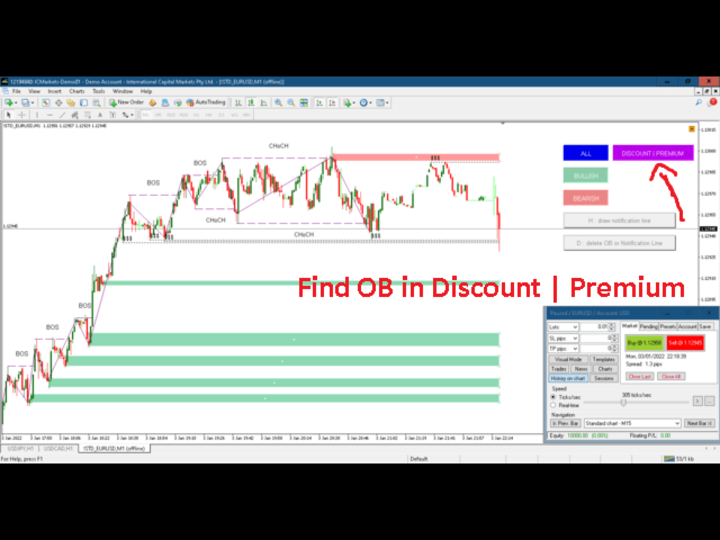
Order Block in Discount | Premium zone.
-
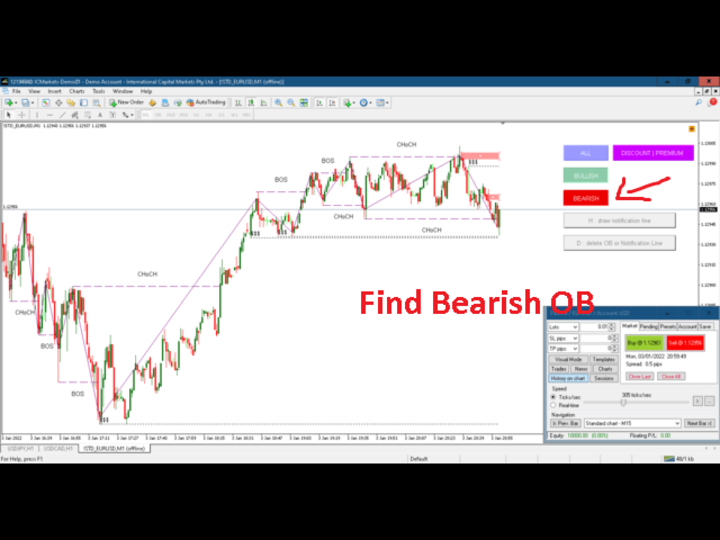
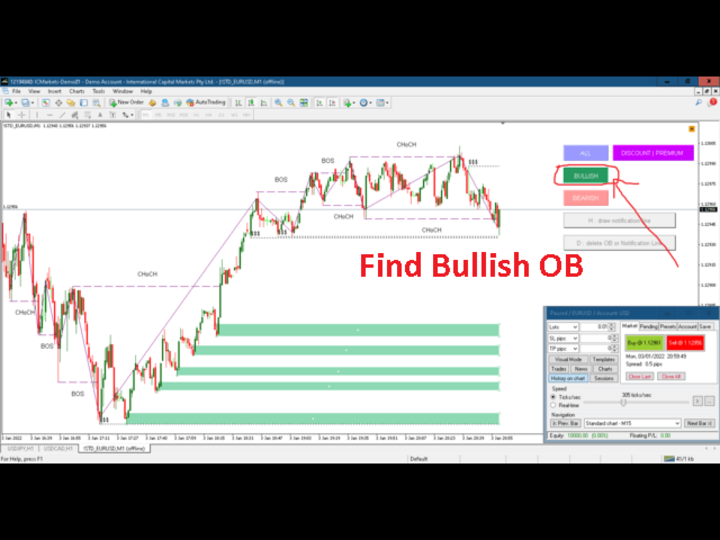
Filter for only Bullish, Bearish or All Order Blocks.
-
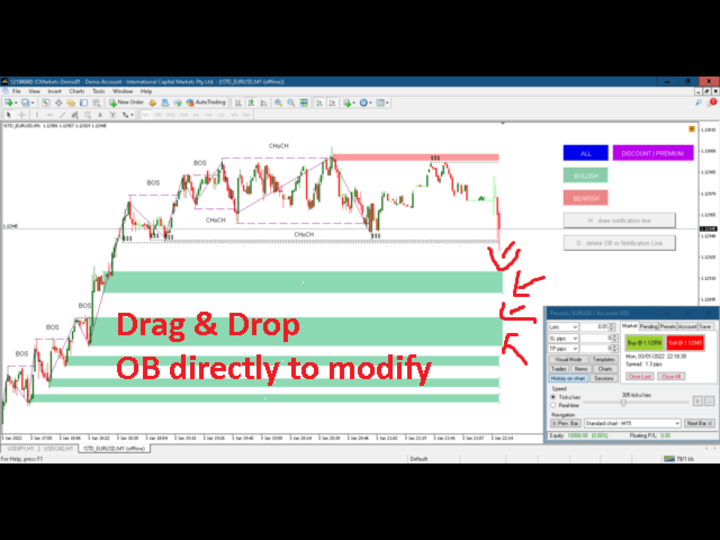
Directly Delete or Change Order Blocks with drag and drop.
-
Show Liquidity Detection Based on Double Top or Double Bottom.
-
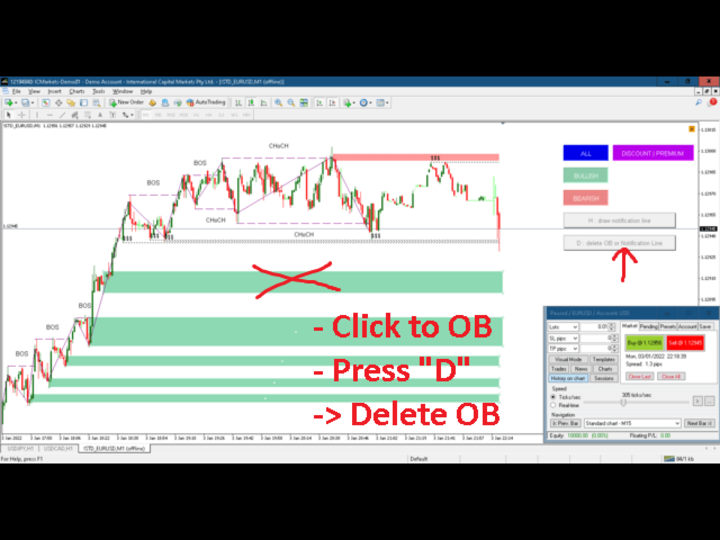
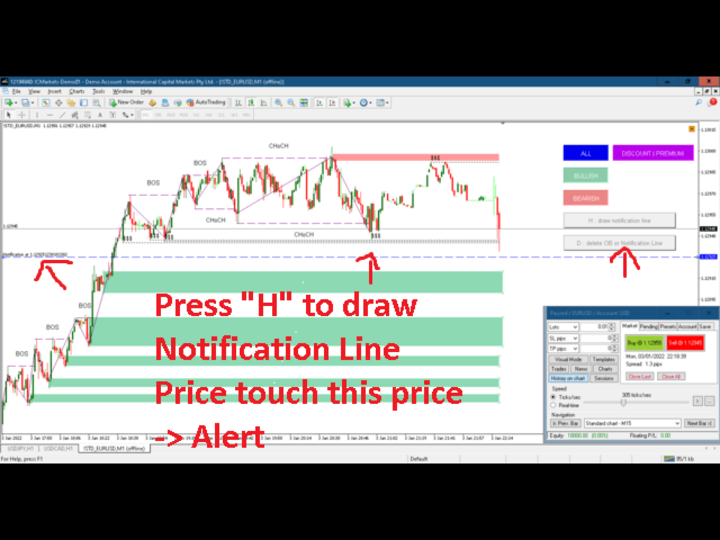
Notification Lines with Shortcut "H": Traders can draw notification lines on their screen with a simple shortcut "H", and can update or delete these lines directly.
-
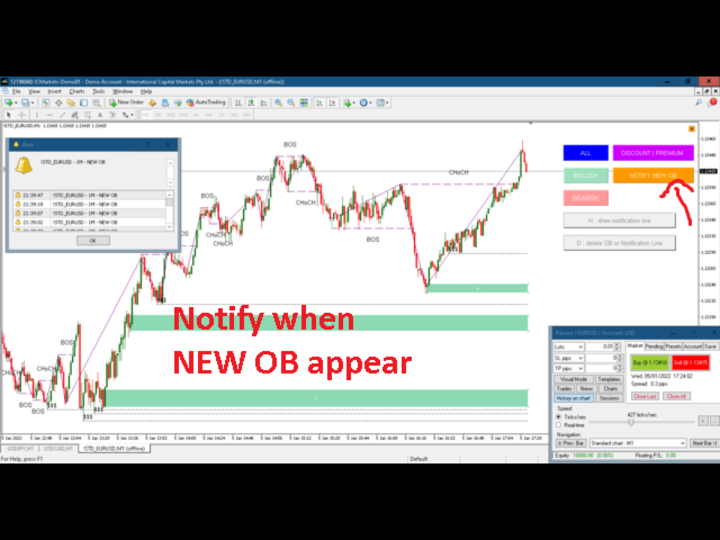
Auto notify new Order Block appear.
-
Auto notify price touching Order Block.
-
Send notification to MT4 Mobile phone ( Android & IOS ).

very good ea smc concept