Drawdown monitor Pro BR
- 指标
- Dione Da Silva Ribas
- 版本: 1.1
- 更新: 24 八月 2023
- 激活: 5
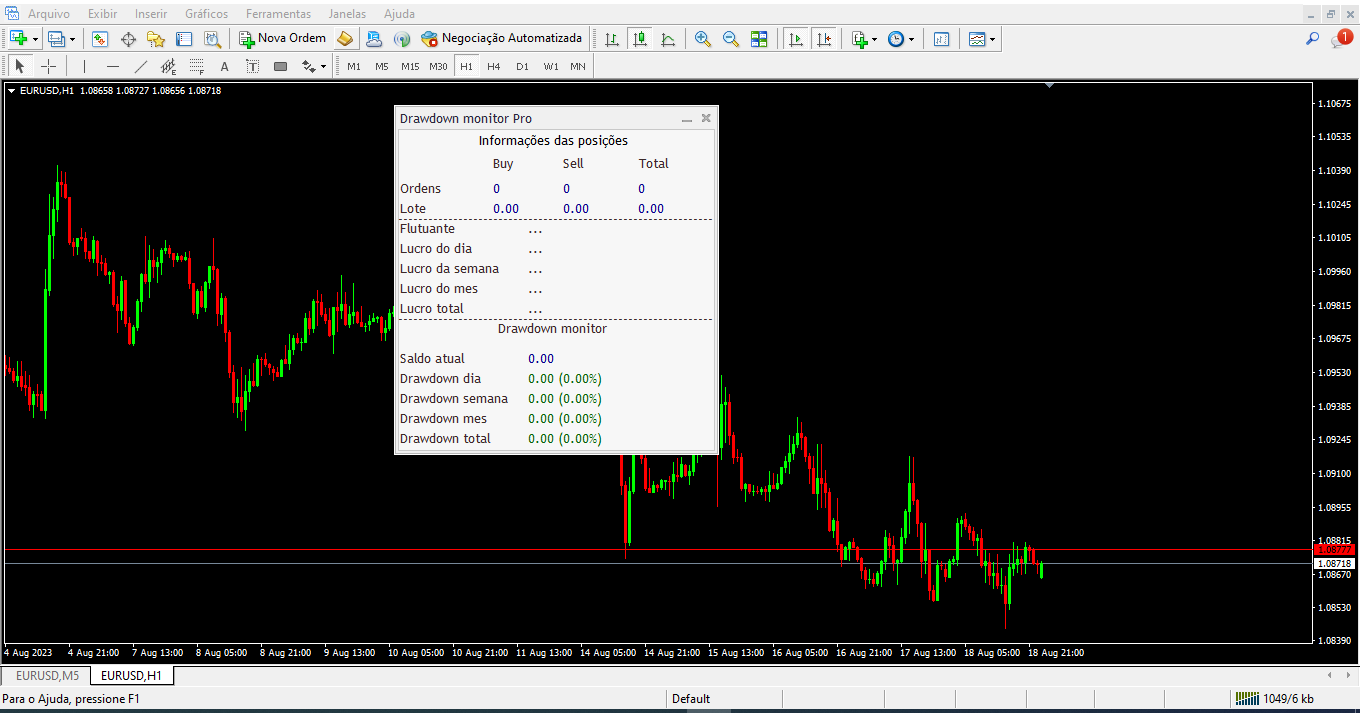
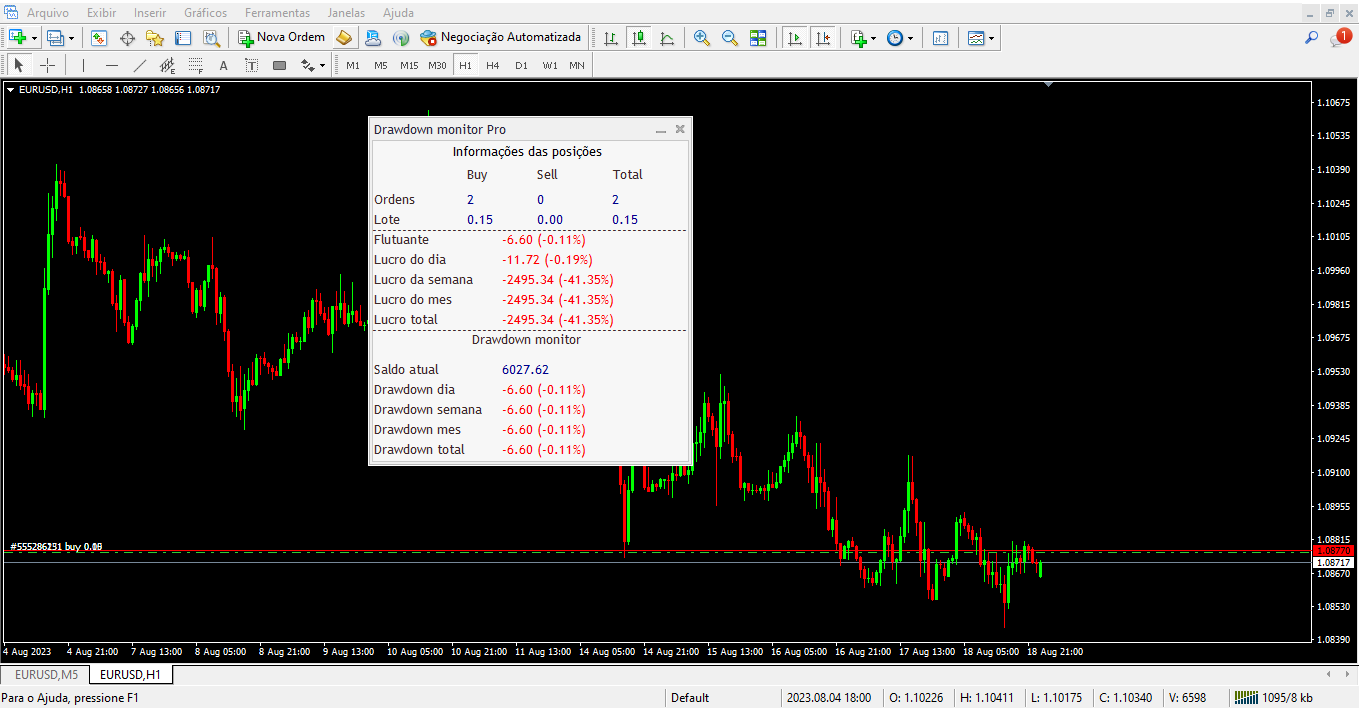
Indicador para monitoramento do rebaixamento da conta e controle automático do time frame.
Muitos robôs são lucrativos em time frames menores por um período de tempo, porem em algum momento eles quebram por pegar uma forte tendência, mas se mudar a tempo para um time frame maior muitas vezes ele se salva e volta lucrar novamente.
O grande problema é ficar observando o andamento do rebaixamento da conta, porque por mais que você observe atentamente sua conta o maior movimento vem quando você menos espera.
Quem nunca foi dormir com a conta tranquila e ao acordar se deparou com um astronômico rebaixamento, isso é mais comum do que você imagina, parece que o mercado só espera você ir dormir para se movimentar.
O Drawdown Monitor Pro veio para te ajudar nesse controle, configure e deixe ele trabalhar pra você dia e noite sem parar.
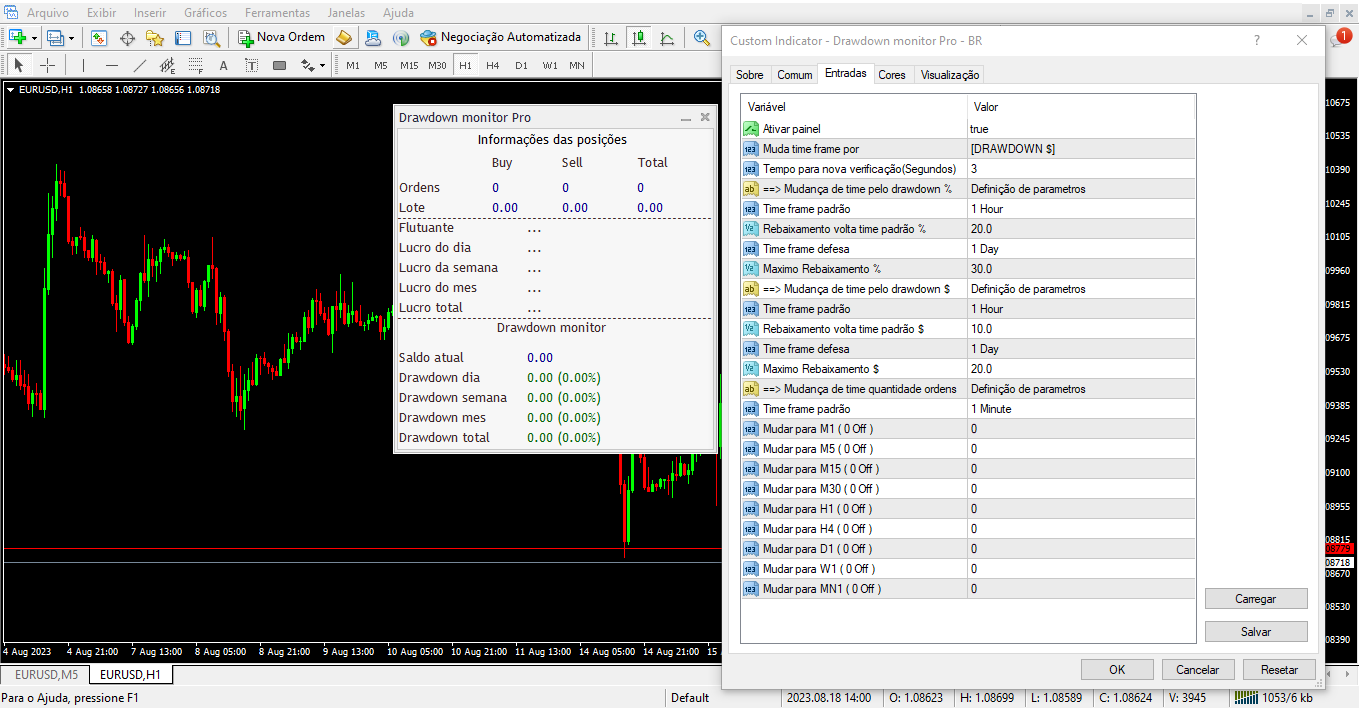
Parâmetros do indicador
-
- Ativar painel
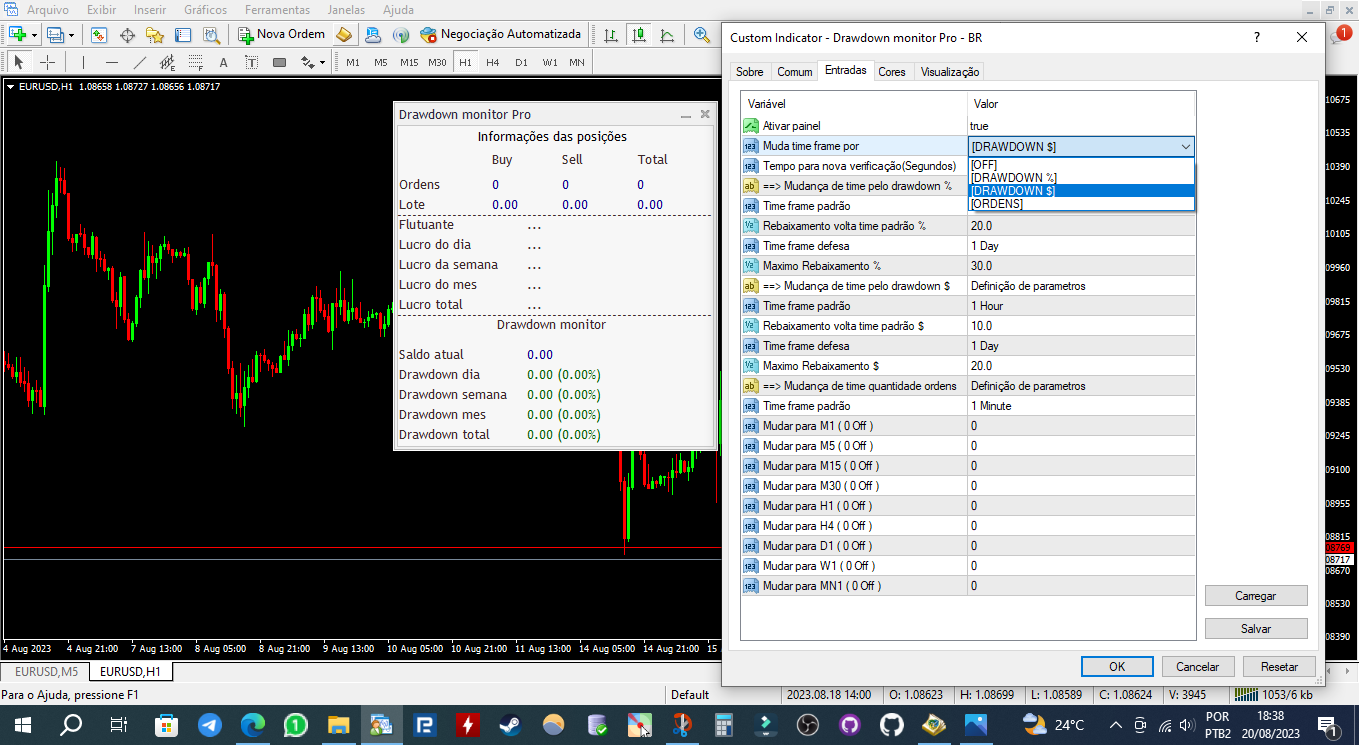
- Muda time frame por
- Tempo para nova verificação(Segundos)
- ==> Mudança de time pelo drawdown %
- Time frame padrão
- Rebaixamento volta time padrão %
- Time frame defesa
- Maximo Rebaixamento %
- ==> Mudança de time pelo drawdown $
- Time frame padrão
- Rebaixamento volta time padrão $
- Time frame defesa
- Maximo Rebaixamento $
- ==> Mudança de time quantidade ordens
- Time frame padrão
- Mudar para M1 ( 0 Off )
- Mudar para M5 ( 0 Off )
- Mudar para M15 ( 0 Off )
- Mudar para M30 ( 0 Off )
- Mudar para H1 ( 0 Off )
- Mudar para H4 ( 0 Off )
- Mudar para D1 ( 0 Off )
- Mudar para W1 ( 0 Off )
- Mudar para MN1 ( 0 Off )
Parâmetros do indicador
用户没有留下任何评级信息