SUM Market Profile Heat
- 指标
- Liu Ying Pei
- 版本: 1.0
- 激活: 10
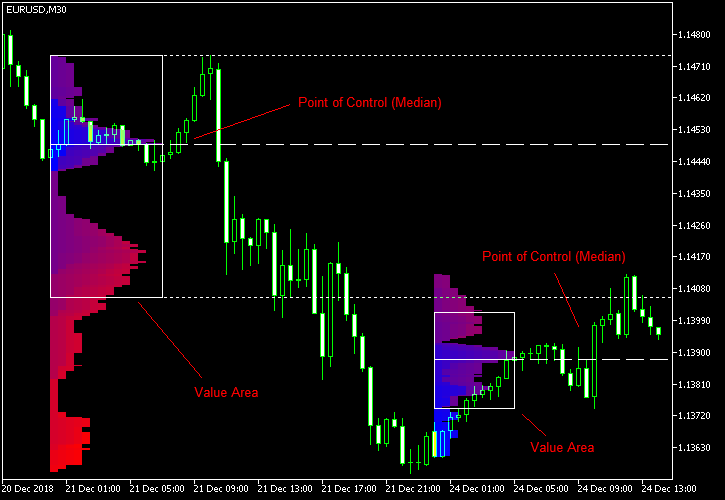
Market Profile Heat indicator — is a classic Market Profile implementation that can show the price density over time, outlining the most important price levels, value area, and control value of a given trading session.
This indicator can be attached to timeframes between M1 and D1 and will show the Market Profile for daily, weekly, monthly, or even intraday sessions. Lower timeframes offer higher precision. Higher timeframes are recommended for better visibility. It is also possible to use a free-draw rectangle session to create a custom market profile on any timeframe. Six different color schemes are available to draw the profile's blocks. Drawing profiles as a plain color histogram is also possible. Alternatively, you may choose to color the profile based on bullish/bearish bars. This indicator is based on bare price action and does not use any standard indicators.
This indicator can be attached to timeframes between M1 and D1 and will show the Market Profile for daily, weekly, monthly, or even intraday sessions. Lower timeframes offer higher precision. Higher timeframes are recommended for better visibility. It is also possible to use a free-draw rectangle session to create a custom market profile on any timeframe. Six different color schemes are available to draw the profile's blocks. Drawing profiles as a plain color histogram is also possible. Alternatively, you may choose to color the profile based on bullish/bearish bars. This indicator is based on bare price action and does not use any standard indicators.
Input parameters
Main
- Session (default = Daily) — trading session for market profile: Daily, Weekly, Monthly, Intraday, and Rectangle. For a rectangle session to get calculated, a rectangle chart object with the name starting with MPR should be added to the chart. Pressing 'r' on the keyboard will add a properly named rectangle object automatically.
- StartFromDate (default = __DATE__) — if StartFromCurrentSession is false, then the indicator will start drawing profiles from this date. It draws to the past. For example, if you set it 2018-01-20 and SessionsToCount is 2, then it will draw the profiles for 2018-01-20 and 2018-01-19.
- StartFromCurrentSession (default = true) — if true, then the indicator starts drawing from today, else — from the date given in StartFromDate.
- SessionsToCount (default = 2) — for how many trading sessions to draw the market profiles.
- SeamlessScrollingMode (default = false) — if true, the StartFromDate and StartFromCurrentSession parameters are ignored; the sessions are calculated and displayed starting from the current chart position's rightmost bar. This allows scrolling back in time indefinitely to view past sessions.
- EnableDevelopingPOC (default = false) — if true, multiple horizontal lines will be drawn to depict how the Point of Control developed through the session.
- ValueAreaPercentage (default = 70) — a percentage share of the session's TPOs to include in the Value Area.
Looks and colors
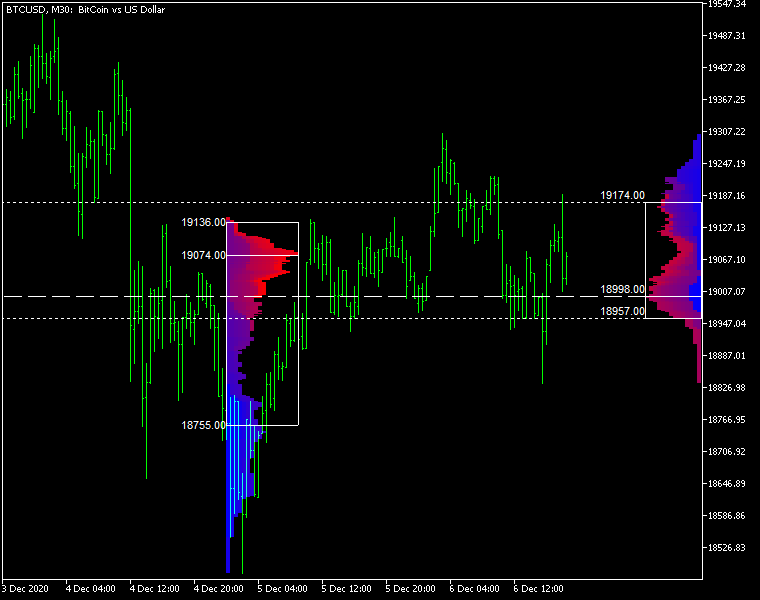
- ColorScheme (default = Blue to Red) — color scheme for profile's blocks:
- blue to red
- red to green
- green to blue
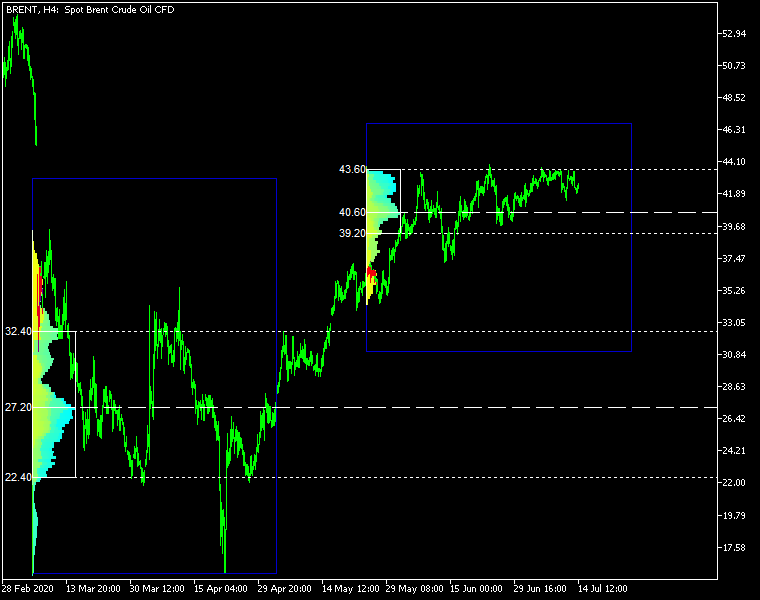
- yellow to cyan
- magenta to yellow
- cyan to magenta
- SingleColor (default = clrBlue) — if ColorScheme is set to Single Color, this color will be used to draw market profiles.
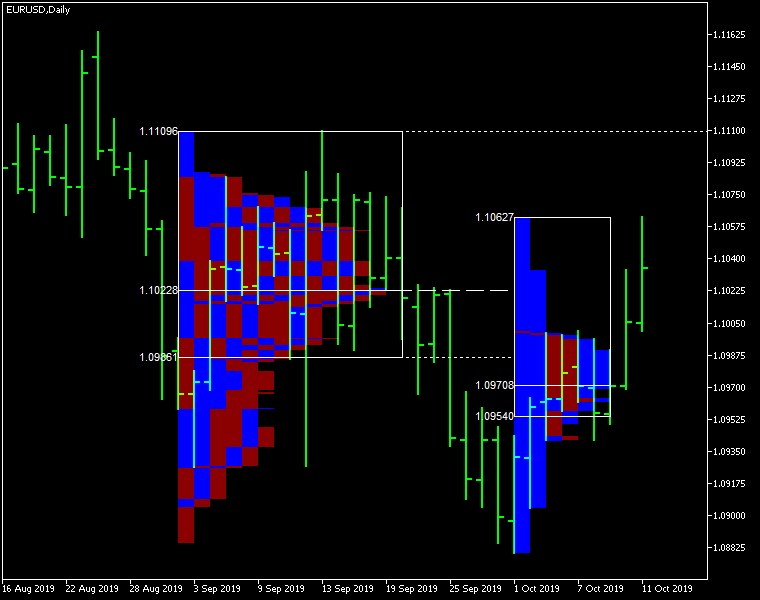
- ColorBullBear (default = false) — if true, the color of the profile blocks depends not on the age of the origin bar but on its direction.
- MedianColor (default = clrWhite) — the color of the control value (median).
- ValueAreaSidesColor (default = clrWhite) — the color of the value area side borders.
- ValueAreaHighLowColor (default = clrWhite) — the color of the value area top and bottom borders.
- MedianStyle (default = STYLE_SOLID) — the Point of Control (median) line style.
- MedianRayStyle (default = STYLE_DASH) — the Point of Control (median) ray line style.
- ValueAreaSidesStyle (default = STYLE_SOLID) — the style of the value area side borders.
- ValueAreaHighLowStyle (default = STYLE_SOLID) — the style of the value area top and bottom borders.
- ValueAreaRayHighLowStyle (default = STYLE_DOT) — the style of the value area top and bottom rays.
- MedianWidth (default = 1) — the Point of Control (median) line width.
- MedianRayWidth (default = 1) — the Point of Control (median) ray line width.
- ValueAreaSidesWidth (default = 1) — the width of the value area side borders.
- ValueAreaHighLowWidth (default = 1) — the width of the value area top and bottom borders.
- ValueAreaRayHighLowWidth (default = 1) — the width of the value area top and bottom rays.
- ShowValueAreaRays (default = None) — can be set so that the value area's High and Low price levels are projected to the right side of the chart. Can be set to previous session, current, previous and current, all previous, or all.
- ShowMedianRays (default = None) — can be set so that the median is projected to the right side of the chart. Can be set to previous session, current, previous and current, all previous, or all.
- RaysUntilIntersection (default = Stop_No_Rays) — defines the way median and value area rays will be cut off when they meet the next trading session's price range:
- Stop_No_Rays — no rays are stopped anywhere.
- Stop_All_Rays — all rays are stopped at an intersection with the price of another session.
- Stop_All_Rays_Except_Prev_Session — all rays except the previous session's rays are stopped at an intersection with the price of another session.
- Stop_Only_Previous_Session — only rays of the previous session are stopped at an intersection with the price of another session.
- HideRaysFromInvisibleSessions (default = false) — if true, rays from sessions starting behind the left edge of the screen won't be displayed until you scroll back to them.
- TimeShiftMinutes (default = 0) — time shift for the sessions, in minutes. Positive value will move the session start to the left; negative — to the right.
- ShowKeyValues (default = true) — if true, Value Area High, Value Area Low, and Point of Control are displayed on the left of the market profile.
- KeyValuesColor (default = clrWhite) — the color for Value Area High, Value Area Low, and Point of Control printout.
- KeyValuesSize (default = 8) — the font size for Value Area High, Value Area Low, and Point of Control printout.
- ShowSinglePrint (default = No) — can be set to Leftside or Rightside and will mark the single print profile — a part of the profile, which is only one TPO wide.
- SinglePrintRays (default = false) — if true, single print edges are marked with rays.
- SinglePrintColor (default = clrGold) — the color for single print marking if ShowSinglePrint isn't set to No.
- SinglePrintRayStyle (default = STYLE_SOLID) — the single print ray line style.
- SinglePrintRayWidth (default = 1) — the single print ray line width.
- ProminentMedianColor (default = clrYellow) — the color for the prominent median (PPOC) if ProminentMedianPercentage is set to 100 or less.
- ProminentMedianStyle (default = STYLE_SOLID) — the style for the prominent median (PPOC) if ProminentMedianPercentage is set to 100 or less.
- ProminentMedianWidth (default = 4) — the width for the prominent median (PPOC) if ProminentMedianPercentage is set to 100 or less.
- RightToLeft (default = false) — if true, the current session's market profile has its histogram drawn from right to left. In case Session is set to Rectangle, market profiles of all sessions are drawn right-to-left.
Performance
- PointMultiplier (default = 0) — the higher it is, the wider are the profile's price boxes and the fewer are the chart objects. You can use it to reduce the indicator's load on CPU. When the value is zero, an adaptive multiplier is used — the indicator attempts to calculate the optimal value automatically.
- ThrottleRedraw (default = 0) — a delay in seconds that will be applied before each redraw of the profiles. You can use it to reduce the indicator's load on CPU.
- DisableHistogram (default = false) — if true, no market profile histogram is drawn, but Value Area and Median are still marked. This makes indicator work extremely fast, but is less useful for thorough market analysis.
Alerts
- AlertNative (default = false) — if true, the indicator will issue the platform's native pop-up alert when some alert conditions are met.
- AlertEmail (default = false) — if true, MetaTrader's email alerts will be sent when some alert conditions are met. Email should be properly configured in MetaTrader via Tools->Options->Email
- AlertPush (default = false) — if true, MetaTrader's push notification alerts will be sent to your mobile device when some alert conditions are met. Notifications should be properly configured in MetaTrader via Tools->Options->Notifications. This alert type is not available in the cTrader version of the indicator.
- AlertArrows (default = false) — if true, MetaTrader will draw arrows on the chart when some alert conditions are met.
- AlertCheckBar (default = Previous) — controls the bar to check the alert conditions on. Current — the indicator will check the current unfinished bar; expect a lot of alerts. Previous — the indicator will check the previous (closed) bar; alerts will be delayed but more concise.
- AlertForValueArea (default = false) — if true, alerts will be issued whenever a Value Area ray (high or low) is crossed by the price.
- AlertForMedian (default = false) — if true, alerts will be issued whenever a Median ray is crossed by the price.
- AlertForSinglePrint (default = false) — if true, alerts will be issued whenever a Single Print ray is crossed by the price.
- AlertOnPriceBreak (default = false) — if true, alerts will be issued when the price breaks any of the trigger levels but then returns back behind it.
- AlertOnBarClose (default = false) — if true, alerts will be issued when the bar opens on one side the trigger level and closes on the other side of it.
- AlertOnGapCross (default = false) — if true, alerts will be issued when the trigger level appears inside a price gap between the last two bars.
- AlertArrowCodePB (default = 108) — arrow code for price break alert arrows.
- AlertArrowCodeCC (default = 110) — arrow code for candle close alert arrows.
- AlertArrowCodeGC (default = 117) — arrow code for gap crossover alert arrows.
- AlertArrowColorPB (default = clrRed) — arrow color for price break alert arrows.
- AlertArrowColorCC (default = clrBlue) — arrow color for candle close alert arrows.
- AlertArrowColorGC (default = clrYellow) — arrow color for gap crossover alert arrows.
- AlertArrowWidthPB (default = 1) — arrow width for price break alert arrows.
- AlertArrowWidthCC (default = 1) — arrow width for candle close alert arrows.
- AlertArrowWidthGC (default = 1) — arrow width for gap crossover alert arrows.
Intraday sessions
- EnableIntradaySessionN (default = true) — if true and Session is set to Intraday, then the indicator will attempt to drawn the intraday market profile #N on the chart.
- IntradaySessionNStartTime (default = "HH:MM") — start time in HH:MM format for the intraday session #N.
- IntradaySessionNEndTime (default = "HH:MM") — end time in HH:MM format for the intraday session #N.
- IntradaySessionNColorScheme (default = Blue_to_Red) — color scheme for the intraday session #N.
Miscellaneous
- SaturdaySunday (default = Normal sessions) — how to treat Saturday and Sunday sessions:
- Normal sessions — Saturday and Sunday will be treated as normal sessions with their own daily and intraday sessions.
- Ignore Saturday and Sunday — Saturday and Sunday candlesticks will be ignored.
- Append Saturday and Sunday — Saturday candlesticks will be appended to the Friday session; Sunday candlesticks will be appended to the Monday session.
- DisableAlertsOnWrongTimeframes (default = false) — if true, no pop-up alerts will appear on using Market Profile with wrong timeframe/session combination.
- ProminentMedianPercentage (default = 101) — percentage of TPOs out of all possible that should occur inside a median for it to be considered prominent (PPOC). For example, if you set it to 50%, a median will be marked as prominent if it contains at least 24 TPOs in a daily session on M30 timeframe. If it is set to 101, no prominent median is possible.