Easy ICT Price Action For MT5
- 指标
- Han Qin Lin
- 版本: 7.8
- 更新: 9 三月 2024
- 激活: 10
ICT,SMC,智能货币概念,支撑和阻力,趋势分析,价格行为,市场结构,订单区块,突破区块,动量转变,强大的不平衡,HH/LL/HL/LH,公允价值差距,FVG,溢价和折扣区域,斐波那契回撤,OTE,买方流动性,卖方流动性,流动性空白,市场交易时间段,NDOG,NWOG,银弹,ICT模板。
在金融市场中,准确的市场分析对于投资者来说至关重要。为了帮助投资者更好地理解市场趋势和流动性,我们提供了一份使用教程,旨在实现高级市场分析功能。以下是一些功能的简要介绍和实现方法:
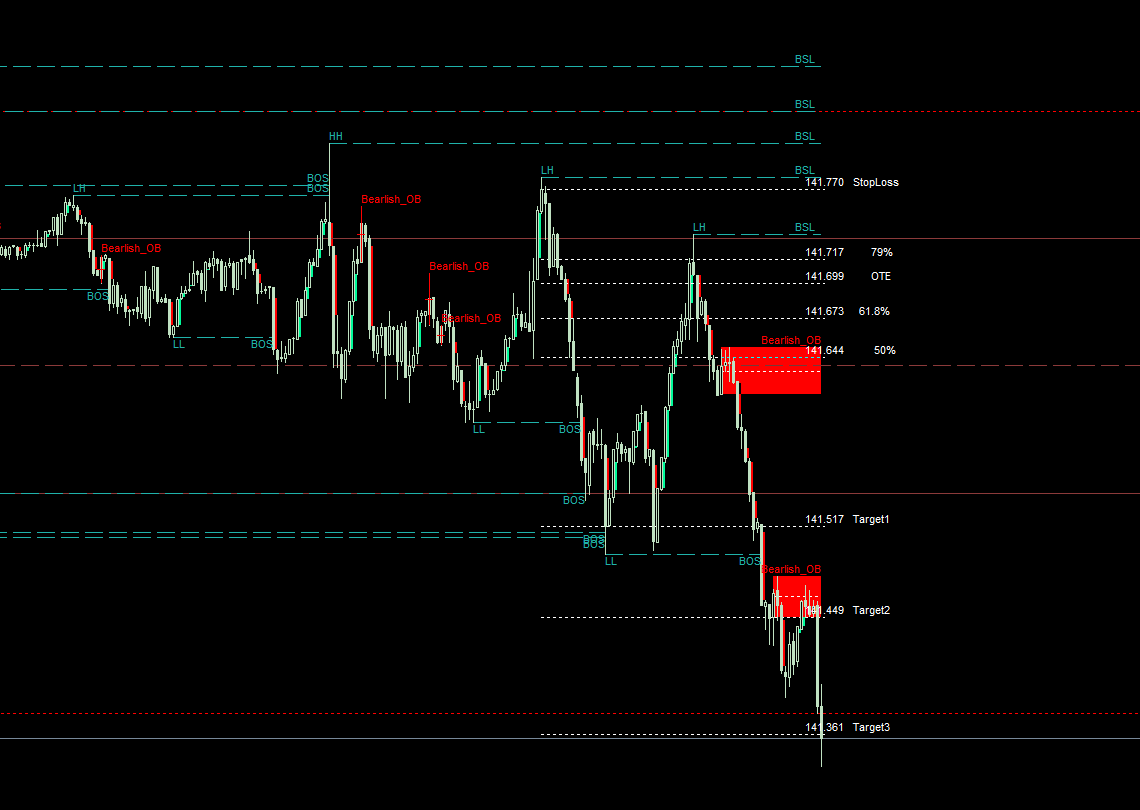
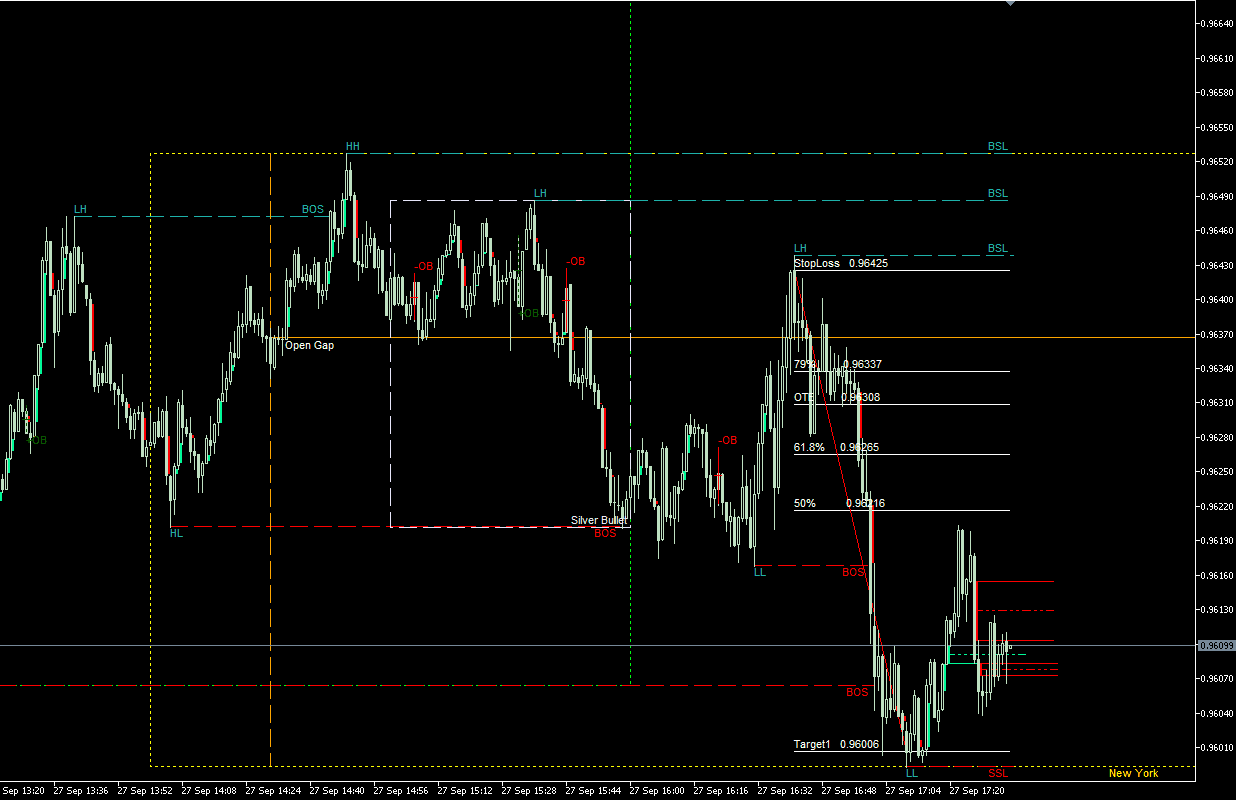
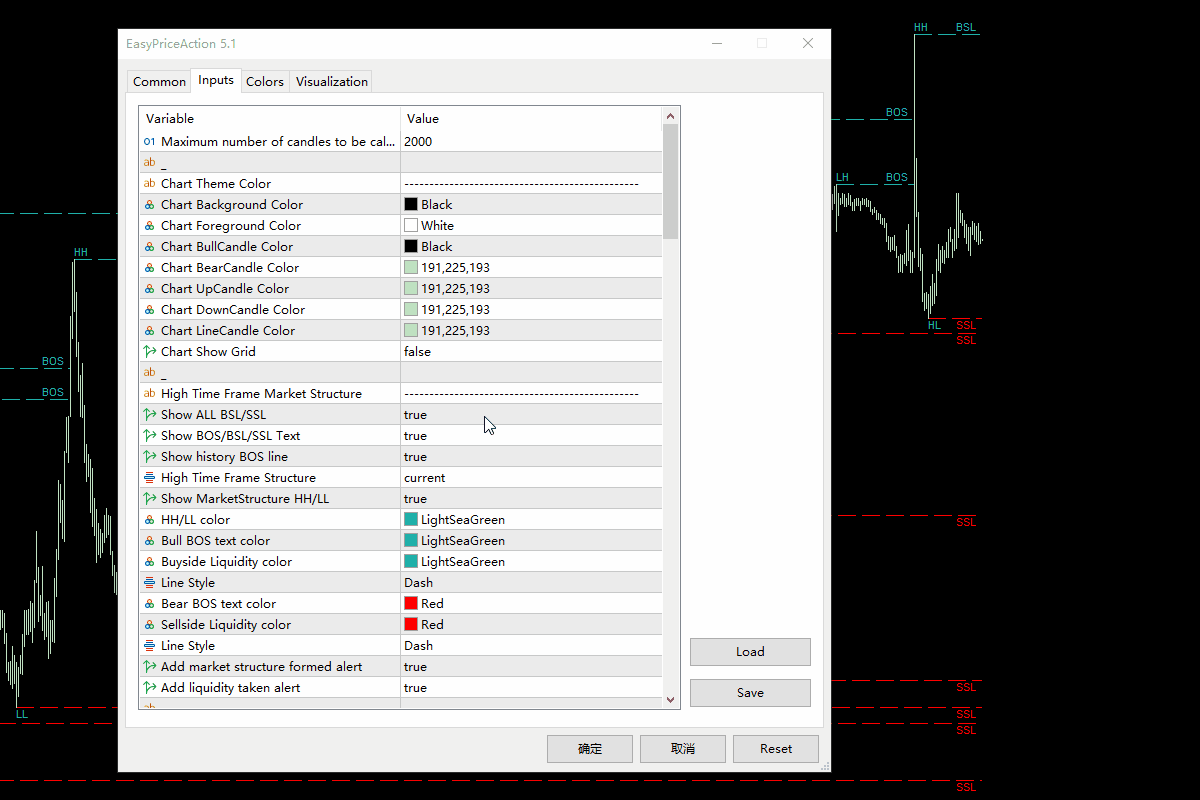
1. 显示高时间框架市场结构:
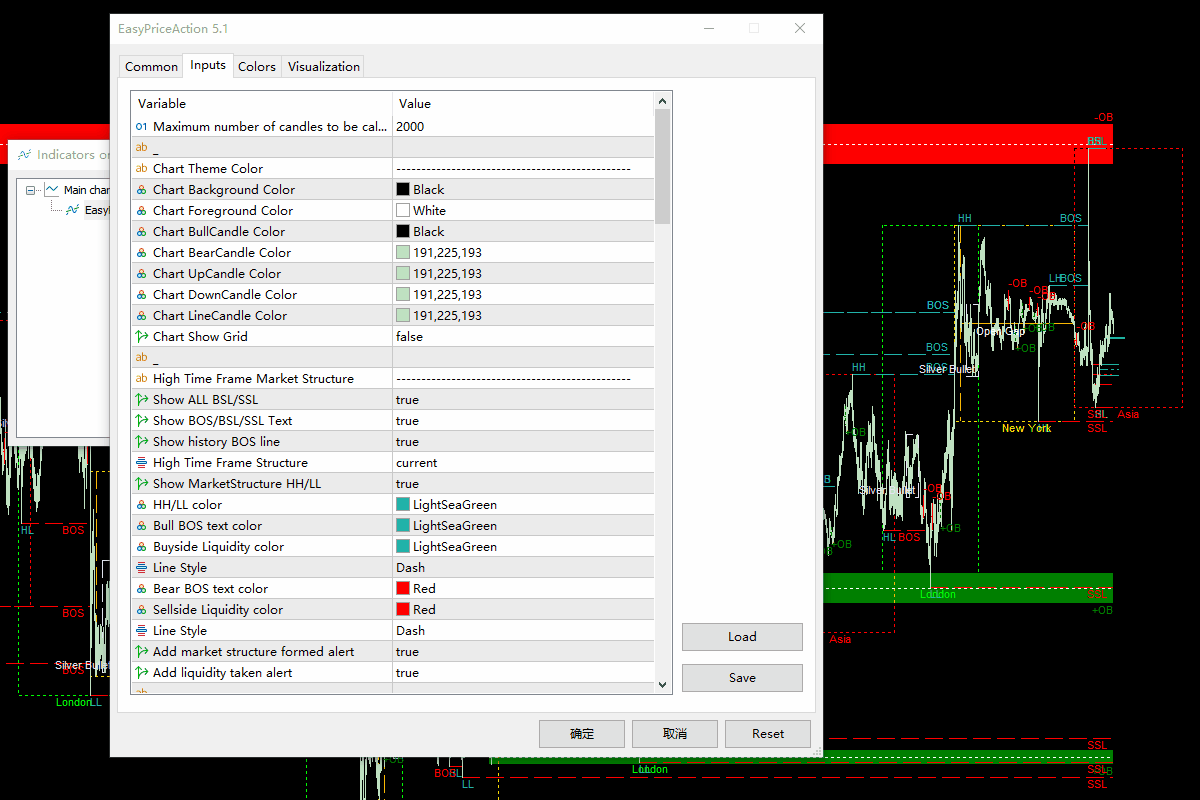
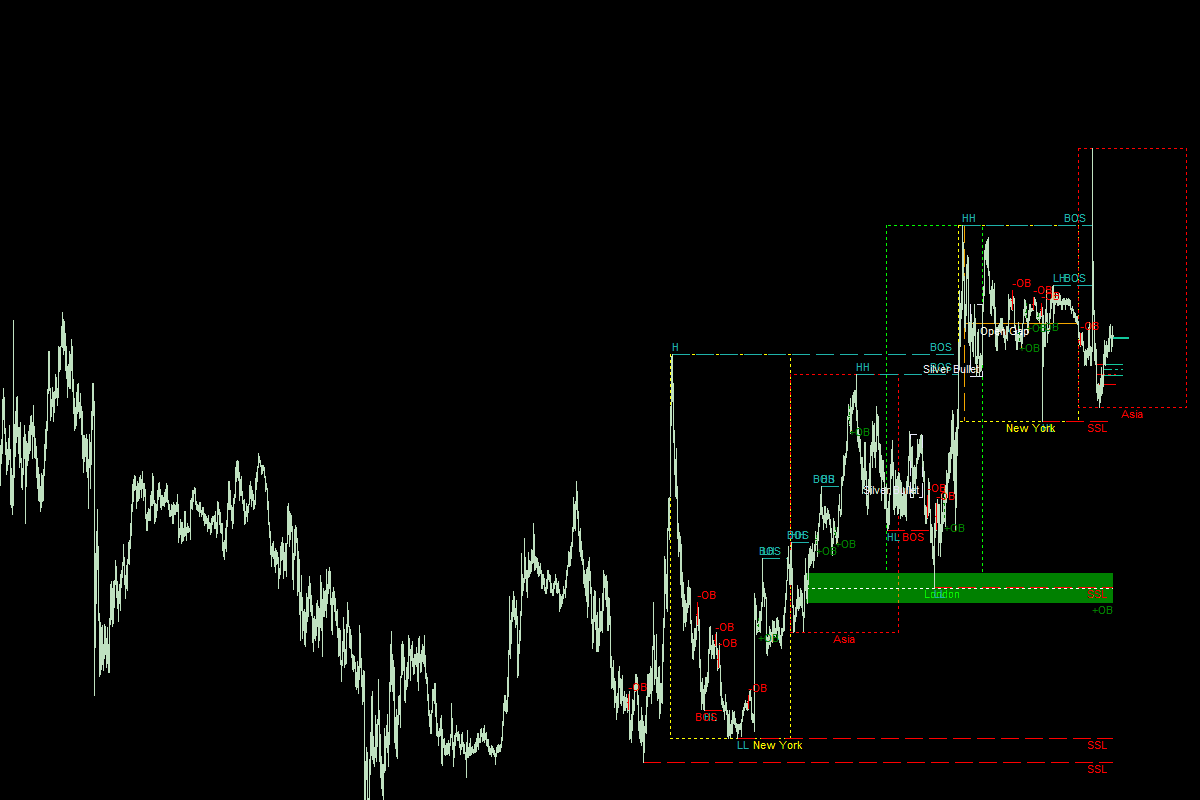
通过设置参数,您可以在图表上显示高时间框架市场结构。这将帮助您更好地理解市场的整体走势和结构。您可以根据自己的需求设置时间周期,并在图表上显示市场结构。
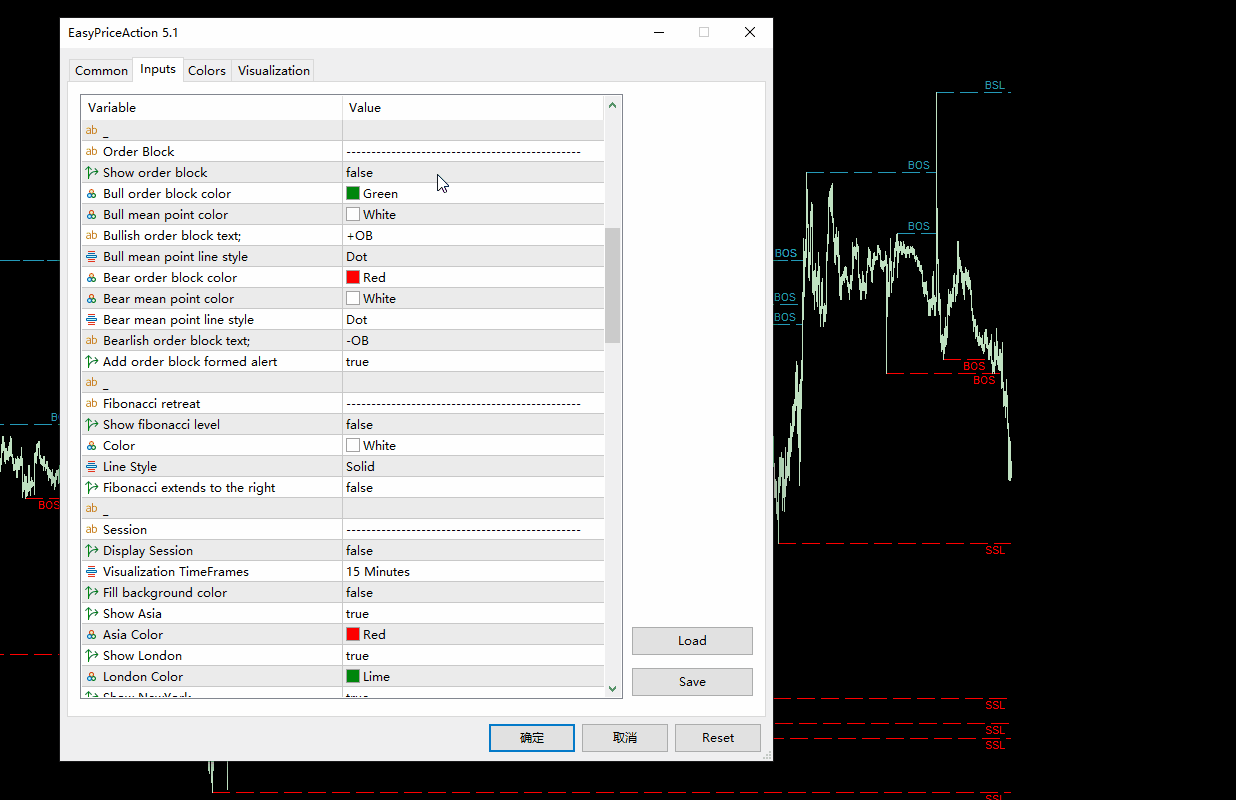
2. 显示流动性:
流动性是市场的重要指标之一。通过设置参数,您可以在图表上显示买方和卖方的流动性。您可以自定义文本和颜色,以便更好地识别不同的流动性水平。您还可以选择显示伦敦AM会话和纽约午餐时间的流动性。
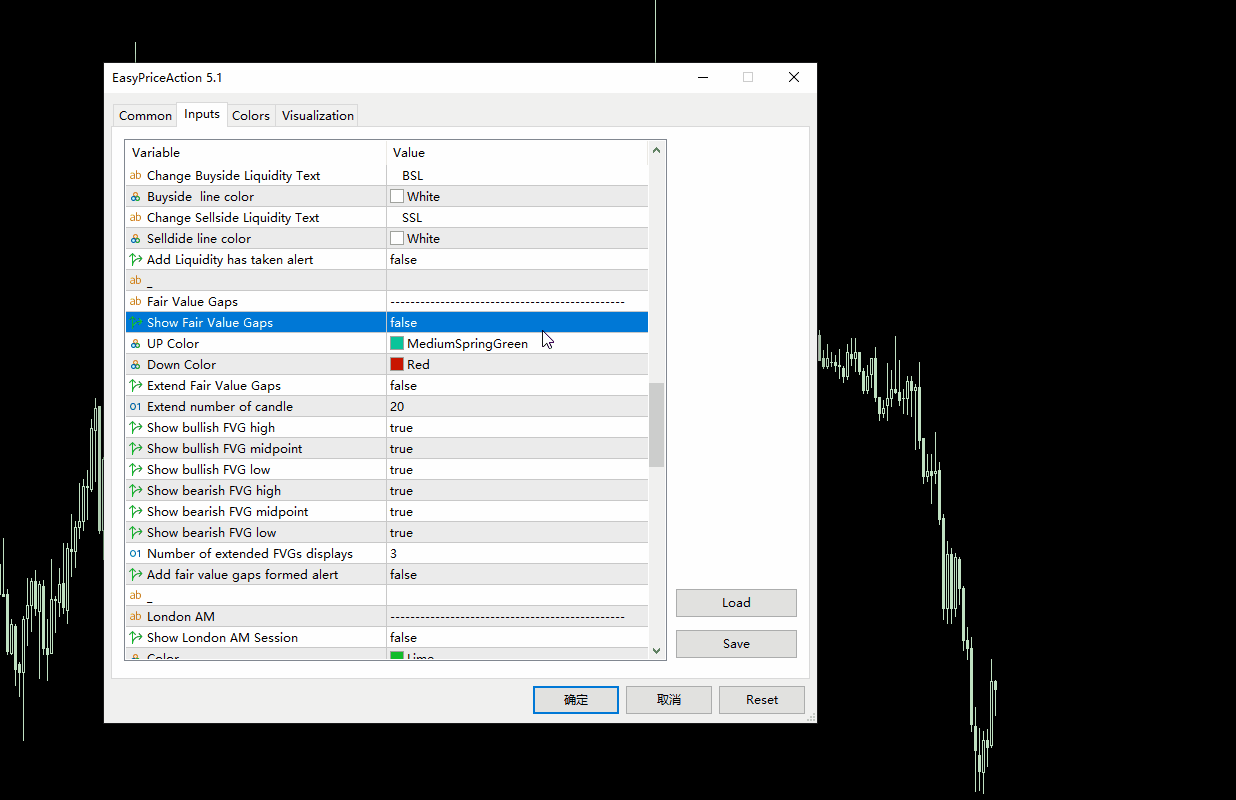
3. 显示公平价值差距:
公平价值差距是指市场价格与公平价值之间的差异。通过设置参数,您可以在图表上显示公平价值差距,并根据上涨或下跌使用不同的颜色进行标识。这将有助于您更好地理解市场的供需关系。
4. 显示伦敦AM会话:
伦敦AM会话是外汇市场中的一个重要时间段。通过设置参数,您可以在图表上显示伦敦AM会话的时间范围,并自定义背景颜色和线条样式。这将帮助您更好地把握伦敦市场的特点和趋势。
5. 显示纽约开盘时间:
纽约开盘时间是外汇市场中的另一个重要时间点。通过设置参数,您可以在图表上显示纽约开盘时间,并自定义颜色和线条样式。这将帮助您更好地了解纽约市场的开盘情况。
6. 显示开盘范围差距:
开盘范围差距是指市场开盘价与前一日收盘价之间的差异。通过设置参数,您可以在图表上显示开盘范围差距,并自定义颜色进行标识。这将帮助您更好地了解市场的开盘情况。
7. 显示Silver Bullet时间:
Silver Bullet时间是指市场中的特殊时间点。通过设置参数,您可以在图表上显示Silver Bullet时间,并自定义颜色进行标识。这将帮助您更好地把握市场中的重要时机。
8. 显示纽约AM会话:
纽约AM会话是外汇市场中的另一个重要时间段。通过设置参数,您可以在图表上显示纽约AM会话的时间范围,并自定义背景颜色和线条样式。这将帮助您更好地把握纽约市场的特点和趋势。
9. 显示纽约PM会话:
纽约PM会话是外汇市场中的另一个重要时间段。通过设置参数,您可以在图表上显示纽约PM会话的时间范围,并自定义背景颜色和线条样式。这将帮助您更好地把握纽约市场的特点和趋势。
10. 显示每日/每周/每月的前高/前低价格水平:
通过设置参数,您可以在图表上显示每日、每周和每月的前高和前低价格水平。这将帮助您更好地了解市场的价格走势和重要水平。
以上是我们提供的一些高级市场分析功能的简要介绍和实现方法。您可以根据自己的需求调整参数,并将代码片段添加到您的代码中以实现所需的功能。希望这份使用教程能够帮助您更好地进行市场分析和决策。祝您投资顺利!


Super Bien