适用于MetaTrader 4的新技术指标 - 2
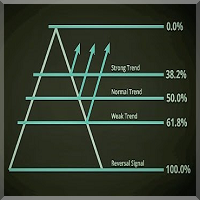
介紹 斐波那契水平專業指標是日常交易的絕佳工具,可作為其他指標的補充,以更好地確認交易設置和市場走向。該指標易於設置,適用於所有貨幣對和時間範圍,推薦使用 M15-W1。
該指標的目的是在圖表上顯示斐波那契水平、日線、上線和下線。作為附加功能,該指標還會在您的圖表上繪製回撤線和擴展線,並告訴您當天的高點、低點、範圍和點差。 Fibonacci Levels Pro 指標使用前一天的高點和低點為您繪製計算線。這是每個交易者必備的工具! 特徵 易於設置,無需複雜的設置 乾淨流暢的圖表線條,易於閱讀 適用於所有貨幣對和時間範圍 斐波那契線的可調顏色設置 可調節儀表板顏色 包含帳戶信息的儀表板 指標參數 UpperFiboColor - 在 123.6 到 400.0 之間設置您想要的上斐波那契水平的顏色 MainFiboColor - 為每日斐波那契水平從高 100.0 到低 0.0 設置所需的顏色 LowerFiboColor - 從 -23.6 到 -500.0 為較低的斐波那契水平設置所需的顏色 主要斐波那契線 - 真/假。在圖表上顯示從高 100.0 到低 0.0 的每日水平
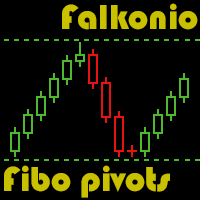
The indicator presents reversal points by Fibo levels based on the previous day prices. The points are used as strong support/resistance levels in intraday trading, as well as target take profit levels. The applied levels are 100%, 61.8%, 50%, 38.2%, 23.6%. The settings allow you to specify the amount of past days for display, as well as line colors and types. Good luck!
This indicator will draw Support and Resistance lines calculated on the nBars distance. The Fibonacci lines will appear between those 2 lines and 3 levels above or under 100%. You may change the value of each level and hide one line inside 0-100% range and all levels above or under 100%.
Input Parameters: nBars = 24; - amount of bars where the calculation of Support and Resistance will be done. Fibo = true; if false then only Support and Resistance will be shown. Level_1 = true; - display of t

This indicator is another variant of the famous powerful indicator Fibonacci-SS https://www.mql5.com/en/market/product/10136 but has different behaviour in placing Pending Order and TP Line. Automatically places Fibonacci retracement lines from the last highest and lowest visible bars on the chart with: An auto Pending Order (Buy/Sell). Taking Profit 1, Taking Profit 2 is pivot point and Taking Profit 3 for extended reward opportunity. The best risk and reward ratio.
Simple and powerful indica
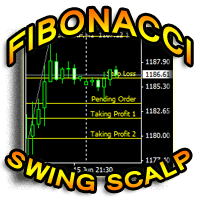
Fibonacci Swing Scalp (Fibonacci-SS) This indicator automatically places Fibonacci retracement lines from the last highest and lowest visible bars on the chart with an auto Pending Order (Buy/Sell), Stop Loss, Taking Profit 1, Taking Profit 2 and the best risk and reward ratio. This is a very simple and powerful indicator. This indicator's ratios are math proportions established in many destinations and structures in nature, along with many human produced creations. Finding out this particular a

This indicator draws Fibonacci level automatically from higher high to lower low or from lower low to higher high. With adjustable Fibonacci range and has an alert function.
How to use Fibonacci Risk Reward Ration (R3) into trading strategy Forex traders use Fibonacci-R3 to pinpoint where to place orders for market entry, for taking profits and for stop-loss orders. Fibonacci levels are commonly used in forex trading to identify and trade off of support and resistance levels. Fibonacci retrace

The indicator for automatic drawing of Fibonacci-based Moving Averages on the chart. It supports up to eight lines at a time. The user can configure the period of each line. The indicator also provides options to configure color and style of every line. In addition, it is possible to show indicator only on specific time frames. Please contact the author for providing additional levels or if you have any other suggestions.

Simply drop the indicator to the chart and Fibonacci levels will be shown automatically! The indicator is developed for automatic drawing of Fibonacci levels on the chart. It provides the abilities to: Select the standard Fibo levels to be shown Add custom levels Draw the indicator on the timeframes other than the current one. For example, the indicator is calculated on the weekly period (W1) and is displayed on the monthly period (MN1) Select the timeframes the indicator will be available on Ca

Fibonacci Arcs in the full circles are based on the previous day's candle (High - Low).
These arcs intersect the base line at the 23.6%, 38.2%, 50%, 61.8%, and 78.6%. Fibonacci arcs represent areas of potential support and resistance.
Reference point - the closing price of the previous day.
These circles will stay still all day long until the beginning of the new trading day when the indicator will automatically build a new set of the Fibonacci Arcs.

斐波那契水平通常用於金融市場交易中,以識別和權衡支撐和阻力水平。
在價格大幅上漲或下跌之後,新的支撐位和阻力位通常處於或接近這些趨勢線
斐波那契線建立在前一天的高/低價格的基礎上。
參考點-前一天的收盤價。 斐波那契水平通常用於金融市場交易中,以識別和權衡支撐和阻力水平。
在價格大幅上漲或下跌之後,新的支撐位和阻力位通常處於或接近這些趨勢線
斐波那契線建立在前一天的高/低價格的基礎上。
參考點-前一天的收盤價。 斐波那契水平通常用於金融市場交易中,以識別和權衡支撐和阻力水平。
在價格大幅上漲或下跌之後,新的支撐位和阻力位通常處於或接近這些趨勢線
斐波那契線建立在前一天的高/低價格的基礎上。
參考點-前一天的收盤價。
當價格停止下跌,改變方向並開始上漲時,就會出現支撐。 支撐通常被視為支撐或支撐價格的“底線”。
阻力是上漲的價格停止,改變方向並開始下跌的價格水平。 阻力通常被視為阻止價格上漲的“天花板”。 外匯交易者使用斐波那契回撤來確定在何處下訂單進入市場,獲利和止損訂單。 斐波那契水平通常用於外匯交易中,以識別和權衡支撐位和阻力位。 交易者通過在圖表上以這些價格水平繪製水平線來確定市場可能回撤的區域,然後再恢復最初的大價格走勢所形成的整體趨勢,從而繪製出38.2%,50%和61.8%的關鍵斐波那契回撤水平。 指标计算 nBars(n根柱线) 的距离,并绘制支撑和阻力线。 如果输入参数 Fibo = true 则在线间出现菲波纳奇(黄金分割)线。

Fibonacci Ratio is useful to measure the target of a wave's move within an Elliott Wave structure. Different waves in an Elliott Wave structure relates to one another with Fibonacci Ratio. For example, in impulse wave: • Wave 2 is typically 50%, 61.8%, 76.4%, or 85.4% of wave 1. Fibonacci Waves could be used by traders to determine areas where they will wish to take profits in the next leg of an Up or Down trend.

菲波纳奇支撑阻力指标 本指标创建支撑和阻力线。此指标基于菲波纳奇回撤和扩展级别。它会考虑菲波纳奇级别的多种组合,并在这些基础上绘制支撑/阻力线。此指标使用的顶部和底部由之字折线指标计算而来。如有必要,之字折线也可以在图表上绘制。 本指标考虑许多过去的反转点和菲波纳奇比率级别的组合,而当它看到多条线在相同的价格汇合,那么这将成为指标绘制的支撑/阻力线。未来的市场反转往往会正好出现在这些线附近。这是一个自动指标。所以,旧线将被删除,新线将随着市场的进步而绘制。
设置 Bars_Back - 向后一定数量的柱线用于所有计算。数量较少则较少反转点将被使用,因此,绘制的支撑和阻力线较少。向后更多柱线则有更多反转点将被使用,因此,绘制的支撑和阻力线较多。 Buffer_Space - 这表示每个已计算的菲波纳奇级别所需的汇合之间的最大点数。该数值越高,则确切的汇合必须越少。数字越低,则精确汇合必须更多,因此有较高的可靠性。例如, 让我们设为 10 点, 且指标运行在非分形的 4-位报价经纪商 (同样是 10 点)。此指标看到 3 个 菲波纳奇 回撤级别,分别在 1.4995, 1.5000,
FREE

Fibonacci sequence is defined by integer sequence: 0, 1, 1, 2, 3, 5, 8, 13, 21, 34, 55, 89, 144, ... By definition, it starts from 0 and 1, the next number is calculated as a sum of two previous numbers. Instead of the standard moving average, the indicator uses the following calculation of average price: Bar0 + Bar1 + Bar2 + Bar3 + Bar5 + Bar8 + Bar13 + Bar21 + ...
Input parameters FiboNumPeriod_1 - numbers in the following integer sequence for Fibo Moving Average 1. nAppliedPrice_1 - Close p

This indicator is based on the same idea as https://www.mql5.com/en/market/product/2406 , but instead of Average Bars it uses series or Fibonacci sequence. When the previous Price Close is above the previous indicator Bar, the probability to go Long is very high. When the previous Price Close is under the previous indicator Bar, the probability to go Short is very high.
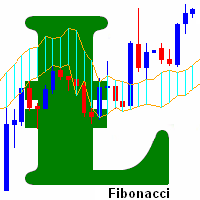
This indicator is based on the Fibonacci sequence. The input parameters fiboNum is responsible for the number in the integer sequence. The input parameter counted_bars determines on how many bars the indicator's lines will be visible. When the previous Price Close is above the previous indicator Bar, the probability to go Long is very high. When the previous Price Close is under the previous indicator Bar, the probability to go Short is very high.

Fibonacci sequence is defined by integer sequence: 0, 1, 1, 2, 3, 5, 8, 13, 34, 55, 89, 144, ... By definition, it starts from 0 and 1, the next number is calculated as a sum of two previous numbers. Instead of the standard moving average, the indicator uses the caluclation of average price in form:
Bar0 + Bar1 + Bar2 + Bar3 + Bar5 + Bar8 + Bar13 +... Input parameters: FiboNumPeriod (15) - Fibonacci period; nAppliedPrice (0) - applied price (PRICE_CLOSE=0; PRICE_OPEN=1; PRICE_HIGH=2; PRICE_LOW
MetaTrader市场是您可以下载免费模拟自动交易,用历史数据进行测试和优化的唯一商店。
阅读应用程序的概述和其他客户的评论,直接下载程序到您的程序端并且在购买之前测试一个自动交易。只有在MetaTrader市场可以完全免费测试应用程序。
您错过了交易机会:
- 免费交易应用程序
- 8,000+信号可供复制
- 探索金融市场的经济新闻
注册
登录