指定
Expert coder needed. I want the programming to be very clean, and detailed in explanations in order to be easy edited, I will check the script you send, new versions coming soon.
EA show the indicators on the chart, Moving Average line must be white and last from background in order to be visible.
EA should be made for MT5 because you can backtest it even if you have multiple pairs.
Transform all indicators from MT4 to MT5 and send them to developer.
Indicators needed: Five Pattern, Moving Average, MAincolor, CandlestickBW, Flat Trend
CandlestickBW indicator colors the candlesticks according to B. Williams:
Uptrend and growing candles - aqua;
Uptrend and falling candles - blue;
no trend and growing candles - green;
no trend and falling candles - red;
Downtrend and growing candles - purple;
Downtrend and falling candles - magenta
1. When indicators show the same direction with other indicators open or close trades. When five paterns show only Point E or one of mutilation or evolution multiply opened trade by 3 in that direction.
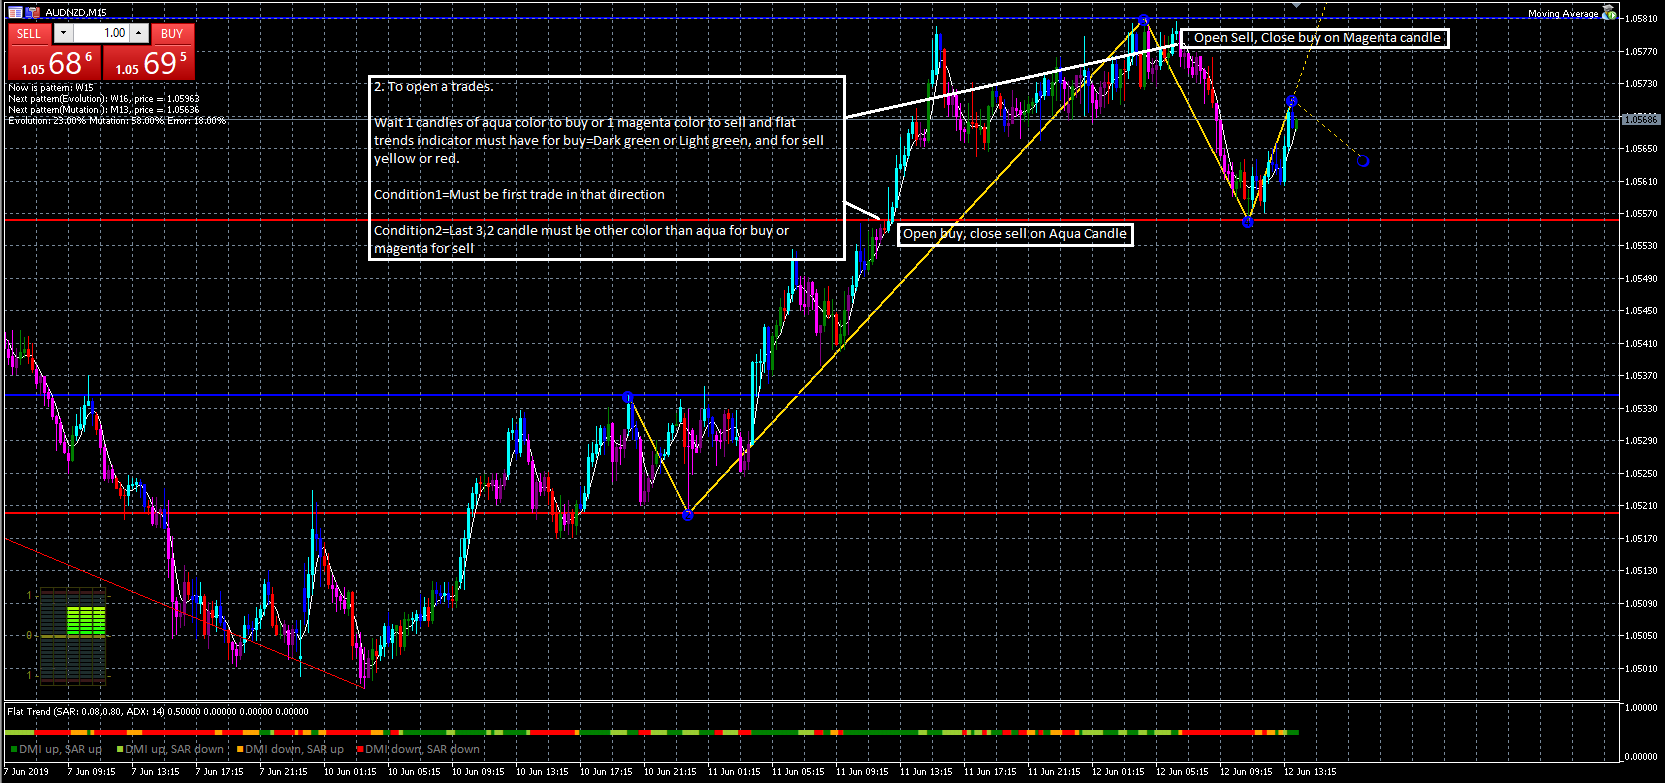
2. To open a trades.
Wait 1 candles of aqua color to buy or 1 magenta color to sell and flat trends indicator must have for buy=Dark green or Light green, and for sell yellow or red. After one trade is opened in a direction it disabled, use double a trade, and then triple a trade.
Condition1=Must be first trade in that direction
Condition2=Last 3,2 candle must be other color than aqua for buy or magenta for sell
Condition3=High or low of third candle must have a distance of maximum 30 pips of last candle(Use parameter Candle difference=30)
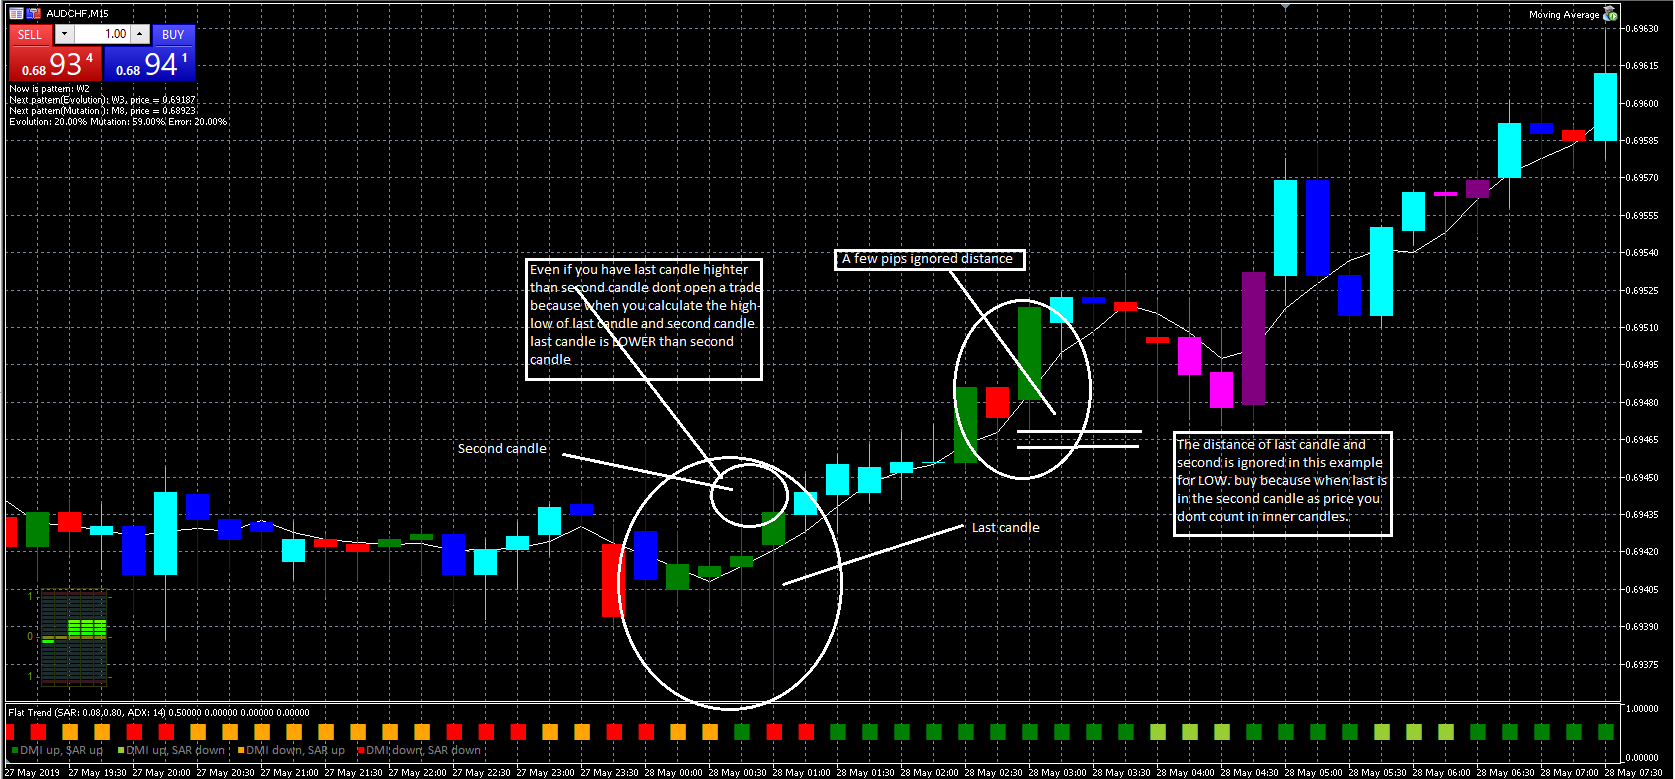
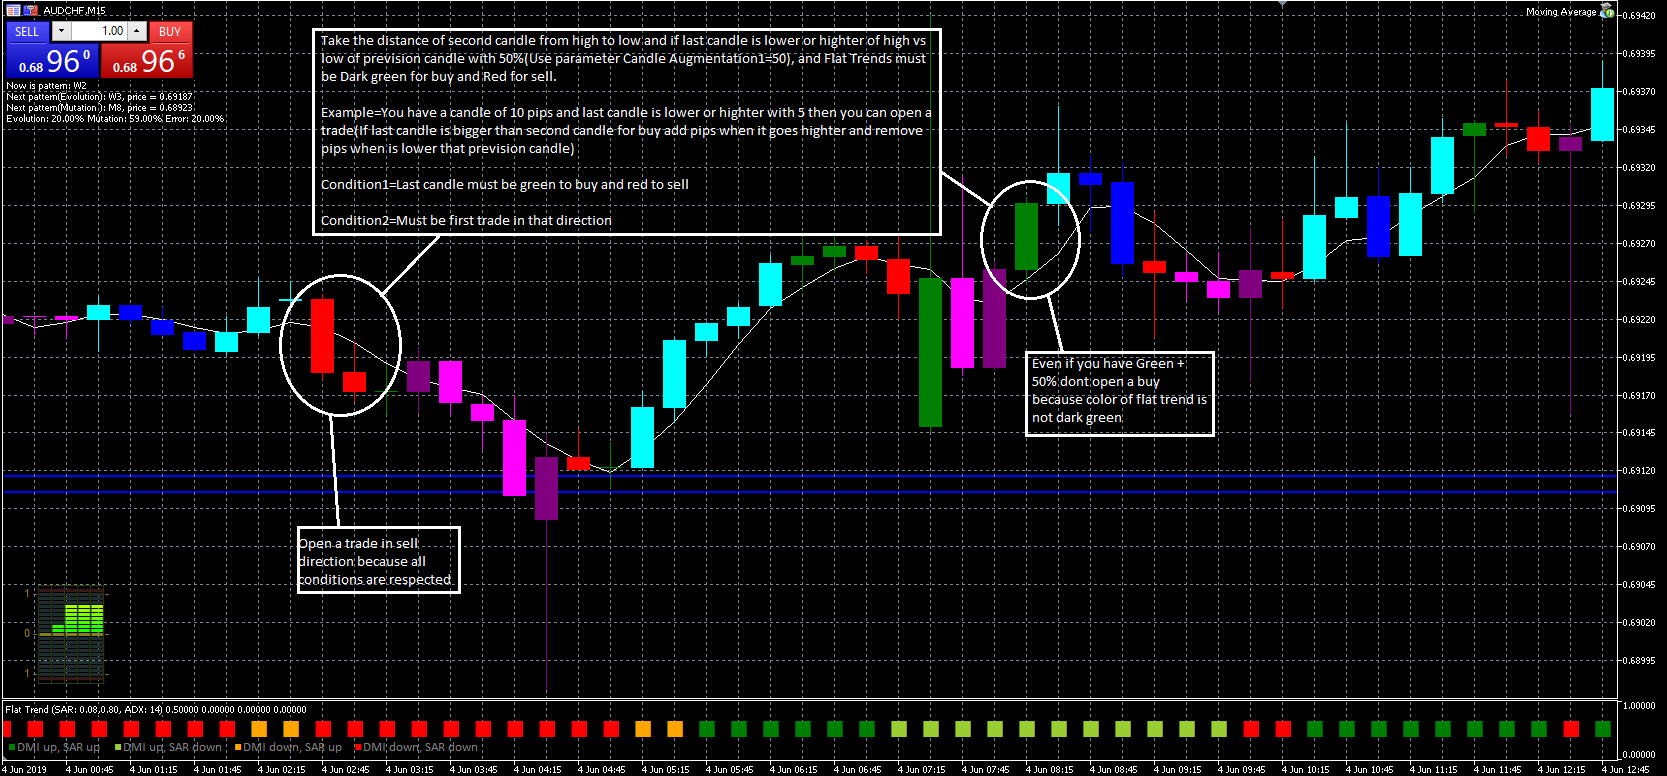
Take the distance of second candle from high to low and if last candle is lower or highter of high vs low of prevision candle with 50%(Use parameter Candle Augmentation1=50), and Flat Trends must be Dark green for buy and Red for sell.
Example=You have a candle of 10 pips and last candle is lower or highter with 5 then you can open a trade(If last candle is bigger than second candle for buy add pips when it goes highter and remove pips when is lower that prevision candle)
Condition1=Last candle must be green to buy and red to sell
Condition2=Must be first trade in that direction
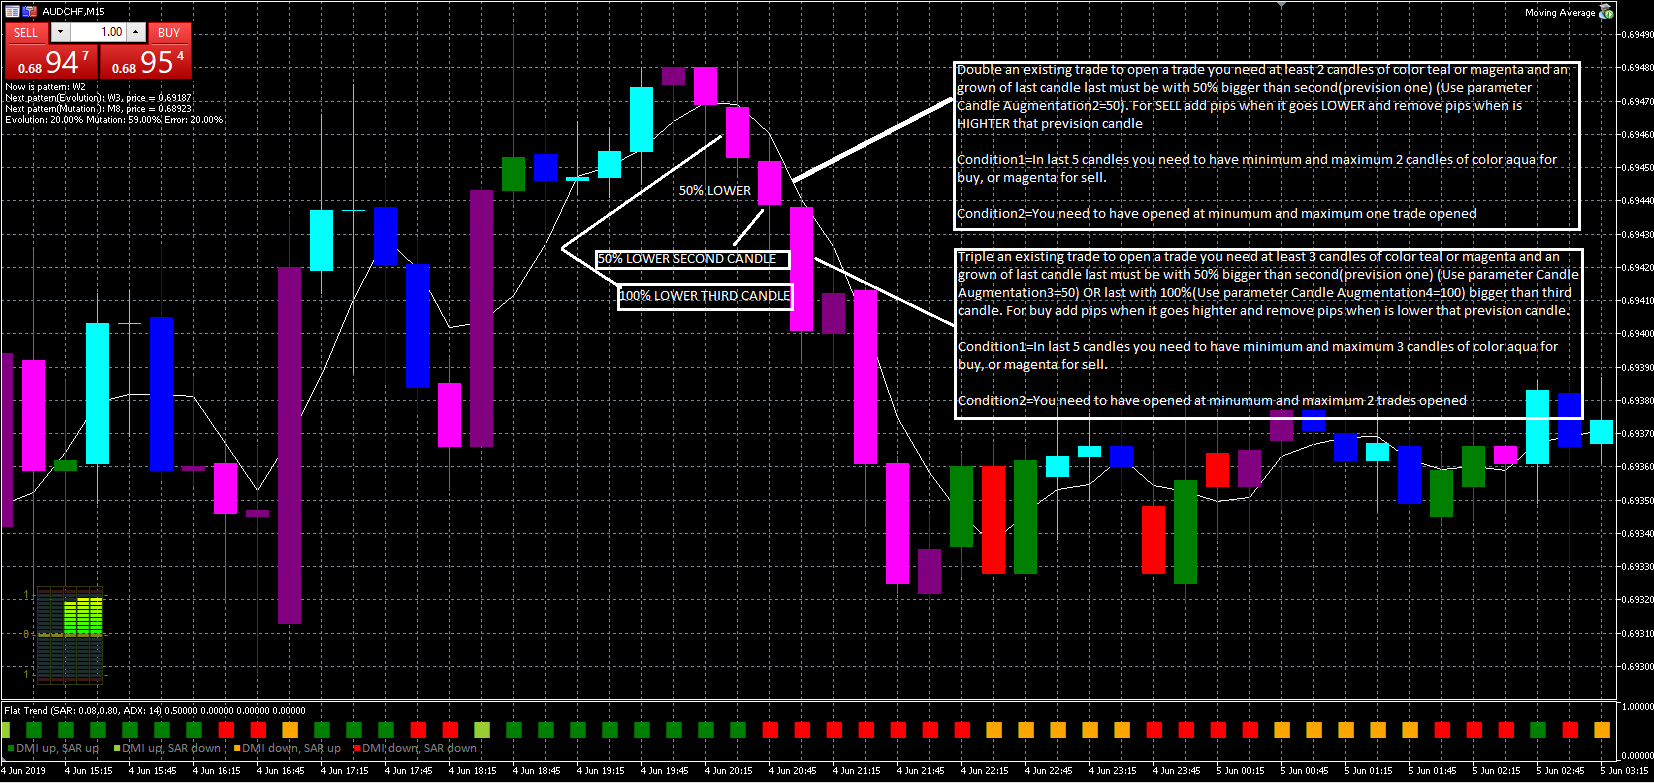
Double an existing trade to open a trade you need at least 2 candles of color teal or magenta and an grown of last candle last must be with 50% bigger than second(prevision one) (Use parameter Candle Augmentation2=50). For buy add pips when it goes highter and remove pips when is lower that prevision candle
Condition1= In last 5 candles you need to have minimum and maximum 2 candles of color aqua for buy, or magenta for sell.
Condition2=You need to have opened at minumum and maximum one trade opened
Example=You have a candle of 10 pips and last candle is lower or highter with 5 then you can open a trade(If last candle is bigger than second candle for buy add pips when it goes highter and remove pips when is lower that prevision candle)
Triple an existing trade to open a trade you need at least 3 candles of color teal or magenta and an grown of last candle last must be with 50% bigger than second(prevision one) (Use parameter Candle Augmentation3=50) OR last with 100%(Use parameter Candle Augmentation4=100) bigger than third candle. For buy add pips when it goes highter and remove pips when is lower that prevision candle.
Condition1=In last 5 candles you need to have minimum and maximum 3 candles of color aqua for buy, or magenta for sell.
Condition2=You need to have opened at minumum and maximum 2 trades opened
Example=You have a candle of 10 pips and last candle is lower or highter with 5 then you can open a trade(If last candle is bigger than second candle for buy add pips when it goes highter and remove pips when is lower that prevision candle)
Example= third candle=10 pips, second candle=5 Highter or lower, Last candle=10 Highter or lower than second + third candle) with 10 pips both conditions are respected, but you need minimum one of them.
To close trades.
When you have one aqua candle close all sell, and when is magenta close all buy. Flat trend must be color light green, dark green to close sell and yellow, red to close all buy.
When you have one green candle and last candle is going when buying is going below the prevision candle close all trades if high to low distance of last candle is below the high to low distance of second candle by 50% (Use parameter Candle Augmentation5=50). To close all buy you need one red candle.
Condition1=Flat trends must be red to close buys, and dark green to close sells
Example=Prevision candle High 15 low 10, last is 16 low 3 Close that trade when buying because is have 50% + (-1 pip)
CASH FLOW
Cash flow have the role to select the most volatile pair and add lots. To make it you need to take the Zigzag from panel and sum all tops + bottoms then use this.
X + Y + Z = All Cash Flow ( Sum of hights and lows on Zigzag of every pair= X or Y or Z
(For one pair high+lows sum X Number of Pairs) : All Cash Flow
MONEY MANAGEMENT( Calculates the probability of winning)
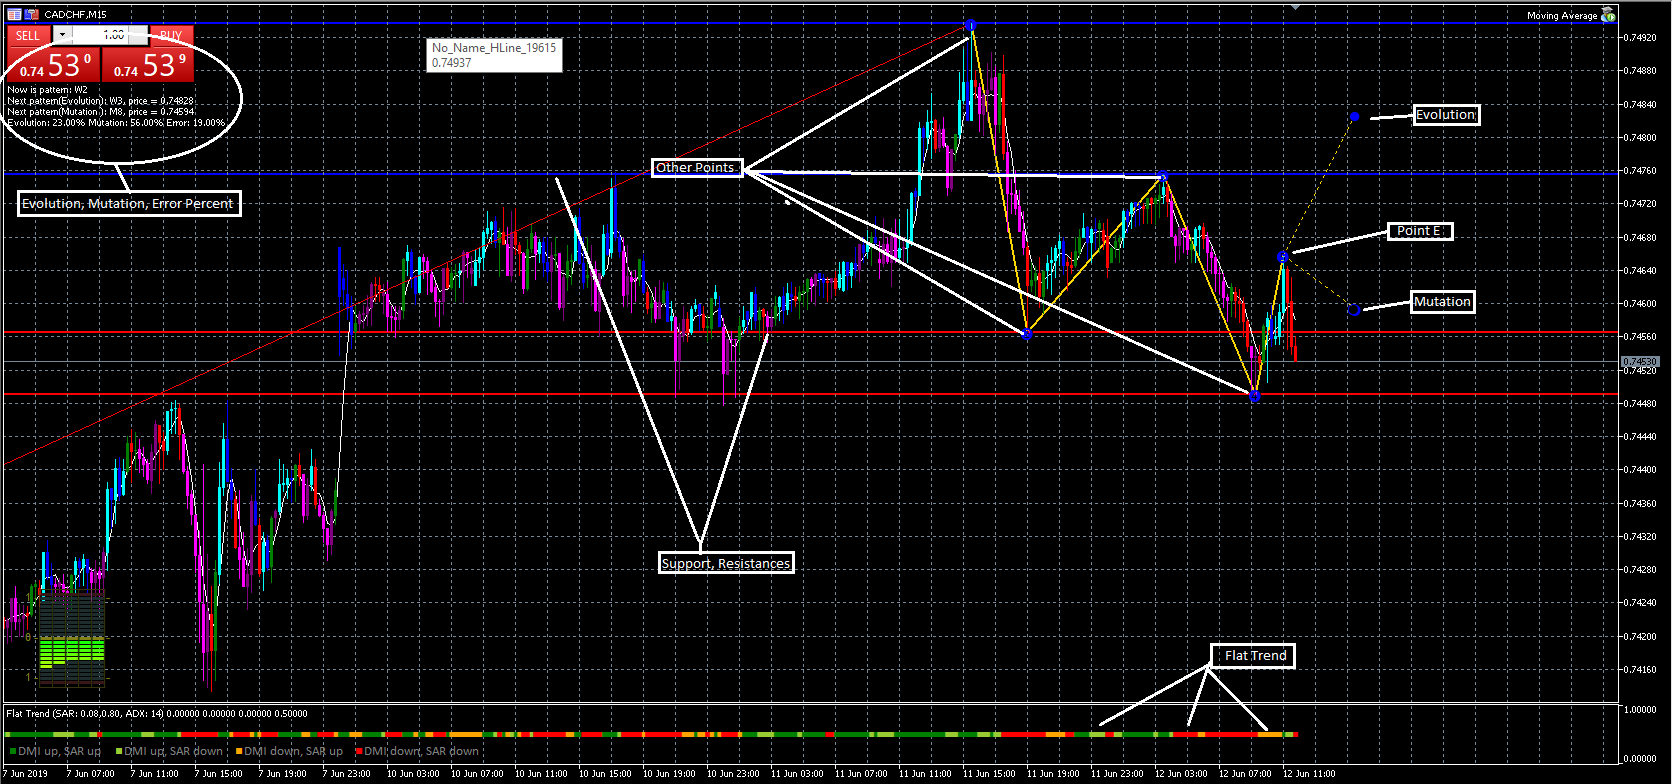
How to calculate the distance Mutilation/Evolution
Example Mutilation 30 Distance from Point E to Mutilation Point : Evolution 10 Distance from Point E to Evolution Point = Mutilation 3, Evolution 1/3
Condition1=Multiplication/Evolution must have a difference betwheen them of max 2 times bigger one to another.
How to calculate Point E to current price and Mutilation/Evolution.
Current price to Mutilation/Evolution (X) Mutilation/Evolution to point E (X) Current price to point E=Mutilation/Evolution to Point E
How to calculate Mutilation, Evolution.
Distance Mutilation/Evolution (X) Point E to current price and Mutilation/Evolution
How to extract Mutilation/Evolution
Mutilation 30 (:) Evolution 10 = Mutilation 30, which is Evolution 1/3
Use the strategy that have bigger value example Mutilation or Evolution when are both above or below the candle
Use Evolution to the direction where it places
Use Mutilation to the direction where it places
Pattern Finder v3
When the indicator reaches a bullish or bearish signal use this indicator to open trades only on that direction with a tolerance of 20 pips above and 20 below the signal.. add 20 pips to parameters like Pattern Tolerance=20.
How to calculate money management.
Pattern finder result(bears(below the price) or bulls) (X) Point E Mutilation/Evolution (X) Mutilation/Evolution Win percent (X) (100 - Error Percent) (:) 200= Money Management Percent
How to calculate Money Management on money.
(Cash flow one pair X Money Management percent Mutation/Evolution) : 100=Money lots
3. Momentum is used to open a trade or to close it
Take last 10 market change of the price and (X) everytime price changes in favorable direction, when it goes in the opposite direction (:) the number.
Example buy 2 X 4 : 2 X 8 : 1=32
Example sell 2 : 4 X 2 : 8 X 1=1/8
Substract buy : sell and if the result number is bigger than 10 ignore Moving Average for buy.
Substract sell : buy and if the result number is bigger than 10 ignore Moving Average for sell.
Substract buy : sell and if the result number is bigger than 1 allow buying below the Moving Average line, And if is smaller than 1 allow selling above the Moving Average line.
4. When Maincolor is red allow closing buys, green sells but ignore Maincolor if:
Current price is near a support or resistance line(resistance and support tolerance =30 pips
Current price is near mutilation/ evolution (mutilation/evolution tolerance =20 pips
Point E is near current price (point E tolerance =20 pips
Near a point other than point E (Other points tolerance =30 pips
5. Moving average have the role to delay opening trades until buy goes below the line and sell above the line.
6. Create a simple Stoploss will activate to the highest and lowest point of near peak. Note: stop-loss has one direction in loss and can be disabled in parameters. Last readed peak can be max 30 candles old and max 10% pips in negative from difference of high and low of last peak of the market.
7. Risk Now and Risk Expected, when it becomes high(30 or more) it needs to be written on panel that “Risk is too high, decrease lot rates below 30” Risk text must stay one second then disapear one second, then popup again one second. Risk colors are blue 0-20, yellow 20-30, red 30 or more, when a pair does not exists on broker it should not count as a active pair because it modifies risk result.
((Total High - Low last 2 points other than point E : 2) + . . . + All Pairs + ... ) : Total Number of Active Pairs= Medium High - Low
(((((Total High low last 2 points other than point E, X Stoploss / 100) X Number or Pairs) X Value of a Pip) X Account Risk Parameter) X 2) : Equify account X 100 number= Expected Risk Result
(((Total High - Low X Stoploss / 100) X Total Value of a Pip in Opened Trades) X Account Risk Parameter) : Equify account X 100 number= Now Risk Result
8. When candle prediction have the high higher than low open buys and don't close sells.
9. When trinity impulse is 0 dont allow to close or open any trades. When is below 0 allow only sell or above only buy.
10. When last signal of Pattern Recognision is bearish or bullish open trades only on that direction for last candles.
PARAMETERS
Timeframe=15 min
LOT=Fixed and percentual
Delta Force volatility=200
Simple Trailing Stop=50 pips
Stoploss old=30 candles
Stoploss=10% in negative
Account Risk=1
Market change of price=10 last 10 changes
Moving Average price change difference=10 10 times bigger difference Buy VS Sell
Candle difference=30
Candle Augmentation1=50
Candle Augmentation2=50
Candle Augmentation3=50
Candle Augmentation4=100
Candle Augmentation5=50
Pattern Tolerance=20 Pips
Resistance and support tolerance=30 pips above and below
Mutilation Evolution tolerance=20 pips
Point E tolerance=20 pips
Other points tolerance=30 pips
CONFIGURATION
-/- All parameters of indicators
PAIRS
EUR/USD, GBP USD, NZD/USD, AUD/USD, USD/JPY, USD/CHF, USD/CAD, EUR/JPY, EUR/CAD, EUR/CHF, EUR/GBP, EUR/NZD, EUR/AUD, AUD/NZD, NZD/JPY, CAD/JPY, AUD/JPY, CHF/JPY, GBP/CAD, , GBP/AUD, CAD/CHF, GBPJPY, AUDCHF, GBPNZD, NZDCHF, GBPCAD, GBPNZD, And others