类别中的新订单:
30+ USD
50 - 400 USD
30+ USD
30 - 100 USD
100 - 300 USD
指定
I have an EA coded currently that opens when a pattern is formed. I have a few additional strategies based on these indicators that I want to incorporate that are outside my coding knowledge. You would have full access to the current code and all the indicators used for back-testing.
This seems like for a novice or expert MQL4 coder this would be a real easy fix, and a quick way to make $200.
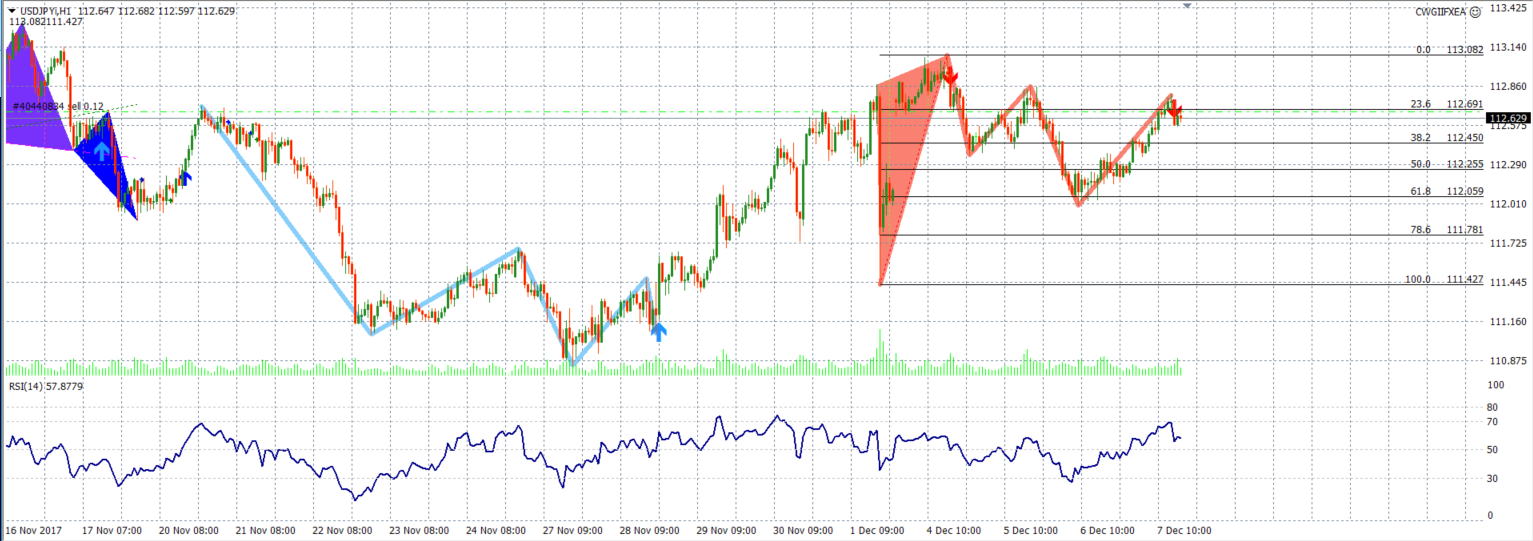
Happy to discuss more in detail, and please see attached for the current view of how the indicators appear and look.
Thanks!
Charles G.
反馈
1
等级
项目
100
39%
仲裁
17
29%
/
47%
逾期
32
32%
空闲
2
等级
项目
1
0%
仲裁
0
逾期
0
空闲
3
等级
项目
1048
49%
仲裁
39
28%
/
41%
逾期
49
5%
空闲
4
等级
项目
395
28%
仲裁
155
20%
/
52%
逾期
112
28%
空闲
5
等级
项目
3075
66%
仲裁
77
48%
/
14%
逾期
340
11%
空闲
6
等级
项目
5
0%
仲裁
3
0%
/
67%
逾期
2
40%
空闲
7
等级
项目
440
26%
仲裁
125
21%
/
57%
逾期
96
22%
工作中
8
等级
项目
50
28%
仲裁
47
9%
/
72%
逾期
23
46%
空闲
9
等级
项目
369
66%
仲裁
10
50%
/
0%
逾期
46
12%
空闲
10
等级
项目
1
0%
仲裁
1
0%
/
100%
逾期
0
空闲
11
等级
项目
22
59%
仲裁
2
0%
/
50%
逾期
2
9%
空闲
12
等级
项目
134
27%
仲裁
62
13%
/
53%
逾期
58
43%
空闲
相似订单
Hello! I am looking for an experienced Pine Script coder to create a custom indicator for mapping market structure based on fractals. The developer needs to know a lot about coding market structure indicators and be proficient in Pine Script. excited to collaborate with a gifted developer
I have list of free indicators in tradingview and i would like to convert them into an mt4 ea, But the EA will have and work based on the indicators features The list of the are listed as follows :> 1. Market Structure Break And Order block. By EmreKb 2. Rainbow Adaptive RSI by LuxAlgo 3. Multiple MA (21,50,100) 4. SuperTrend My budget for this 80$ max
Code mt4 ea with tradingview indicators sript
50 - 60 USD
I have list of free indicators in tradingview and i would like to convert them into an mt4 ea, But the EA will have and work based on the indicators features The list of the are listed as follows :> 1. Market Structure Break And Order block. By EmreKb 2. Rainbow Adaptive RSI by LuxAlgo 3. Multiple MA (21,50,100) 4. SuperTrend Please don't apply if can't do this, So we won't ourselves time
Source code for indicator
30+ USD
good day i have an indicator but need the source for this reason The indicator only work on a single Time frame open trade, and close with only a single TF i will like the indicator work on multiple time frame just like other installed indicator My coder said the reason it cannot work like other indicator installed is because it has no buffer First confirm if you have the source code because its a popular indicator
Hello! I am looking for an experienced Pine Script coder to create a custom indicator for mapping market structure based on fractals. The developer must be skilled in Pine Script and have a solid understanding of how to code market structure indicators. Looking forward to working with a talented developer
Hello developers, I would like to hire someone can convert the Radar Signal indicator: https://www.youtube.com/watch?v=5DmKcy7rb-U  ; to it's TradingView equivalent. Radar signal indicator is the combination of 7 classic MT4 indicators. They include ADX, RSI , CCI , OsMA, ATR, WPR. The indicator shows the values of these indicators in blue and red. Red color indicates a bearish market condition and the blue shows
Hi , i want a indicator that shows the trades history on the chart, just for current day, like : first trade : -54 Second trade : -52 Third trade : +126 , and after three trades, display "No more trades"
AngelShark system
30+ USD
Hello i need someone who can convert a trading view indicator into an mt5 indicator that can work smoothly also need to add an alert on the indicator i will require to test the indicator run it for 1-2days to confirm all is okay thank you
Here's a clearer step-by-step guide to checking the last 50 candles on your chart and applying Fibonacci retracement levels based on their colors: Identify Candle Color: Start from the 100th candle from the left on the chart and check its color. If the 100th candle is green (i.e., the close is higher than the open): Draw a Fibonacci Retracement: From the highest price to the lowest price of this candle. Check the
Here's a clearer step-by-step guide to checking the last 50 candles on your chart and applying Fibonacci retracement levels based on their colors: Identify Candle Color: Start from the 100th candle from the left on the chart and check its color. If the 100th candle is green (i.e., the close is higher than the open): Draw a Fibonacci Retracement: From the highest price to the lowest price of this candle. Check the
项目信息
预算
150+ USD
开发人员
135
USD