类别中的新订单:
30+ USD
30 - 300 USD
30+ USD
30+ USD
工作已完成
执行时间2 天
客户反馈
Andrii did a great job fulfilling the job precisely to expectations. Good coder and will use it again in my next job
指定
I would require and indicator for Metatrader 5 that functions as a dashboard with a Graphic User Inteface. The dashboard alerts for MSS and CISD. If you do not know what these are please do not apply.
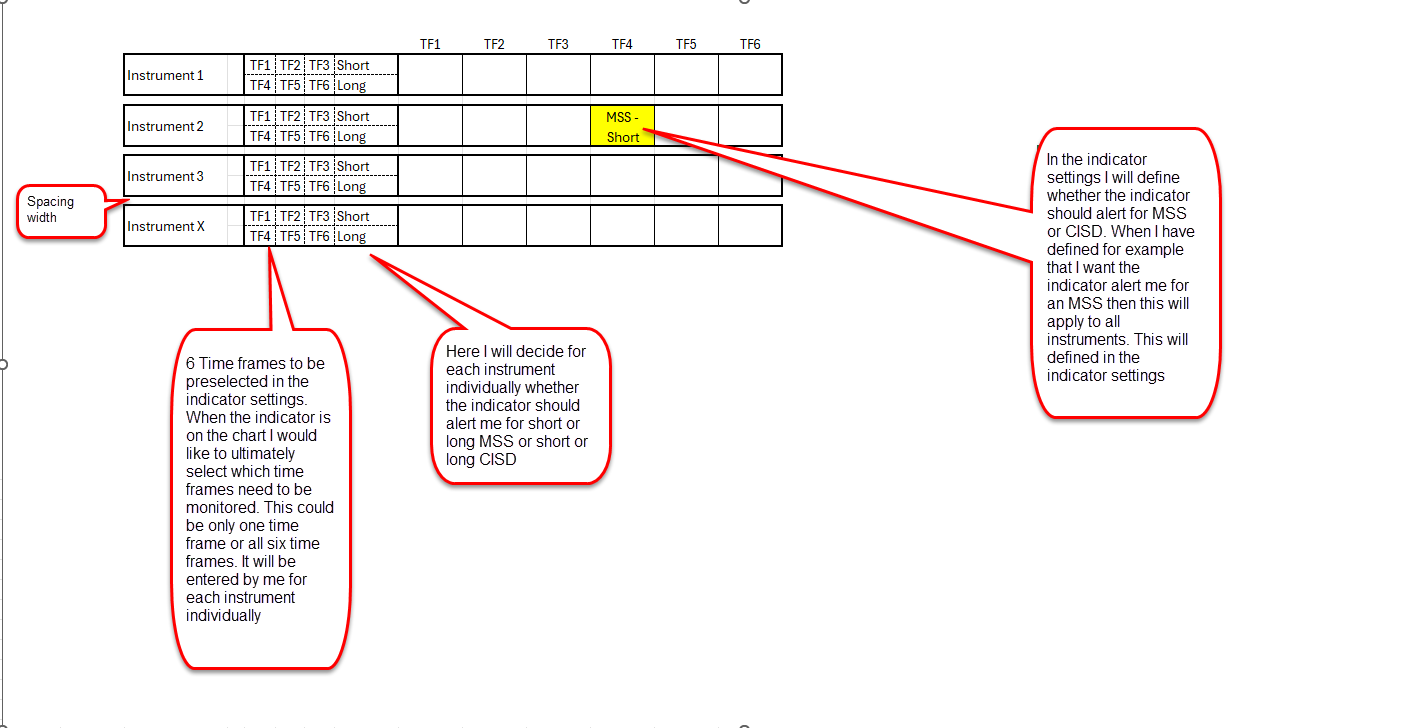
- The dashboard needs to monitor the instruments either for Market Structure Shifts (MSS) aka Change of Character or it should monitor for Change in the State of Delivery (CISD). This should be able to be amendable in the indicator settings.
- The instruments to be monitored are manually entered in the indicator settings.
- The dashboard needs to monitor a maximum of 6 timeframes. The time frames to be monitored should be able to be preselected in the indicator settings. The available options to preselect are the MT5 timeframe options. However the timeframe(s) ultimately used would be selected in the GUI. (Please note that I might only want to ultimately select one time frame in the GUI).
- The dashboard needs to alert me only when it is in line with the direction I tell it to monitor for each instrument individually in the GUI.
- The dashboard look needs to be amendable in the settings such as font size, cell colors, font color, cell height, cell width, spacing between cell rows, alert cell color, alert cell font, alert cell font size
- An MSS alert or an CISD alert should only be made if
- the MSS or CISD is in the same direction then what has been selected before in the GUI
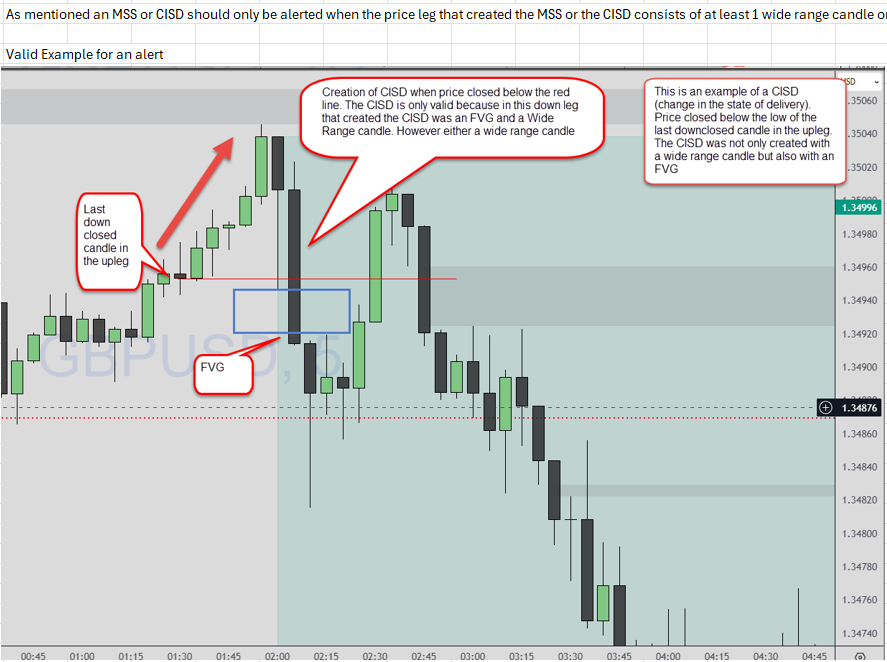
- the MSS or CISD is only valid when in the leg where the MSS or the CISD was create at least either one displacement candle (wide range candle) or an FVG was present.
- What is a wide range candle
- a wide range candle is a candle that is at least x percent bigger than the average of the last x days. ( these settings should be changeable in the indicator settings)
- a wide range candle should close at least x percent within the low ( bearish candle ) or x percent within the high ( bullish candle). For example a bullish candle that closes at 100% within the high is a candle where the high price and the close price is the same. A 90 percent candle is a candle where the close price is 10% lower than the high price
- What is an FVG
- am FVG is a 3 candle formation. A bullish example is where the high of candle 1 does not touch the low of candle 3. A bearish example is where the low of candle 1 does not touch the high of candle 3.
Please see attachment for GUI example
Please also find an attachment for a valid alert trigger using a Change in the State of Delivery example.
反馈
1
等级
项目
336
29%
仲裁
36
28%
/
64%
逾期
10
3%
繁忙
2
等级
项目
20
15%
仲裁
5
40%
/
40%
逾期
0
空闲
3
等级
项目
180
46%
仲裁
3
33%
/
33%
逾期
1
1%
工作中
4
等级
项目
27
7%
仲裁
9
33%
/
33%
逾期
1
4%
工作中
5
等级
项目
0
0%
仲裁
0
逾期
0
空闲
6
等级
项目
317
24%
仲裁
23
35%
/
13%
逾期
23
7%
空闲
发布者: 3 代码
7
等级
项目
31
13%
仲裁
13
0%
/
77%
逾期
9
29%
空闲
8
等级
项目
22
41%
仲裁
8
0%
/
50%
逾期
3
14%
空闲
9
等级
项目
35
23%
仲裁
4
0%
/
50%
逾期
2
6%
工作中
10
等级
项目
444
55%
仲裁
22
55%
/
14%
逾期
30
7%
已载入
11
等级
项目
565
35%
仲裁
81
31%
/
44%
逾期
204
36%
空闲
12
等级
项目
1
0%
仲裁
0
逾期
0
空闲
13
等级
项目
246
74%
仲裁
7
100%
/
0%
逾期
1
0%
空闲
发布者: 1 文章
14
等级
项目
1
100%
仲裁
3
0%
/
100%
逾期
0
空闲
15
等级
项目
478
40%
仲裁
105
40%
/
24%
逾期
82
17%
已载入
发布者: 2 代码
16
等级
项目
0
0%
仲裁
0
逾期
0
空闲
17
等级
项目
2940
63%
仲裁
124
44%
/
26%
逾期
429
15%
工作中
相似订单
MT5 Expert Advisor
30+ USD
I have developed a custom semi-automated MT5 trading workflow for personal use. I am available to discuss its technical implementation, automation features, and overall workflow with developers or traders interested in similar solutions. The project includes MT5 automation, Telegram communication, trade execution tools, and configurable risk management components. If you are working on a similar project or looking
Hello, I need a custom Expert Advisor for MetaTrader 5. I am trading from mobile only. **Account & Style:** - Capital: $5,000 - $10,000 - Risk: Moderate/Balanced - Trading Style: Scalping **Pairs & Timeframe:** - Symbols: EURUSD and XAUUSD - Timeframe: M5 **Strategy:** - BUY: RSI(14) < 30 AND Price > 20 EMA - SELL: RSI(14) > 70 AND Price < 20 EMA - Only 1 trade per symbol at a time - No Martingale / No Grid **Risk
> "I am looking for a reliable and profitable Expert Advisor (EA) or trading robot for MetaTrader. The EA should have a proven track record, good risk management, and stable performance in live market conditions. Please share the name of the EA, a brief explanation of how its strategy works, and any relevant performance statistics or backtest reports to help me evaluate it."
We are seeking an experienced MQL4/MQL5 programmer to develop a high-performance, fully automated Expert Advisor (EA). The bot must execute a sophisticated multi-currency hedging strategy across correlated forex pairs. Key Responsibilities Develop Multi-Currency Logic : Build an EA capable of scanning and trading multiple currency pairs simultaneously from a single chart or setup. Implement Hedging Strategy : Code
I am looking for an experienced MetaTrader 5 expert. I already have 3 MT5 trading accounts. I need someone to: 1. Help me choose a reliable Windows VPS. 2. Connect to my VPS remotely (AnyDesk or TeamViewer). 3. Install 3 MetaTrader 5 terminals. 4. Configure: - 1 Master Account - 2 Slave Accounts 5. Install and configure a professional Trade Copier. 6. Copy all trades from the Master account to both Slave
I have an MT4 custom indicator (.ex4) that I use regularly, and I would like an identical MT5 version. Important: I do not have the source code (.mq4). I only have the compiled MT4 indicator. I am looking for an experienced MQL developer who can recreate the indicator's functionality and appearance for MT5 by analyzing its behavior. The MT5 version should match the MT4 version as closely as possible, including
Mac200
50+ USD
I need a Trend following Bot. Here we took entries by looking at two indicator which are 200 period ema and 12 26 9 MacD. Rules for entry exit are: Buy trade: When market is above 200 ema and MacD Line cross over the signal line and this cross over happened below the zero line of MacD indicator. We simply put Buy trade. Sell trade: When market is below 200 ema and MacD line crosses below the signal line and this
Multiple times EMA Crossing robot with smart entry
50 - 100 USD
I I would like to create a trading robot based on 2 ema crossing. The robot is pretty simple, it should open buy position when fast ema cross slow ema and vise versa. Also it should use martingale after the loss position. It should has expiration period inside the code and alerts l
1. The general process is: Automated online forex marketing to find potential clients -> Answering potential clients' questions -> Converting them into actual clients -> Opening accounts, depositing funds, and copying trades. 2. Developers could implement an AI Digital Twin/Shadow Agent to answer customer questions, eliminating the need for me to answer customer inquiries. 3. I have a CTA website and I'm manually
Iconic Boy
300 - 400 USD
Am looking for a bot to trade .so that I can be able to trade and become very successful and make some profit so that I cannot sleep on a empty stomach
项目信息
预算
90 - 120 USD
截止日期
从 1 到 3 天