 全部订单
全部订单
 规则
规则
指定
READ CAREFULLY And if you have done 50 projects before then apply others i will reject
🔺 BUY Signal (Boom Market)
✅ Pattern Formation (Spike-Based Buy Setup)
-
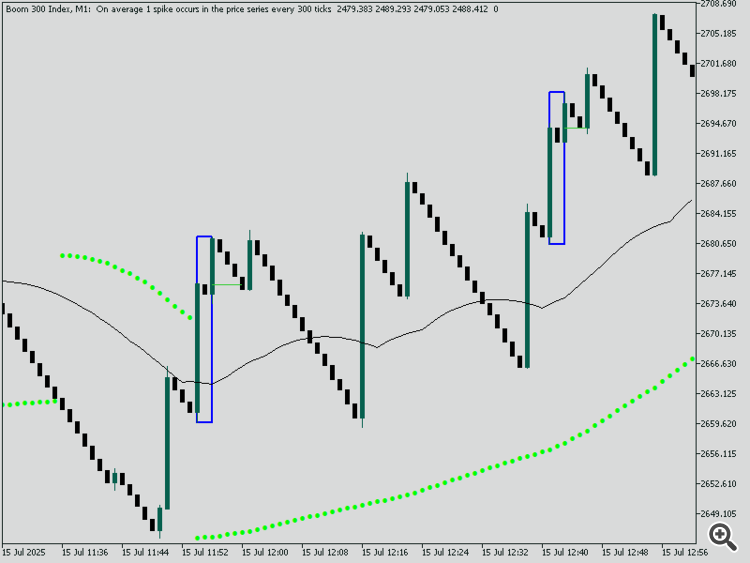
First Spike: Large bullish spike candle.
-
Mitigation Candle: Small bearish candle inside or partially inside the bullish spike.
-
Second Spike: Another bullish spike that follows the mitigation.
-
When price returns back to the zone of the mitigation candle, a BUY signal arrow is drawn.
🔹 Mitigation Line:
Draw horizontal line at open/close of the mitigation candle.
-
Must be toggleable ( true/false ) in inputs.
-
Color: Green for Buy setups.
-
Label: “Mitigation Zone”.
📊 Confirmation Conditions for RSI ARROW SIGNAL (All Must Be True to Display Arrow)
These conditions must be met for RSI-based Buy arrow to appear:
-
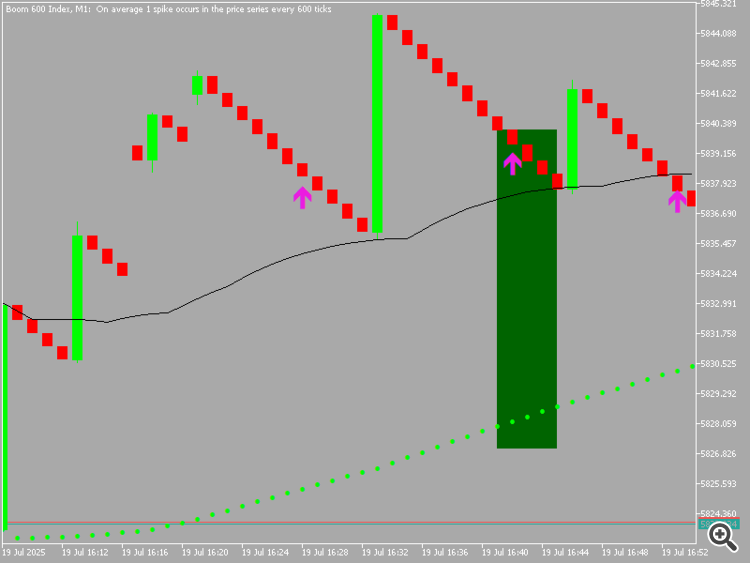
✅ Price is above the 50 EMA
-
✅ Parabolic SAR dots are below price
-
✅ RSI is below 30 (oversold) or value selected in input
🔧 Inputs should allow:
-
Custom RSI level (default 30 for Buy)
-
Toggle ON/OFF for RSI signal display
-
Toggle ON/OFF for SAR and EMA confirmations
-
📈 ZigZag Structure Logic (Common to Both Buy/Sell)
Include advanced structure detection via ZigZag:
-
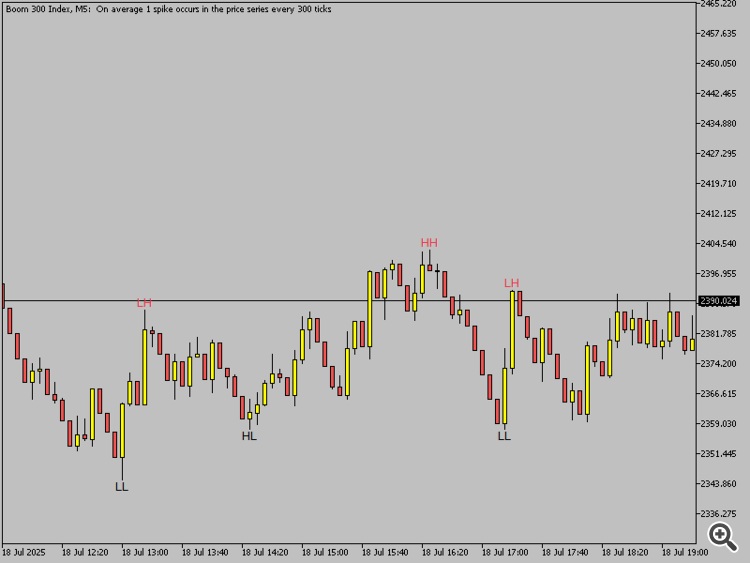
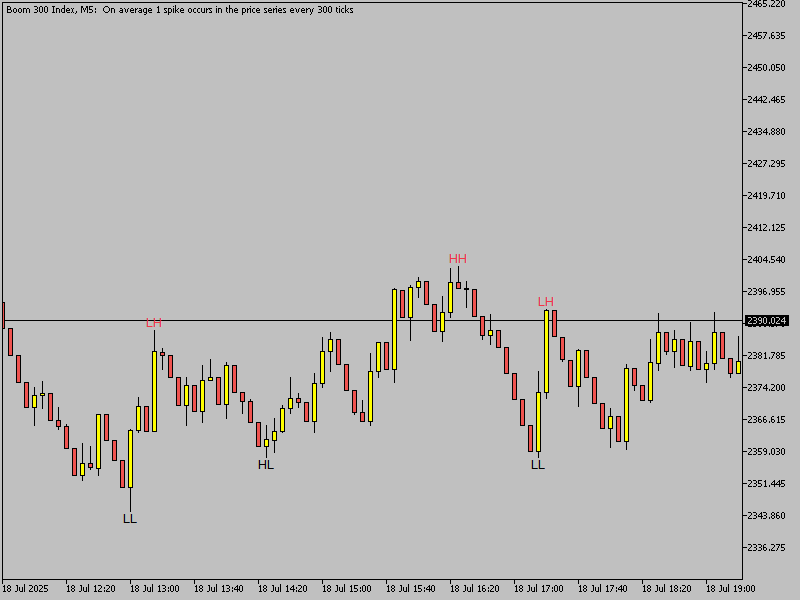
Draw HH, HL, LH, LL based on ZigZag points
-
-
Color-coded structure levels:
-
Green = Bullish (Buy direction)
-
Red = Bearish (Sell direction)
-
-
Break of Structure (BOS):
-
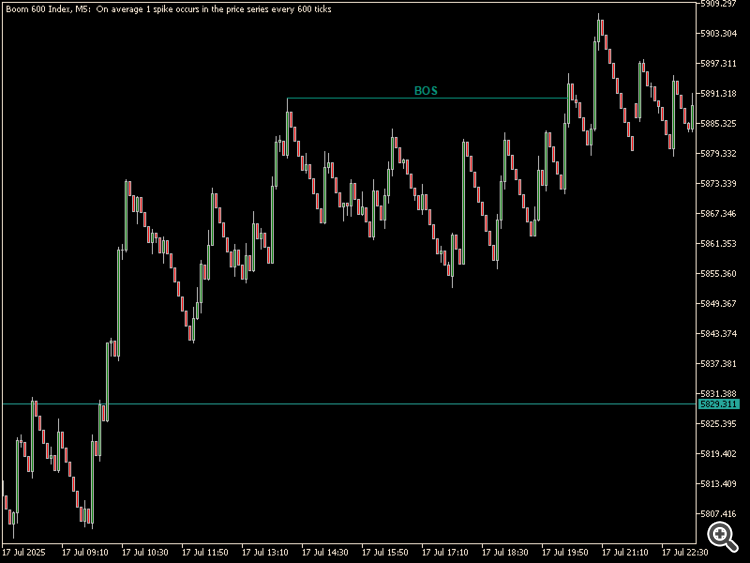
Price breaks above HH → Bullish BOS
-
Price breaks below LL → Bearish BOS
-
-
-
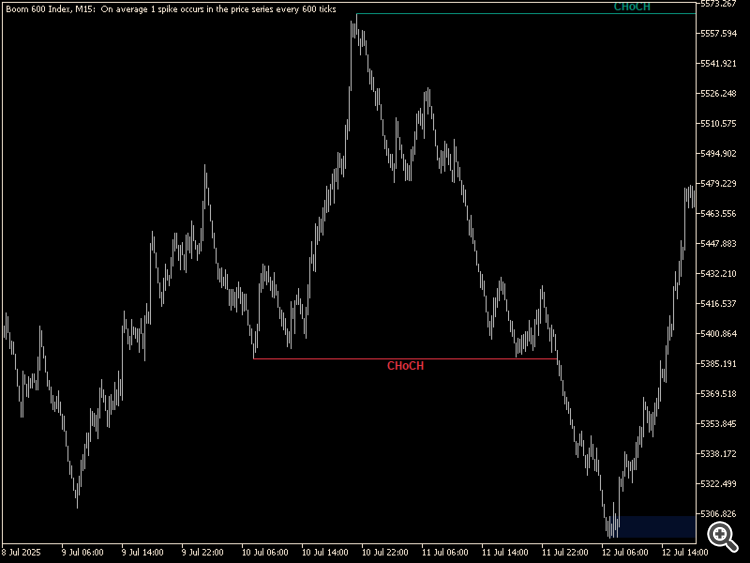
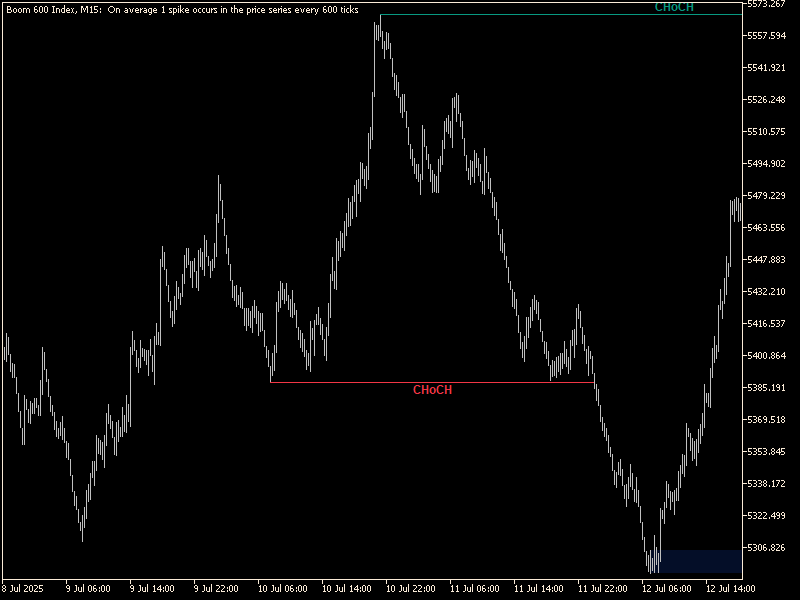
Change of Character (CHOCH):
-
In downtrend: price breaks previous LH → Bullish CHOCH
-
-
In uptrend: price breaks previous HL → Bearish CHOCH
-
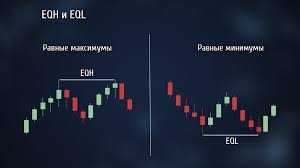
DRAW 4 CANDELS RULE BASED EQH EQL
-
-
⚙️ Inputs Must Include:
-
-
Toggle for BOS / CHOCH ON/OFF
-
Toggle structure text ON/OFF
-
Font size and color selectors
-
Distance from price (vertical offset)
🧭 Dashboard (For Both Buy/Sell)
Positioned top-left or custom (user-defined), small and clean panel showing:
| 📋 Parameter | 🟢 BUY / 🔴 SELL Logic |
|---|---|
| Symbol Name | Current chart symbol |
| Last Signal Count | Number of last valid signals |
| Trend (Highs/Lows) | HH/HL = Buy, LH/LL = Sell |
| CHOCH / BOS | Bullish or Bearish |
| EMA Trend | Price above/below 50 EMA |
| RSI Condition | RSI < 30 or RSI > 70 |
| Mitigation Signal | Yes/No (if zone formed and price returned) |
📌 Each block must be color-coded, with green for bullish/buy, and red for bearish/sell.
🕹️ Dashboard Inputs:
-
Show/hide each row
-
Enable/disable dashboard
-
Font color and background color
-
Corner location (TL/TR/BL/BR)
⚙️ General Inputs (Full Control):
| Feature | Input Parameter |
|---|---|
| Enable RSI Signals | true/false |
| RSI Level for Buy | Default 30 |
| RSI Level for Sell | Default 70 |
| Enable Mitigation Logic | true/false |
| Show Mitigation Lines | true/false |
| Enable ZigZag Structure | true/false |
| Show BOS/CHOCH Labels | true/false |
| Enable Dashboard | true/false and eqh and eql option also |
Summary of Signal Triggers
| Type | Conditions Met |
|---|---|
| BUY Arrow | Mitigation Buy Pattern detected (if enabled) OR RSI confirmation (if enabled), AND all RSI conditions met (SAR below, EMA above, RSI < 30) |
| SELL Arrow | Mitigation Sell Pattern detected (if enabled) OR RSI confirmation (SAR above, EMA below, RSI > 70) |
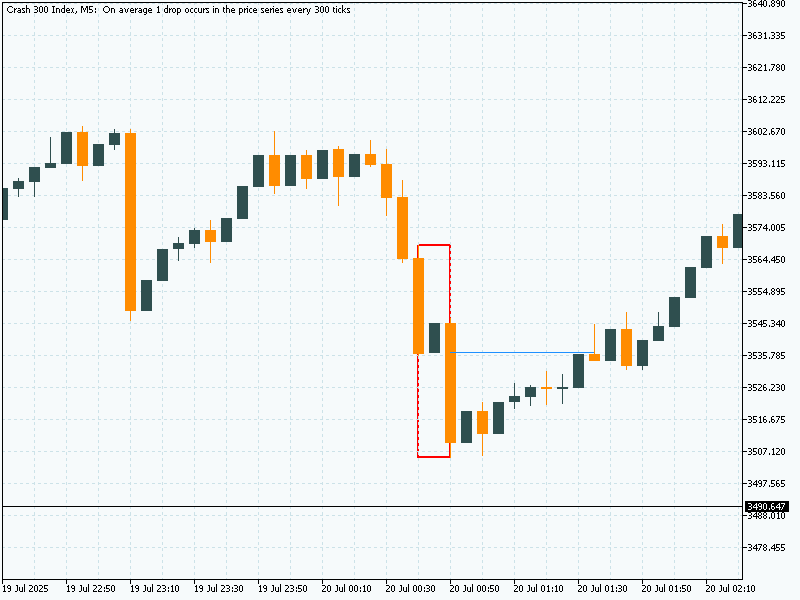
🔻 SELL Signal (Crash Market)
✅ Pattern Formation (Spike-Based Sell Setup)
-
First Spike: Large bearish spike candle.
-
Mitigation Candle: Small bullish candle inside or partially inside the bearish spike.
-
Second Spike: Another bearish spike follows the mitigation candle.
-
When price returns back to the zone of the mitigation candle, a SELL signal arrow is drawn.
🔸 Mitigation Line:
Draw a horizontal line at open/close of the mitigation candle.
-
Must be toggleable ( true/false ) in inputs.
-
Color: Red for Sell setups.
-
Label: “Mitigation Zone”.
📉 Confirmation Conditions for RSI ARROW SIGNAL (All Must Be True to Display Arrow)
These conditions must be met for RSI-based Sell arrow to appear:
-
✅ Price is below the 50 EMA
-
✅ Parabolic SAR dots are above price
-
✅ RSI is above 70 (overbought) or value selected in input
🔧 Inputs should allow:
-
Custom RSI level (default 70 for Sell)
-
Toggle ON/OFF for RSI signal display
-
Toggle ON/OFF for SAR and EMA confirmations
-
📈 ZigZag Structure Logic (Common to Both Buy/Sell)
Use ZigZag to detect and draw structure:
-
Draw LL, LH, HL, HH from ZigZag swings
-
Color-coded structure levels:
-
Red = Bearish (Sell direction)
-
Green = Bullish (Buy direction)
-
-
Break of Structure (BOS):
-
Price breaks below LL → Bearish BOS
-
Price breaks above HH → Bullish BOS
-
-
Change of Character (CHOCH):
-
In uptrend: price breaks previous HL → Bearish CHOCH
-
In downtrend: price breaks previous LH → Bullish CHOCH
-
⚙️ Inputs Must Include:
-
Toggle BOS / CHOCH ON/OFF
-
Toggle structure text ON/OFF
-
Font size, line width, and color options
-
Vertical offset from price
🧭 Dashboard (For Both Buy/Sell)
Positioned in any user-defined corner (e.g., top-left), a clean panel showing:
| 📋 Parameter | 🔻 SELL Logic Description |
|---|---|
| Symbol Name | Current chart symbol |
| Last Signal Count | Number of last valid Sell signals |
| Trend (Highs/Lows) | LH/LL = Downtrend |
| CHOCH / BOS | Bearish CHOCH/BOS |
| EMA Trend | Price below 50 EMA |
| RSI Condition | RSI > 70 (or custom) |
| Mitigation Signal | Yes/No (if price reentered zone) |
🧩 Color Themes:
-
Red highlights for Sell, with neutral or black/white text
-
Each section of the dashboard is toggleable
📌 Inputs for Dashboard:
-
Enable/disable dashboard
-
Font style, size
-
Color theme (background/foreground)
-
Show/hide specific rows
⚙️ General Inputs (Full Control):
| Feature | Input Parameter |
|---|---|
| Enable RSI Signals | true/false |
| RSI Level for Sell | Default 70 |
| RSI Level for Buy | Default 30 |
| Enable Mitigation Logic | true/false |
| Show Mitigation Lines | true/false |
| Enable ZigZag Structure | true/false |
| Show BOS/CHOCH Labels | true/false |
| Enable Dashboard | true/false ENABLE DISABLE EQH EQL |
🎯 Summary of SELL Signal Trigger
| Type | Conditions Met |
|---|---|
| SELL Arrow | Mitigation Sell Pattern detected (if enabled) OR RSI confirmation (if enabled), AND all RSI conditions met (SAR above, EMA below, RSI > 70) |