 全部订单
全部订单
 规则
规则
指定
Hello Everyone,
I am seeking for serious and immediately available Programmers to create an Expert advisor for me on MT4.
I want to create a robot that will make use of the first candle (after installation) to project for future BUYs and SELLs using the Highest and Lowest Prices of the candlestick of the timeframe selected.
The concept will consider LOWEST and HIGHEST PRICE positions and then take Actions by BUYING and SELLING using the REVERSAL AND DIRECTION PRICES over a period of time.
After the first candle is achieved, their will be a gap interval for taking bids towards a direction. The High Price will be used to project and take the SELLING bids, while the Low price will be used to take the BUYING bids.
Their will be a maximum position expected for each extreme to take their bids. So as a BUYER it will use lowest prices achieved to date to take bids up till the maximum level of price range for it to take the bids, and same as a SELLER, it will use the Highest prices to take SELL bids.
Their will be a Direction and Reversal gap for bids to be activated for both HIGHEST and LOWEST PRICES.
For the HIGH PRICE, the ACTION is a SELL, But the SELL can be below or above the current Highest Price, So for the Direction, the SELL will be BELOW and for the Reversal, the SELL will be ABOVE the current HIGHEST.
Same for the LOW PRIE, the ACTION is a BUY, But the BUY can be below or above the current Lowest Price, So for the Direction, the BUY will be ABOVE and for the Reversal, the BUY will be BELOW the current LOWEST.
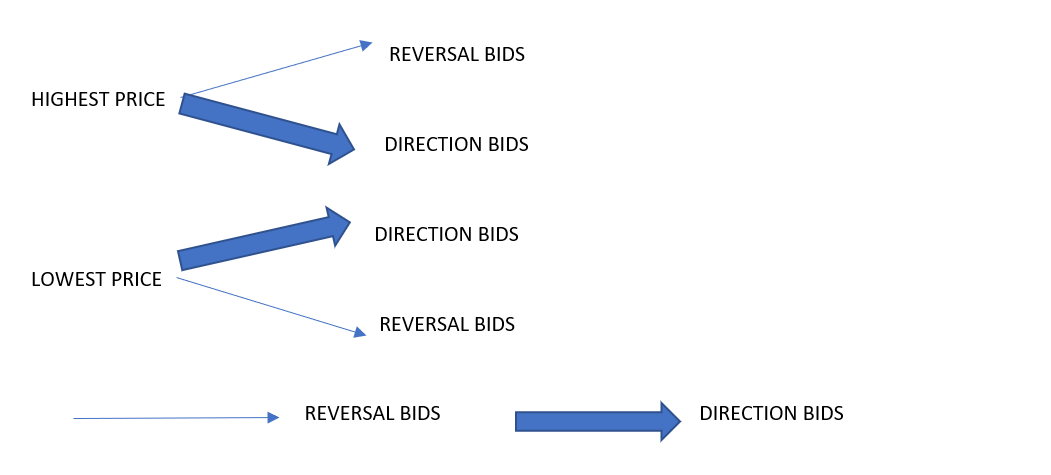
Every previous extreme will be the maximum position for the OPPOSITE BID.
Also the Lowest price will calculate an EXT bid which will be part of the variable. The EXT bid will use the EXTREME Positions of the First static price to take bids towards the direction before the middle price which will be between the Highest and Lowest position. So for Lowest Price, it will calculate EXT bids as BUY upwards and for Highest Price, it will calculate EXT bids downwards. The BUY EXT Bids must be activated below the current mid-price and same with the SELL EXT Bids must be activated above the mid-price.
For EXAMPLE: If prices for first candle has a High of 100 and Low of 90, and gap for direction is 3 and reversal is 10. And EXT is 7
HIGHEST PRICE=100., Then REVERSAL SELL will be 100+10= 110, while the DIRECTION SELL will be 100-3= 97, 94, 91, 88, 85 etc. Also the EXT bid will be calculated using the Highest price less the GAP eg 100-7 = 93. But because the mid price between the HIGHEST and LOWEST is 95, the EXT BID will not activate until it is above the midpoint for a SELL and below the midpoint for a BUY. The LOWEST DIRECTION BIDS ACTIVATED, will then become the BASIS for calculating the REVERSAL bids using the REVERSAL GAP UPWARDS, while the HIGHEST PRICE will be used to activate new DIRECTION SELL BIDS downwards using the DIRECTION gaps. So in the example, if reversal bids of 110 activated first before any SELL direction bids, then the HIGHEST price after the bid will be used to calculate the DIRECTION HIGH SELL. However, if the DIRECTION HIGH BID activated a SELL first, then the LOWEST SELL PRICE will be used to plan for FUTURE REVERSAL SELL BIDS. So if prices fall from 100 to 88 first, then it will activate SELL at 97, 94, 91 and 88. Then FUTURE REVERSAL SELLs will then be 88+10= 98, 108, 118, 128 etc until maximum bid is reached or till end of trading period.
LOWEST PRICE=90., Then REVERSAL BUY will be 90-10= 80, while the DIRECTION LOW BUY will be 90+3= 93, 96, 99, etc. Also the EXT bid will be calculated using the Lowest price plus the GAP eg 90+7 = 97. But because the mid price between the HIGHEST and LOWEST is 95, the EXT BID will not activate until it is below the midpoint for a BUY and above the midpoint for a SELL. The HIGHEST DIRECTION BIDS ACTIVATED, will then become the BASIS for calculating the REVERSAL bids using the REVERSAL GAP DOWNWARDS, while the LOWEST PRICE will be used to activate new DIRECTION BUY BIDS upwards using the DIRECTION gaps. So in the example, if reversal bids of 80 activated first before any BUY direction bids, then the LOWEST price after the bid will be used to calculate the DIRECTION LOW BUY. However, if the DIRECTION LOW BID activated a BUY first, then the HIGHEST BUY PRICE will be used to plan for FUTURE REVERSAL BUY BIDS. So if prices fall from 90 to 80 first, then it will activate BUY at 80+3=83, 86, 89, 92, 95 and 98 ETC. Then FUTURE REVERSAL BUYS will then be HIGHEST -10 etc until minimum bid is reached or till end of trading period
NB: Every LOWEST PRICE updated after the candle stick/ time frame will always be used to take DIRECTIONAL BUYS, while EVERY HIGHEST PRICE updated after the candle stick/ time frame will always be used to take DIRECTIONAL SELLS.
NB: ALL DIRECTION BIDS MUST CLOSE AFTER ACTIVATING A NEW ONE FOR EVERY TREND MOVE. So anytime the DIRECTION BIDS activates, it must close all previous ones after taking a new one of same direction to avoid all previous ones going to losses.
MAXIMUM NUMBERS OF BOTH DIRECTIONAL AND REVERSAL BIDS MAY BE STIPULATED.
EXAMPLE 2
Directional gap = 1, Reversal gap=5, Number of Directional bids is 10, Number of Reversal bids is 4. EXT is 2.5
Starting candle HIGH is 60, and LOW is 57.
HIGHEST SELL DIRECTION= 60-1=59, 58, 57, 56, 55, 54, 53 ETC. IF REVERSAL Bid of 60+5=65 didn’t activate first, then the last direction bid to activate will be used to take the REVERSAL HIGH SELL upwards at 53+5=58, 63, 68, 73 etc. Until maximum Directional and Reversal bids is achieved. Also First EXT gap is 2.5, so because for now the EXT bid is 60-2.5=57.5, and it is below the midpoint of 58.5( ie 60+57/2) then it will not activate the EXT SELL. But rather it will be a BUY at 57.5
LOWEST BUY DIRECTION= 57+1=58, 59, 60, 61, 62 ETC. IF REVERSAL Bid of 57 -5=52 didn’t activate first, then the last direction bid to activate will be used to take the REVERSAL LOW BUY downwards at 62-5=57, 52, 47, 42 etc. Until maximum Directional and Reversal bids is achieved. Also First EXT gap is 2.5, so because for now the EXT bid is 57+2.5=59.5, and it is above the midpoint of 58.5( ie 60+57/2) then it will not activate the EXT BUY. But rather it will be a SELL at 59.5
Please Note
I want only serious and immediately available programmers as time is essential.
I will have the following as it relates to the EA
- Source code
- Ownership and Copyright of code
- EA should have a Password input
- I will need as much as 3 weeks to test the accuracy of robot before finalizing payment
- Robot should be usable on any product, currency, indices or stock