 全部订单
全部订单
 规则
规则
工作已完成
指定
I would like to improve my previous indicator (Percentage Price Oscillator).
Because the existing version got too many bug, so i will directly give you the formula and you can make the improvement as mention below.
====================================================================================
Abnormal candlestick size measurement
Use Price increment as source of the data.
Source code: (https://www.mql5.com/ru/code/18896)
The origanl equation is to calculate the price difference between current close price and previous close price. I want to make slight change3 new changable mode of calculation (only show 1 mode type at a time - changable in setting)
- Current open to high low
- When close > oprn (bull candle) = high - open (Show +ve histogram)
- When close < open (bear candle) = low - open (Show -ve histogram)
- When close = open (doji candle) = Reference to prevous candle. (If is bull, then it consider this candle as bull = +ve histogram)
- ATR period = (1) / High to low of current candle
- Bull candle = ATR (1) +ve histogram
- Bear candle = ATR (1) - ve histogram
- Doiji = Reference to prevous candle. (If is bull, then it consider this candle as bull = +ve histogram)
- Current high or low to a moving average
- Moving aveage = EMA (2), Price Typical, shift 0
- Above MA = High to MA distance (+ve histogram)
- Below MA = Low to MA distance (-ve historgram)
Colour settings
+ve histogram = DarkGreen
-ve histogram = Maroon
Histogram size = 2
Peak capturing algorithm
Here I want to use 3 changable mode to capture abnormality (only show 1 mode type at a time - changable in setting)
- Standard diaviation (SD) band on the data above
- Mean Period = 400
- Standard deviation (Seperate up and down as I need adjustment later, but this is the default)
- Up = 2.0
- Down = 2.0
- I want to filter outlier in the standard deviation and mean calculation
- Setting: Filter outlier = True
- Any value outside +- 2.698 SD is consider as outlier
- Approach = ignore it as part of meand and SD calculation
- Eg. 400 data initially, 5 discovered to be larger than +-2.698 SD
- 400-5 = 395 (only 395 data will take to count mean and SD)
- The 395 mean and SD will plotted in the 1 bar before current bar data
- It is a rolling standard deviation and mean calculation, but it will not count on the current candle before it close
- Hence current bar SD and mean just copy from previous
- Based on time zone
- 3 major timezone (in 24 hour format)
- Tokyo = 00 - 08
- London = 08 - 13
- New York = 13 - 22
- Note: No overlap. Is from hour = 00 to hour < 08 and so on
- 22 to 00 will be the last final one. ( Please check 22 to the next 01 in case day light saving changed this will no occur any problem)
- Calculate the mean data within this time zone for the past (400 sample size)
- For example London = 08-13. The indicator scan all the way back to past 400 history within 08-13 hours to find out the mean value.
- Then SD (using the same 2 up and 2 down SD setting as above) is calculted around the mean and each indicator data
- Similarly, current mean and SD will not calculate but copy forward from the last bar
- Note: must robust usable in forex and non-forex market
- Based on reset timeframe
- Same as VWAP reset time = Daily, week, month, quater, year
- Mean line is just normal average with respect to the indicator data
- SD based on mean to the indicator data with 2.0 SD on top and bottom (follow the SD settings on 1)
- No need button, just allow to set the reset Time on the settings
- A verticle line in the indicator is drawn to show the place where it reset the time
When the indicator is outside of the standard deviation band, a (white) dot will be marked on the indicator as well as the price chart.
Note: Some time the market is new to the broker and only have limited number of candle. In backtesting as well, the max candles i believe is 999. Hence in case insufficient data, it will take whatever posible
Note: When current price break toward outside of SD bands, an alert (Option = ) will 1. pop out, or just 2. play sound with textin the expert tab, or 3. just in the expert tab or 4. totally do nothing (Default = OFF).
Save the data
- Can store the value into excel for further analysis.
-
Having the setting to export the data out and store in CSV. The indicator value for the past 500 candles will be first store. The CSV will continue append the latest data every new data. The required data are:
- Symbol
- Broker time
- Local Time
- High price
- Low price
- Close price
- Indicator calculated data
- Mean
- Standard deviation
- Outside SD? (TRUE/FALSE)
When the export setting is true, create a "Debugging" Yellow text at the top right of the chart so I know the CSV is collecting.
The file name is following the format: custom_name ( Default=PI_Indi) + Indicator calc mode+ broker short name + symbol + date (year.month.day)
Expected input in the settings
Indicator settings--------------------------
Calculation mode
- Open to High Low
- Current ATR
- Moving Average to High Low
MA type = EMA
MA period = 2
Price = Typical
Peak capture settings--------------------------
Peak capture mode
- Standard deviation (SD - rolling)
- Time zone
- Timeframe reset period
Standard deviation settings--------------------------
Mean period = 400
SD up = 2.0
SD down = 2.0
Filter outlier = true
Outlier SD = 2.698
Time zone settings--------------------------
Time zone 1 = 00
Time zone 2 = 08
Time zone 3 = 13
Time zone 4 = 22
Timeframe settings--------------------------
Timeframe = Daily / Weekly / Monthly / Quaterly/ Yearly
Custom Design settings--------------------------
Dot -- ??? Anything?
Export settings--------------------------
Export = False
Note: A 0 level line is needed.
Note: The indicator must able to run in backtesting
Source code is needed by the end of the project.
===================================================================================================
Things that I want to improve
- Adaptive Peak Capture algorithm
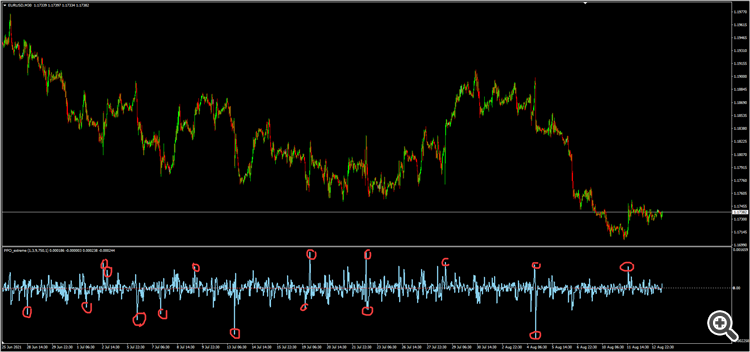
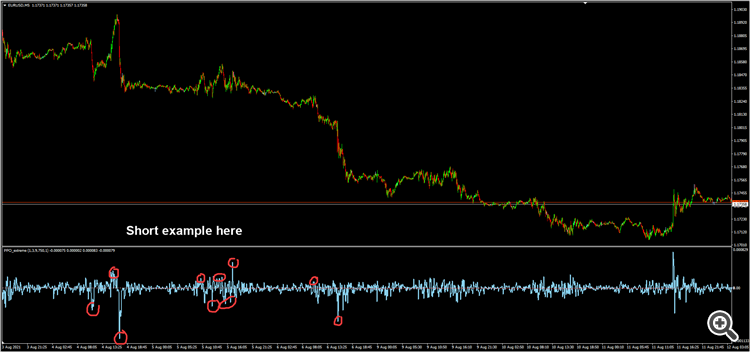
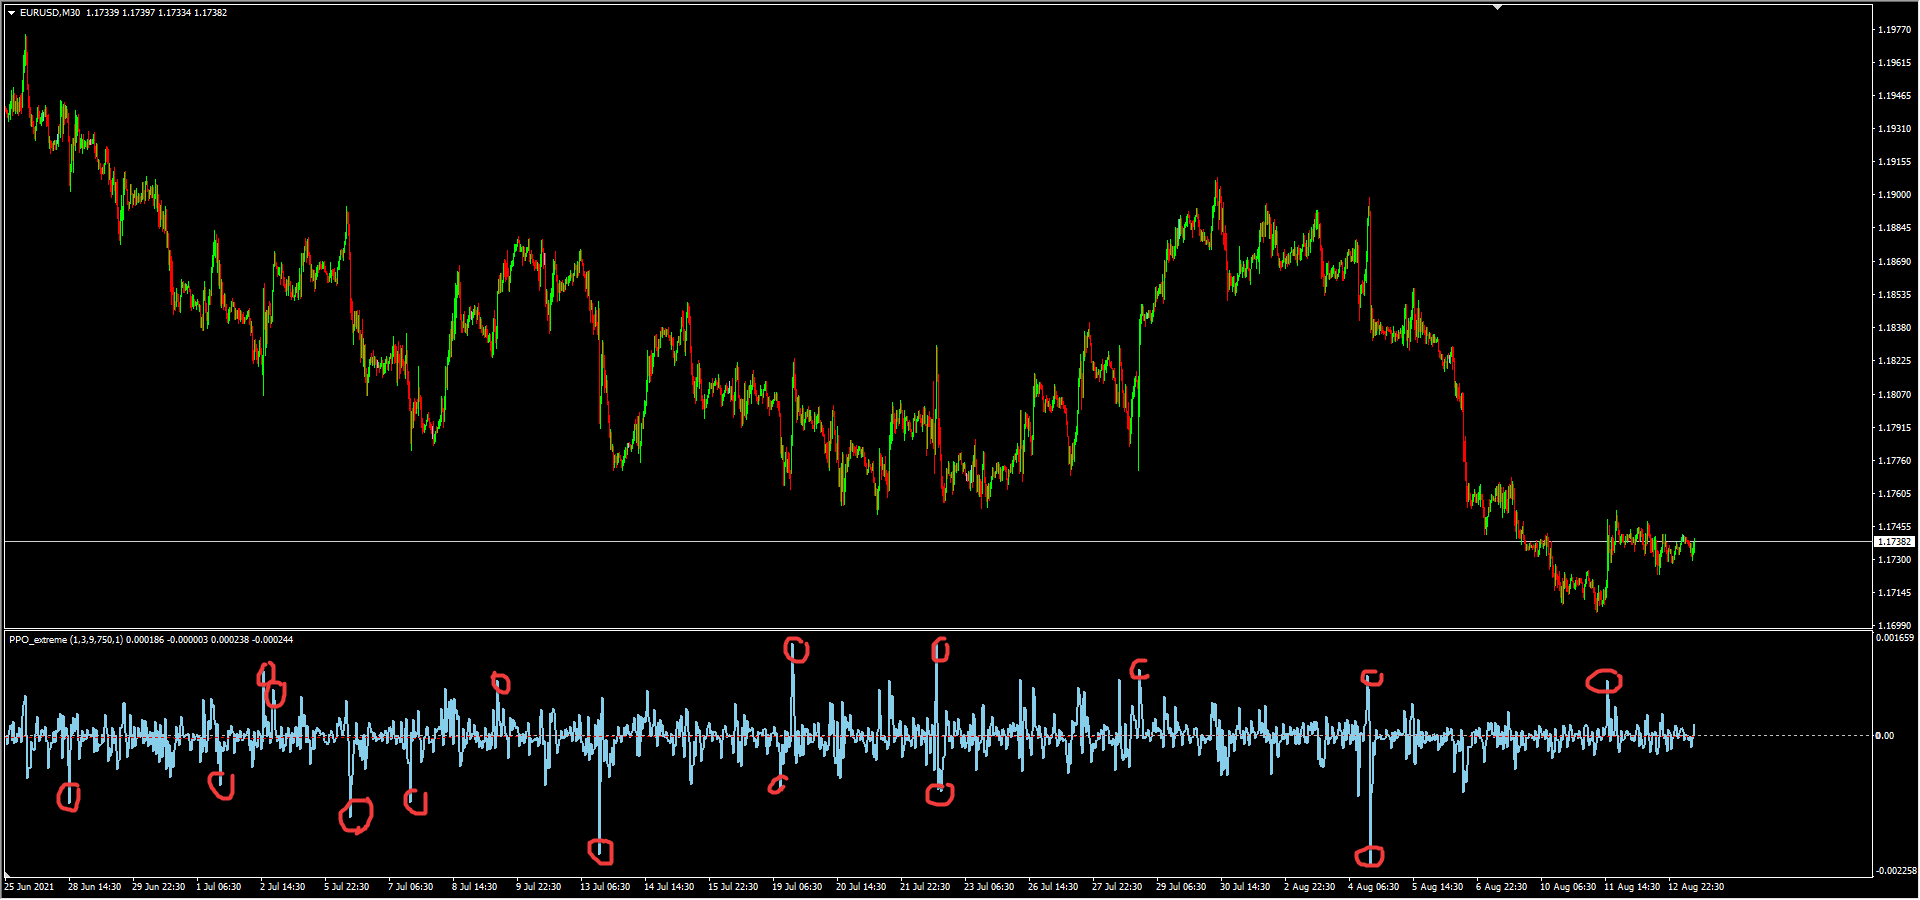
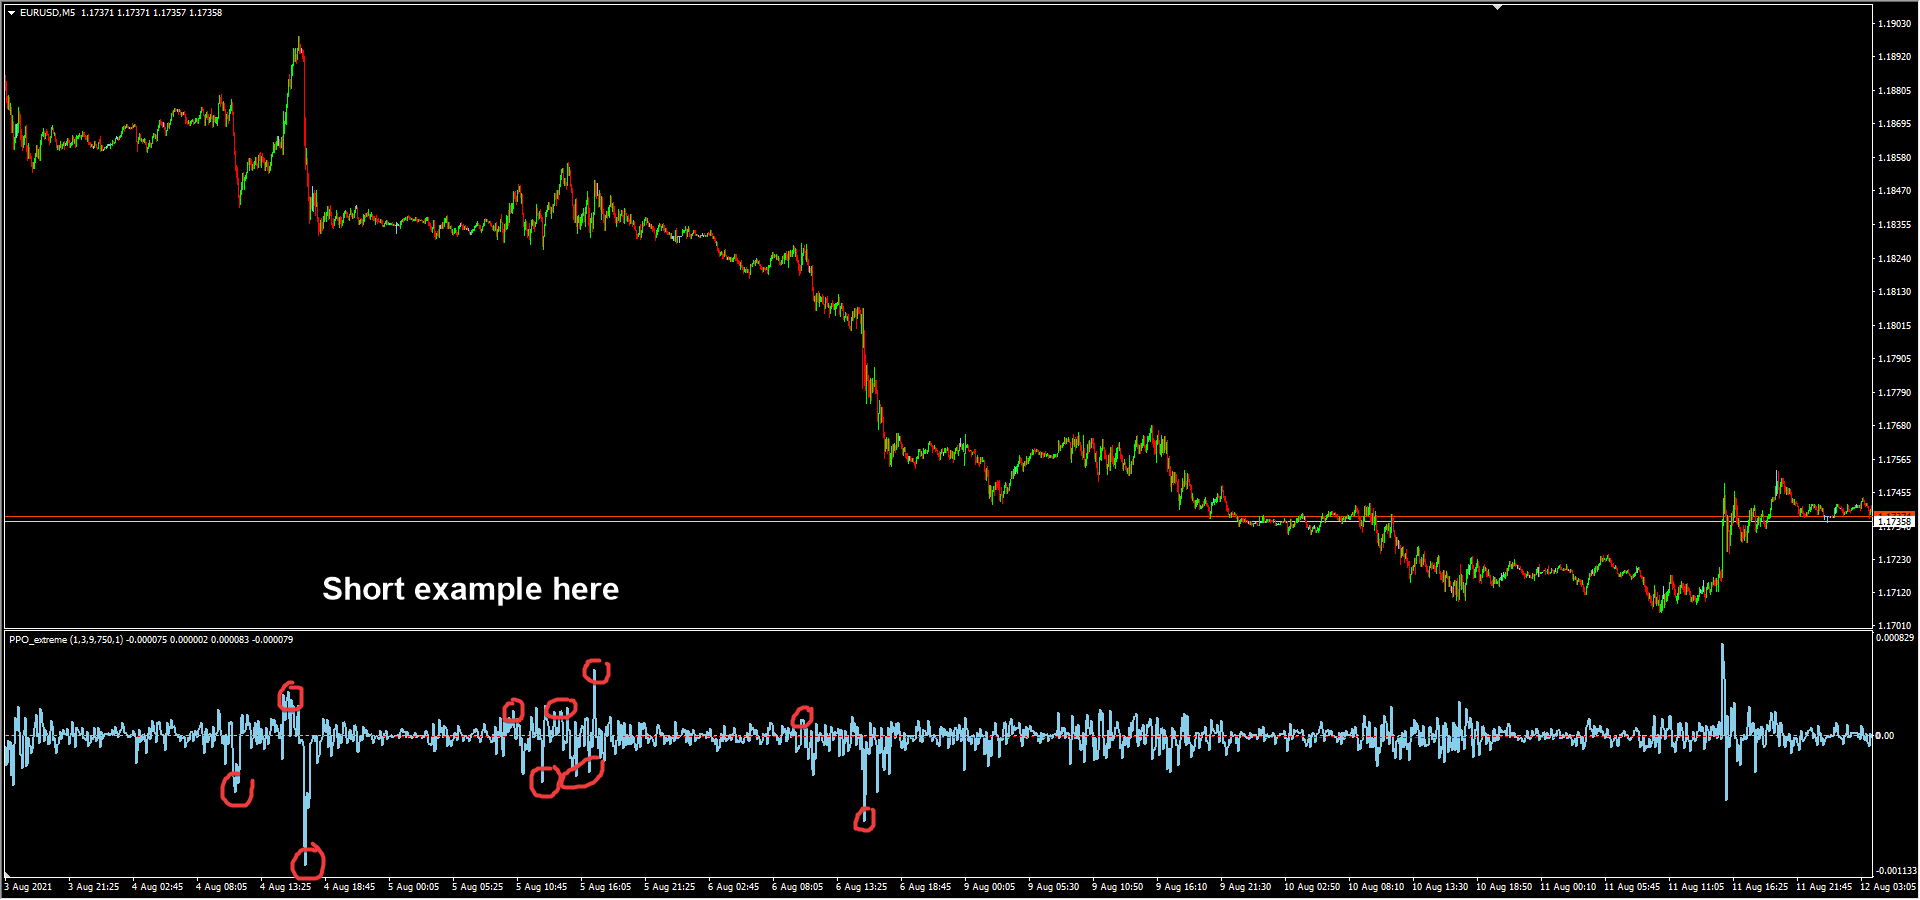
- I need an algorithm that can automatically detect if the current price is a spikes (abnormality) or not. See the Picture below, the one that been circled is the peak that I want to capture
- I do not want reprint result.
- I do not want static value (NOT ABOVE/BELOW XX NUMBER). I want the algorithm able to capture that peak robustly. Because the indicator value can some time range big some time small. So the algorithm have to adapt to the indicator value.
- When measured to have a peak, highlight it with rectangular object.
- At TOP = clrMaroon
- At Bottom = clrDarkGreen
- Draw a vertical Grey Line at the peak (Default = true)
- Can use for EA as custom indicator with fast calculation
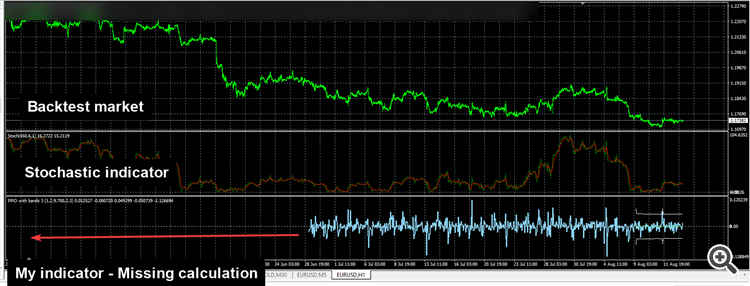
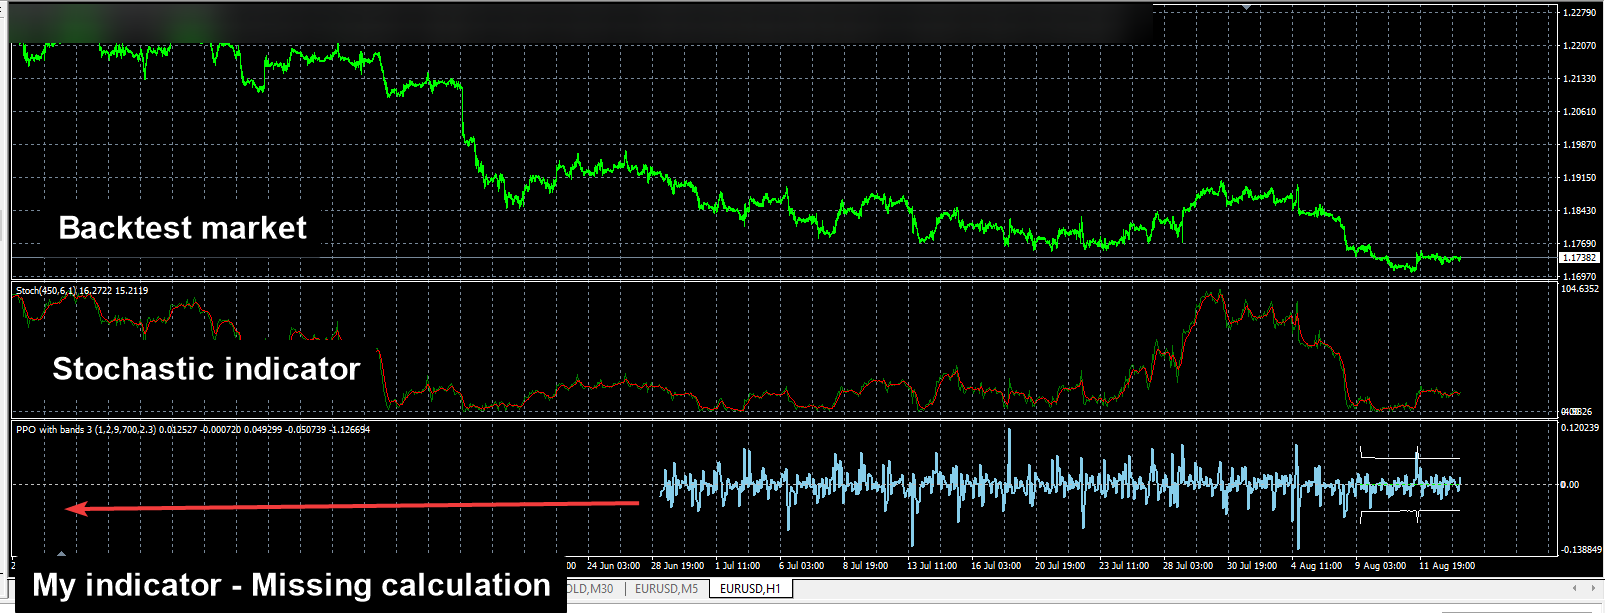
- The current problem is after the EA done using it strategy tester, when I open the chart the indicator will not print the value. Hence, I would like to have the indicator to always display all the result (just like MACD). See the example below, the past PPO indicator is missing when I open the chart, while conventional indicator like stochastic still there.
- The past version always take too much computational resource from me and slow down my Backtesting speed. Please keep the indicator calculation optimum by only update the latest candlestick only when there is new tick price. AGAIN, I DONT WANT THE PEAK ALGORITHM TO RECALCULATE AGAIN (NO REPRINT).
- Can use at any market which include (forex, gold, WTI, SnP500)
- I would like to standardise the value displayed by this indicator. Currently, forex pair will give very small number, Gold will give 100X larger number than forex. This give me intuitively hard to understand.
- I want to standardise the value into standard deviation, SD away from ZERO.
- Sample size = 400 (INPUT).
- Put a vertical grey line at 400th candle so that I know where is the sample size stop.
- I can adjust the vertical line (dragging left or right) to change the sample size
- So the max and min is +-3 and the indicator value will oscillate around 0 (mean indicator value).
- Put level label for 0, 1, 2, 3 for easier visualisation.
- Put a histogram at the right side of the indicator window to ease my visualisation. Have setting so i can adjust the size of histogram box.
- However, the previous SD calculation is very slow. Some user who dont have enough data will not able to use it.
- Hence make it auto adjust, If the user don't have enough XX amount of sample use whatever available.
- If ( Display Histogram == True) display a histogram at the right side of the indicator window. So when I scroll my chart left to right, the histogram will still there.
- Bin size = 0.1
- Min Max = +- 3
- I want to test run the speed. Other than PPO calculation. We use ATR with period of 1 to replace the PPO value.
- If close >= open (bull candle) ATR value is +ve
- If close < open (bull candle) ATR value is -ve
- Standard deviation calculation will all same as PPO above.
- I f you have any better idea that can speed up the calculation while giving similar intuitive visualisation, I will choose you.
- Can store the value into excel for further analysis.
-
Having the setting to export the data out and store in CSV. The indicator value for the past YY (default = 10) days will be first store. The CSV will continue append the latest data every 30sec (Default & changeable) The required data are:
- Symbol
- Broker time
- Local Time
- High price
- Low price
- Close price
- PPO / ATR
- Standard deviation of (7)
- Peak? (TRUE/FALSE)
When the export setting is true, create a "Debugging" Yellow text at the top right of the chart so I know the CSV is collecting.
The file name is following the format: custom_name ( Default=PPOIndi) + PPO/ATR + broker short name + symbol + date (year.month.day)
Summary
- Make PPO and ATR (changeable setting) indicator value
- Standardise the value by calculating the standard deviation, SD away from ZERO.
- Display the histogram at the right of the indicator window. Having vertical line for me to drag left and right to change the sample size.
- Adaptive peak capturing
- Test if it can use for EA and still display result in backtester
- Allow the indicator values to export data out in CSV.
Highly welcome developer that is communicative and experience in MQL indicator. Please communicate with me on your experience so I know if you are suitable in working with this project or not.
I am open for discussion to make this indicator.
Source code is needed by the end of the project.