This is an indicator that plots arrows for buy and sell positions giving the trader the option to one click trade using managed risk paramaters set in the panel.
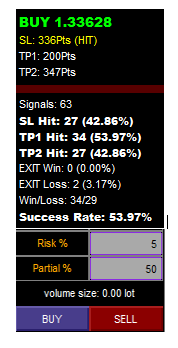
Dashboard will display the number of winning and losing signals called in terms of a percentage like this example:
Indicators in use
Bollinger Bands
Parabolic
Hiken-Ashi
Long Signal
Price Touch lower BB
Parabolic SAR Bullish Signal within 6 bars of price touching BB
Long signal generated at close of current bar
Stop loss placed according to stop parameter
Short Signal
Price touch upper BB
Parabolic Bearish signal within 6 bars of price touching BB
Short Signal generated at close of current bar
Stop loss placed according to stop parameter
EA Settings:
Signal Frequency: High, Medium, Low
High = Parabolic Settings – Step 1
Medium = Step 0.1
Low = Step 0.01
Volume: Conservative, Moderate, Aggressive
Conservative = BB is 3 SD
Moderate = BB is 2 SD
Aggressive = BB is 1 SD
Stop Loss – (options) Conservative, Moderate, Aggressive
Conservative = stop loss placed at the high/low of the last 20 HN bars
Moderate = stop loss placed at the high/low of the last 10 HN bars
Aggressive = stop loss placed at the high/low of the last 2 HN bars
Profit Target – Scalp, Day, Swing, Position
Scalp = 0.5 of the SL
Day = 1x SL
Swing = 2x SL
Position = 4x SL
Maximum History Bars = 3000 (variable)
This is the bars the indicator is looking for signals
Alerts
Email - on off
Popup on off
Dashboard
Last signal (buy sell)
SL – Price
TP – Price
Total Signals (number of history bars loaded)
SL Hit (number) Percentage)
TP Hit (number) Percentage)
Exit Loss (if new signal is generated and trade is in a losing position)
Exit Win (If new signal is generated and trade is in a winning position)
Buy/Sell – One click trade
Risk % - Calculate risk of trade according to stop loss placement
相似订单
Project Overview I have an existing MT5 Expert Advisor (EA) written in MQL5. The source code ( .mq5 ) will be provided. The underlying strategy is a trend-following system that performs well during trending market conditions, but requires professional quantitative research to improve its ability to identify and avoid highly sideways/range-bound market conditions. The objective of this project is not to build a new EA
I am looking for an experienced MQL5 Expert Advisor (EA) developer to analyze an existing trading setup and develop a similar automated trading robot. Project Overview I have access to a demo trading account where trades are being executed automatically. The trading results look very promising, but I do not know exactly what strategy, logic, indicators, or trade-management rules are being used. I will provide access
Most of the expert is already coded . Create a panel to show the Ratio for the Range . Trigger is based on ratio . Show Distribution / project starts after we clear Distribution
Modification of existing ea …. Add ema filter, add risk percentage per trade, and modify the pips per day filter. I already have the ea code I just need these things added and modifified
double CRiskManager::CalculateLotSize(double slPoints) { double balance = AccountInfoDouble(ACCOUNT_BALANCE); double riskMoney = balance * (m_riskPercent / 100.0); double tickValue = SymbolInfoDouble(_Symbol, SYMBOL_TRADE_TICK_VALUE); double tickSize = SymbolInfoDouble(_Symbol, SYMBOL_TRADE_TICK_SIZE); double pointValue = tickValue / tickSize; double lot = riskMoney / (slPoints * pointValue);
i share my strategy i need a bot trending bot fo mt5 . i attached the photo with this it help to make bot. it basicly 1 hours time frame base. i try but failed to make it
Title: Simple background trading bot for my Oanda account (v20 REST API) Overview Hi, I need a simple, lightweight event based standalone trading bot that connects directly to my Oanda account using broker’s standard REST API (V20 account) via VPS The bot just needs to look at group of 5 currency pairs (manually selectable and adjustable) in different 4 baskets, do some basic percentage math every period, and place
📄 وثيقة المواصفات الفنية لروبوت التداول (MQL5 EA Specification) 📌 1. ملخص المشروع والهدف * اسم المشروع: Gold Cent Grid-Hedge EA * المنصة: MetaTrader 5 (MQL5) * أداة التداول: الذهب (XAUUSD) * نوع الحساب: حساب سنت (Cent Account) * فكرة الاستراتيجية: تداول شبكة هيدج متوازنة (Grid-Hedging) تفتح صفقات تعزيز كل مسافة محددة، وتغلق الطرف الأكثر ربحاً عند تحقيق هدف مالّي مجمع بالدولار/السنت لإعادة هيكلة التوازن. ⚙️ 2
I need a developer who also understands trading. I have a Telegram copy-trading bot that reads signals from a Telegram channel via a Python script and converts them into trading orders. I want to create a program that analyzes Gold (XAUUSD) charts specifically and sends signals in this exact format: #XAUUSD BUY 4324-4321 TP 4327 TP 4330 TP 4334 TP 4339 TP 4344 TP 4354 TP 4364 SL 4311 If the # symbol is missing at the
Hi developer I want to convert my mt4 EA to mt5 EA . I have a mt4 ea with source code. i want developer to copy same mt4 code and create mt5 EA
 全部订单
全部订单
 规则
规则
