类别中的新订单:
30 - 200 USD
50 - 100 USD
50 - 150 USD
30 - 100 USD
30+ USD
150 - 500 USD
40+ USD
工作已完成
执行时间30 天
员工反馈
I'm very happy of working for algorez.
He is very good and honest employer to work with.
I hope to have long cooperation in future projects.
客户反馈
Went above and beyond my expectations, 10/10. Will rehire again. Very skilled with math and calculations. Did a great job with harmonics that no one else can compare to.
指定
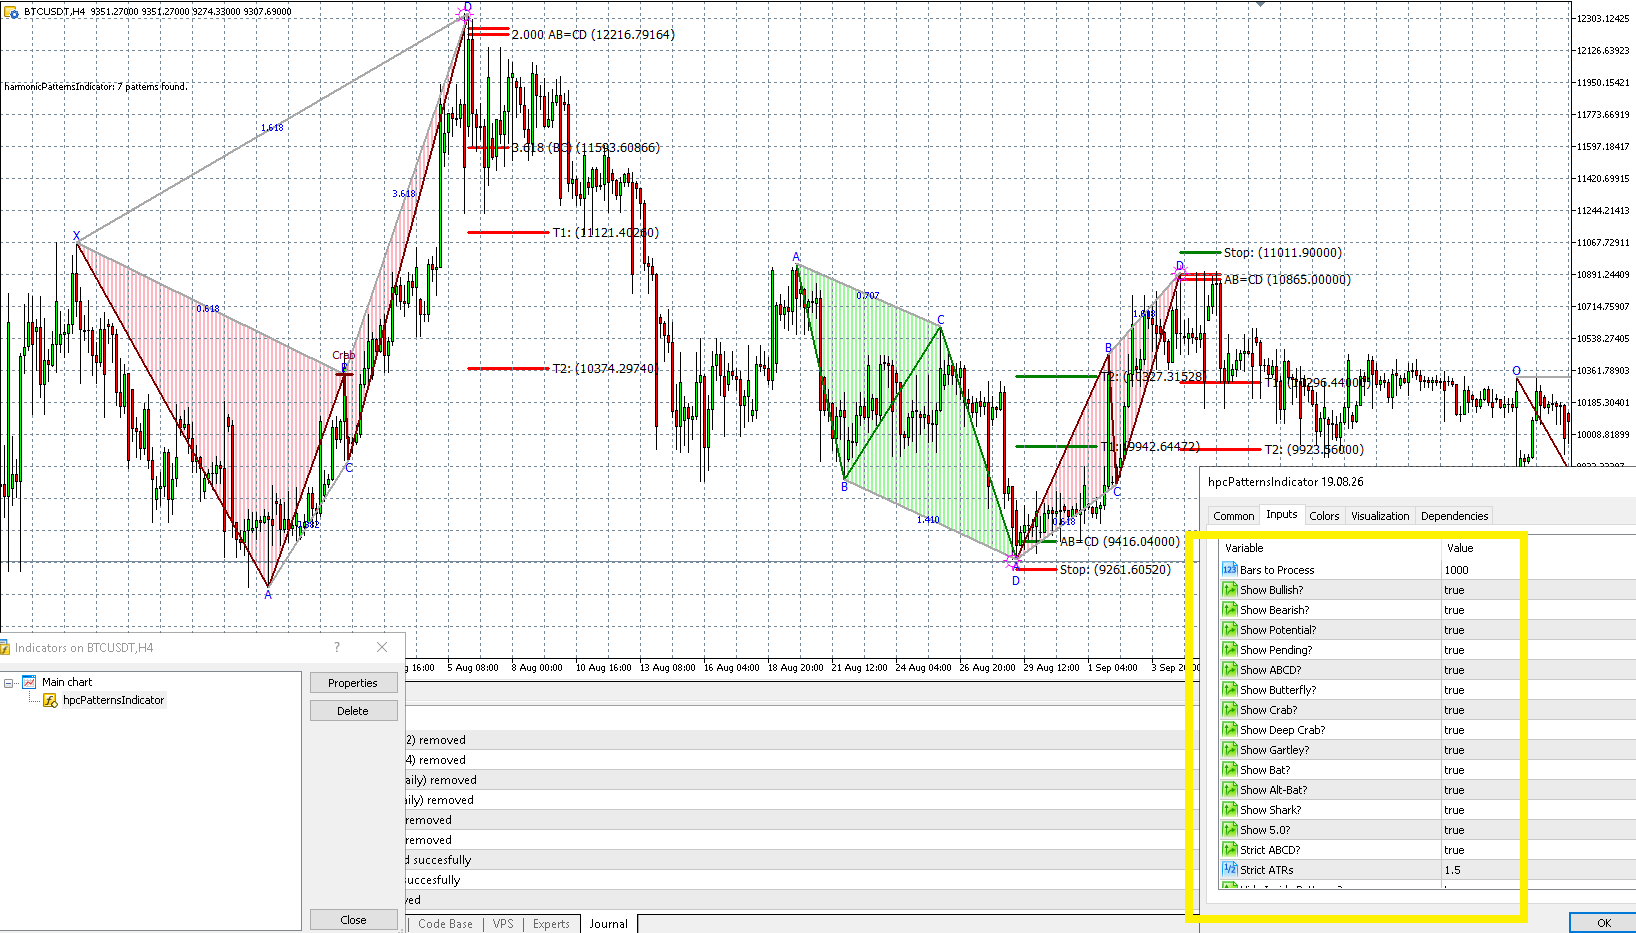
I currently use this HPC Patterns for Metatrader 5 which perfectly displays all the harmonic patterns with entries, stop-loss and
targets. I attached a screenshot as an example.
The issue with this plugin is that it only gives alerts and is not available as an EA. I am looking to hire an experienced developer who can
produce patterns up to standards with this plugin:
https://www.sr-analyst.com/page_hpc.html
I need the same harmonic patterns on my own overlay indicator and expert advisor. I also want the same targets for entry, stoploss and targets from the same logic on the chart and in the EA.
反馈
1
等级
项目
49
22%
仲裁
14
29%
/
21%
逾期
13
27%
空闲
2
等级
项目
507
40%
仲裁
159
17%
/
74%
逾期
99
20%
已载入
3
等级
项目
334
55%
仲裁
14
36%
/
29%
逾期
1
0%
空闲
相似订单
XAUUSD Grid + Hedging EA (MT4/MT5)
200 - 500 USD
I need for an EA for XAUUSD using a grid + Martingle + hedging strategy developer Main features: • Open Buy & Sell at start (hedging) • Grid system with adjustable step (price-based levels) • Lot multiplier (martingale-style) • Fixed TP per trade + basket TP (close all in profit) • Continuous re-entry after TP • Risk management (max trades, max lot, equity stop) EA should be stable, error-free, and work with
Mkiheme elite Bots
50 - 150 USD
I need a fully automated strategies trading futures, that works with pine scripts on tradingview.com . I need a fully automated trading robot designed to generate consistent profits while strictly controlling risk and minimizing losses. The robot should use a combination of strategies, including trend-following, scalping, and price action, and must be able to adapt to different market conditions such as trending and
Entry Rules: > * Open BUY when a Bullish Fair Value Gap (FVG) forms. Open SELL when a Bearish Fair Value Gap (FVG) forms. Risk Management: Every trade must have a Stop Loss and Take Profit. I want to be able to change these numbers in the settings. Mobile Features: The bot must send a "Push Notification" to my phone app for every trade. Assets: Must work on WTI Oil and Bitcoin
I am looking for a reliable and well-developed Expert Advisor (EA) that demonstrates low drawdown and consistent profitability on a real trading account . If you have already built such an EA, I would be interested in evaluating it. I would require: Verified backtest results Forward testing performance (demo or real account preferred) Ideally, a live track record (Myfxbook / FXBlue or similar) I am serious about
🏆 HIRING: Quantitative Gold (XAU/USD) Trading Strategy Developer ━━━━━━━━━━━━━━━━━━━━━━━━━━━━━━━━ 📌 PROJECT OVERVIEW ━━━━━━━━━━━━━━━━━━━━━━━━━━━━━━━━ I am building a professional trading signal platform (xtraderlab.com) and need an experienced quant trader or algo developer to design, code, and backtest a high-performance intraday Gold (XAU/USD) trading strategy. The strategy will be integrated into an existing
Technical Specifications: "Dawn Range Breakout" Expert Advisor (Final Version) 1. Overview The purpose of this EA is to capture the breakout of a specific hourly range on Gold (XAUUSD) or any other pair, with a focus on high-precision entry, strict risk management (1 trade per day), and partial profit taking. 2. Core Trading Logic Timeframe: M15. Reference Hour: The EA must identify the High and Low of the H1 candle
SK Indicator Trading Robot for Gold (XAUUSD)
100 - 200 USD
I need an Expert Advisor based on SK indicator for gold trading. Entry: - Open trade immediately when SK signal appears Stop Loss: - Fixed stop loss = $200 per trade Take Profit: - TP1: close 50% of the position - TP2: final target Lot Size: - Fixed lot = 0.02 Pair: - XAUUSD only Timeframe: - M15 Rules: - Only one trade per signal - No duplicate trades - Move stop loss to breakeven after TP1 Requirements: - The EA
i am looking for an experienced MQL5 developer to build a high-frequency trading Expert Advisor (EA) for XAUUSD (Gold) on M1 and M5 timeframes. The EA must include advanced execution logic, dynamic pending orders, risk management, and news/session filters. Clean, efficient, and well-documented code is required. Strategy type: Scalping (fast trades, quick profit). Very fast execution logic (optimized for speed). Goal
Ea with MM Masaniello
50 - 200 USD
I would like to develop a bot that allows me to manually input trades based on the Masaniello money management system, which I will configure at the outset. Within this setup, I will be able to define all the key parameters of the Masaniello strategy, including the total number of events, expected winning events, stake ratio (i.e. the TP/SL ratio), and the initial capital. Once the Masaniello parameters are set, the
Manly
30 - 200 USD
ZigZag based on oscillators is needed The idea of the indicator Create a ZigZag indicator, which is constructed based on extreme values determined using oscillators. It can use any classical normalized oscillator, which has overbought and oversold zones. The algorithm should first be executed with the WPR indicator, then similarly add the possibility to draw a zigzag using the following indicators: CCI Chaikin RSI
项目信息
预算
300 - 500 USD