程序库: 一个原始数学函数的跨平台开发库
请执行 ADF 检验和其他检验来检查协整关系。
来自 fxsaber 的又一个好东西,谢谢 )
// 该指标显示每个历史区间与当前区间的相似程度

#property indicator_separate_window

#property indicator_buffers 1
#property indicator_plots 1

#property indicator_minimum -1
#property indicator_maximum 1

#property  indicator_color1 clrRed
#property  indicator_type1 DRAW_LINE
#property  indicator_width1 2

sinput int Amount = 100; // 最后一小节的数量(模式)

#include <fxsaber\Math\Math.mqh> //https://www.mql5.com/zh/code/17982

double Buffer[];

void OnInit()
{
  SetIndexBuffer(0, Buffer);
}

int OnCalculate( const int rates_total,
                 const int prev_calculated,
                 const datetime &time[],
                 const double &open[],
                 const double &high[],
                 const double &low[],
                 const double &close[],
                 const long &tick_volume[],
                 const long &volume[],
                 const int &spread[] )
{
  if (rates_total > prev_calculated)
  {
    double Pattern[];

    ArrayCopy(Pattern, open, 0, rates_total - Amount, Amount);

    MathCorrelationPearson(open, Pattern, Buffer);

    const int Pos = ArrayMaximum(Buffer, 0, rates_total - Amount);

    Comment("与最近的历史最相似的一段历史(" +
          (string)time[rates_total - 1] + ") " + (string)Amount + "巴拉姆,它在这里" +
          (string)time[Pos] + " - 皮尔逊智商 = " + (string)Buffer[Pos]);
  }

  return(rates_total);
}
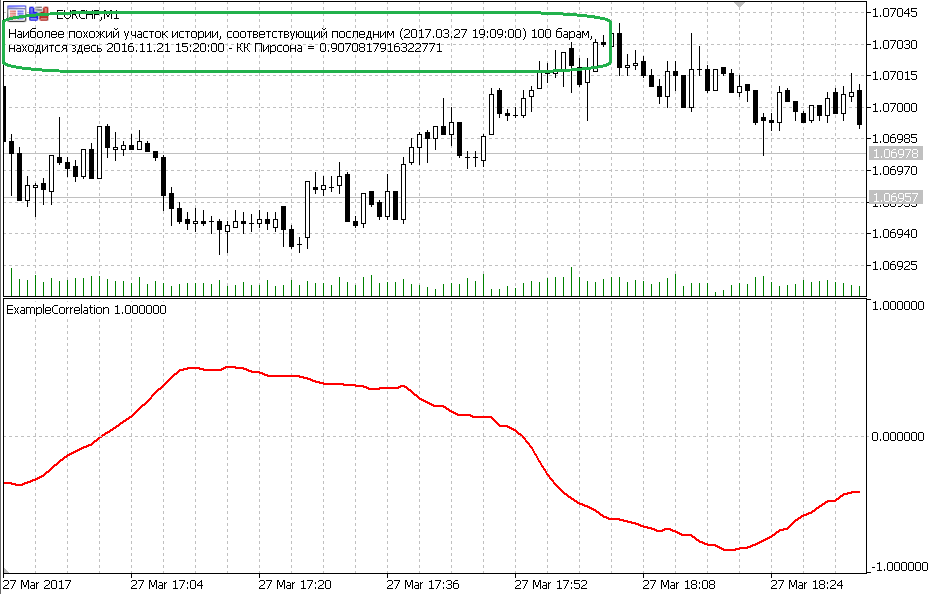
举例说明如何快速找到最相似(根据皮尔逊)的历史片段。
实现的优势只在于算法--比任何其他算法都要快得多。
fxsaber:
举例说明如何快速找到最相似(根据皮尔逊)的历史片段。
实现的优势只在于算法--比其他算法快得多。
就历史而言,这很好。但我想反过来做,在历史中选择几个条形片段,如果指标发现了重合,就会通知我们。这种实现方式原则上可行吗?
s22aa:
在历史记录上,这很好。但我想反过来做,在历史记录上选择几个条形片段,如果指标发现了巧合,就会通知我们。这样的实现原则上可行吗?
一个简单的标准 MathCorrelationPearson 就足够了。
在历史记录上,这很好。但我想反过来做,在历史记录上选择几个条形片段,如果指标发现了巧合,就会通知我们。这样的实现原则上可行吗?
fxsaber:
一个简单的内部 MathCorrelationPearson 就足够了。
一个简单的内部 MathCorrelationPearson 就足够了。
这真是太好了。我刚刚开始学习 C++ 课程,已经通过了几个周期的学习,感觉自己几乎成了编程大师,当然还算不上大师,只能说是半路出家。我想再过几年,标准的 MathCorrelationPearson 对我来说也会变得 "简单"。
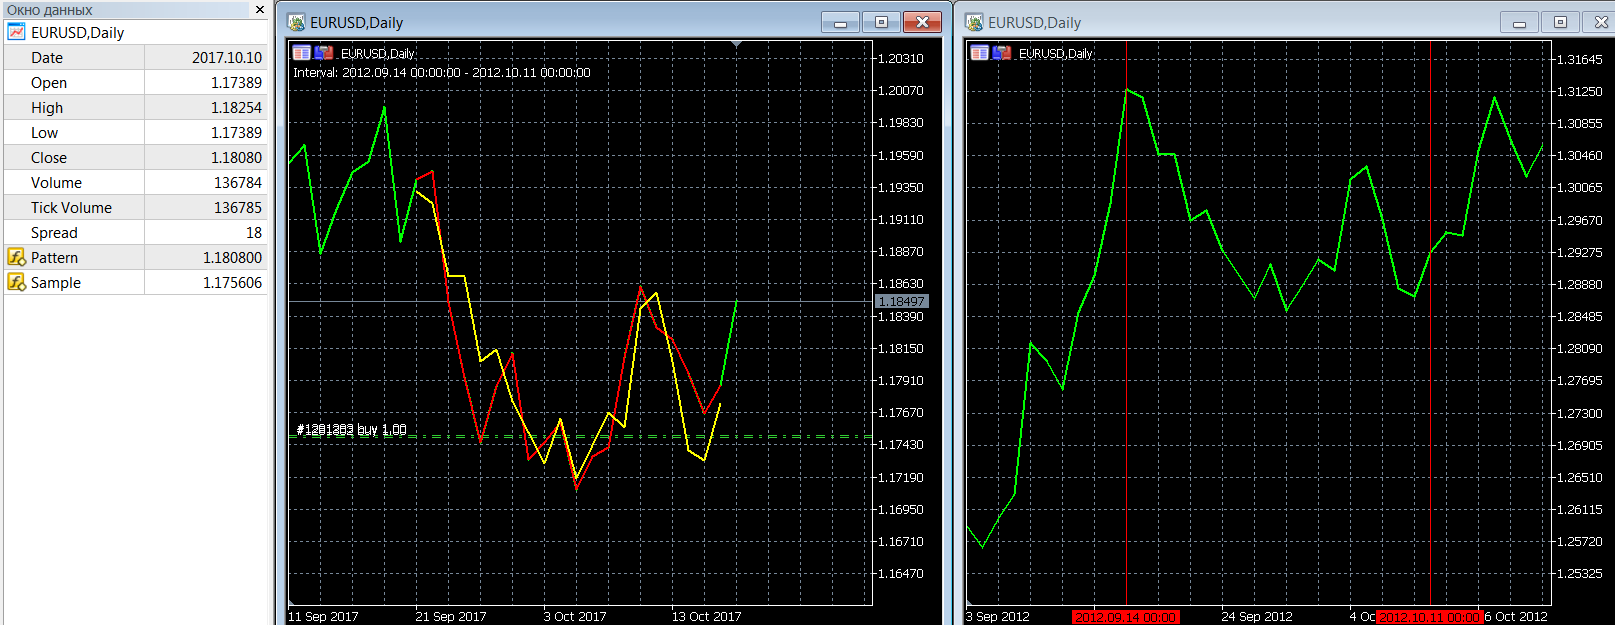
// 寻找与当前区间 "最相似 "区间的示例(皮尔逊质量控制标准)。
#property indicator_chart_window

#property indicator_buffers 2
#property indicator_plots 2

#property  indicator_color1 clrRed
#property  indicator_type1 DRAW_LINE
#property  indicator_width1 2

#property  indicator_color2 clrYellow
#property  indicator_type2 DRAW_LINE
#property  indicator_width2 2

sinput int inAmount = 20;   // 最后一小节的数量(模式)
input int  inMaxBars = 1 e5; // 要分析的条数

#include <fxsaber\Math\Math.mqh> //https://www.mql5.com/zh/code/17982

double Buffer0[];
double Buffer1[];
double Buffer2[];
int handle;

const long handleChart = ChartOpen(_Symbol, PERIOD_CURRENT);

void OnInit()
{
  SetIndexBuffer(0, Buffer0);
  SetIndexBuffer(1, Buffer1);

  PlotIndexSetString(0, PLOT_LABEL, "Pattern");
  PlotIndexSetString(1, PLOT_LABEL, "Sample");

  ChartSetInteger(handleChart, CHART_MODE, CHART_LINE);
  ChartSetInteger(handleChart, CHART_AUTOSCROLL, false);
}

//------
// 摘自 Include\MathStat\Math.mqh -https://www.mql5.com/ru/forum/97153/page15#comment_5927026

const double QNaN   =(double)"nan";   // QNaN.

//+------------------------------------------------------------------+
//} 计算数组[]中数值的平均值。
//+------------------------------------------------------------------+
double MathMean(const double &array[])
  {
   int size=ArraySize(array);
//--- 检查数据范围
   if(size<1)
      return(QNaN); // 至少需要 1 次观测
//--- 计算平均值
   double mean=0.0;
   for(int i=0; i<size; i++)
      mean+=array[i];
   mean=mean/size;
//--- 返回平均值
   return(mean);
  }
//+------------------------------------------------------------------+
//} 计算数组[]中数值的方差。
//+------------------------------------------------------------------+
double MathVariance(const double &array[])
  {
   int size=ArraySize(array);
//--- 检查数据范围
   if(size<2)
      return(QNaN); // 至少需要 2 次观测
//--- 计算平均值
   double mean=0.0;
   for(int i=0; i<size; i++)
      mean+=array[i];
   mean=mean/size;
//--- 计算方差
   double variance=0;
   for(int i=0; i<size; i++)
      variance+=MathPow(array[i]-mean,2);
   variance=variance/size;
//--- 返回方差
   return(variance);
  }
//------

// 样品与图样相匹配
void NormalizeArray( const double &Pattern[], double &Sample[], const bool Reverse = false )
{
  const double MeanPattern = MathMean(Pattern);
  const double MeanSample = MathMean(Sample);
  const double Koef = (Reverse ? -1 : 1) * MathSqrt(MathVariance(Pattern) / MathVariance(Sample));

  const int Total = ArraySize(Pattern);

  for (int i = 0; i < Total; i++)
    Sample[i] = (Sample[i] - MeanSample) * Koef + MeanPattern;
}

void MathLog( double &Array[] )
{
  for (int i = ArraySize(Array) - 1; i >= 0; i--)
    Array[i] = MathLog(Array[i]);
}

void MathExp( double &Array[] )
{
  for (int i = ArraySize(Array) - 1; i >= 0; i--)
    Array[i] = MathExp(Array[i]);
}

// 通过图案找到最佳样本
int GetSample1( const int Amount, const double &Prices[], double &Sample[], double &Pattern[], int MaxBars )
{
  const int Total = ArraySize(Prices) - 1; // 从计算中移除最后一个条形图

  ArrayCopy(Pattern, Prices, 0, Total - Amount, Amount);

  MaxBars = (Total > MaxBars) ? MaxBars : Total;

  double Prices2[];
  ArrayCopy(Prices2, Prices, 0, Total - MaxBars, MaxBars);
  MathLog(Prices2);

  double Pattern2[];
  ArrayCopy(Pattern2, Pattern);
  MathLog(Pattern2);

  double Pearson[];
  MathCorrelationPearson(Prices2, Pattern2, Pearson);

  const int PosMax = ArrayMaximum(Pearson, 0, MaxBars - Amount);
  const int PosMin = ArrayMaximum(Pearson, 0, MaxBars - Amount);

  const bool Res = (MathAbs(Pearson[PosMax]) < MathAbs(Pearson[PosMin]));
  const int Pos2 = Res ? PosMin : PosMax;

  ArrayCopy(Sample, Prices2, 0, Pos2 - Amount + 1, Amount);
  NormalizeArray(Pattern2, Sample, Res);
  MathExp(Sample);

  return(Pos2 + Total - MaxBars);
}

void OnDeinit( const int )
{
  ChartClose(handleChart);
}

int OnCalculate( const int rates_total,
                 const int prev_calculated,
                 const datetime &time[],
                 const double &open[],
                 const double &high[],
                 const double &low[],
                 const double &close[],
                 const long &tick_volume[],
                 const long &volume[],
                 const int &spread[] )
{
  if (rates_total > prev_calculated)
  {
    double Pattern[];
    double Sample[];

    const int Pos = GetSample1(inAmount, close, Sample, Pattern, inMaxBars);

    // 我们得出了模式本身
    ArrayInitialize(Buffer0, EMPTY_VALUE);
    ArrayCopy(Buffer0, Pattern, rates_total - inAmount - 1);

    // 输出样本
    ArrayInitialize(Buffer1, EMPTY_VALUE);
    ArrayCopy(Buffer1, Sample, rates_total - inAmount - 1);

    Comment("Interval: " + (string)time[Pos - inAmount + 1] + " - " + (string)time[Pos]);

    // 显示找到的部分
    const int Offset = 10;
    ChartNavigate(handleChart, CHART_BEGIN, Pos - inAmount + 1 - Offset); // 在采样源开始前移动图表偏移量小节
    ObjectCreate(handleChart, "Left", OBJ_VLINE, 0, time[Pos - inAmount + 1], 0);
    ObjectCreate(handleChart, "Right", OBJ_VLINE, 0, time[Pos], 0);
  }

  return(rates_total);
}
一个原始数学函数的跨平台开发库:
作者: fxsaber