如何在两个均线之间填充颜色???
请问您这个问题解决了嘛?我也遇到这个问题了
试试用这个:DRAW_HISTOGRAM ,然后把它弄粗一点
试试用这个:DRAW_HISTOGRAM ,然后把它弄粗一点
//+------------------------------------------------------------------+
//| MA ribbon.mq4 |
//| mladenfx@gmail.com |
//| |
//| original idea by Jose Silva |
//+------------------------------------------------------------------+
#property copyright "mladen"
#property link "mladenfx@gmail.com"
#property indicator_chart_window
#property indicator_buffers 4
#property indicator_color1 Blue
#property indicator_color2 Red
#property indicator_color3 Red
#property indicator_color4 Blue
#property indicator_width1 0
#property indicator_width2 0
#property indicator_width3 2
#property indicator_width4 2
extern int MA1Period=12;
extern int MA1Method=MODE_SMMA;
extern int MA1Price =PRICE_CLOSE;
extern int MA2Period=34;
extern int MA2Method=MODE_SMMA;
extern int MA2Price =PRICE_CLOSE;
double buffer1[];
double buffer2[];
double buffer3[];
double buffer4[];
int init()
{
SetIndexBuffer(0,buffer3); SetIndexStyle(0,DRAW_HISTOGRAM);
SetIndexBuffer(1,buffer4); SetIndexStyle(1,DRAW_HISTOGRAM);
SetIndexBuffer(2,buffer1);
SetIndexBuffer(3,buffer2);
return(0);
}
int deinit()
{
return(0);
}
int start()
{
int counted_bars=IndicatorCounted();
int limit,i;
if(counted_bars<0) return(-1);
if(counted_bars>0) counted_bars--;
limit=Bars-counted_bars;
for(i=limit; i>=0; i--)
{
buffer1[i] = iMA(NULL,0,MA1Period,0,MA1Method,MA1Price,i);
buffer2[i] = iMA(NULL,0,MA2Period,0,MA2Method,MA2Price,i);
buffer3[i] = buffer1[i];
buffer4[i] = buffer2[i];
}
return(0);
}
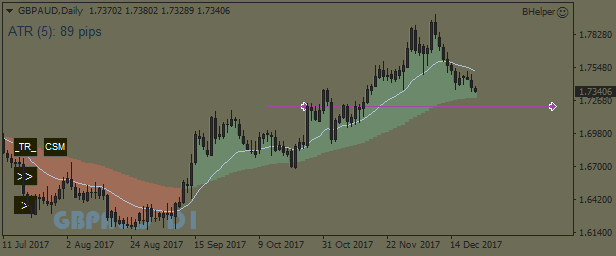
长线可能有点用,图中绿色表示在63ema之上,红色是之下,就是绿色区long稍微增加一点信心,仅此而已
从布林带 改的代码 一个12均线 一个 26均线
我想在连个均线之间填充颜色???
请问 怎么搞???是用Draw_Fill么? 如何做?
//+------------------------------------------------------------------+
//| |
//| Copyright 2005-2014, MetaQuotes Software Corp. |
//| https://www.mql4.com/ |
//+------------------------------------------------------------------+
#property copyright "2005-2014, MetaQuotes Software Corp."
#property link "https://www.mql4.com/"
#property description "Bollinger Bands"
#property strict
#include <MovingAverages.mqh>
#property indicator_chart_window
#property indicator_buffers 4
#property indicator_color1 Magenta
#property indicator_color2 MediumSpringGreen
//--- indicator parameters
input int FasterMA = 12;
input int SlowerMA = 26;
//--- buffers
double Fast_MA[];
double Slow_MA[];
//+------------------------------------------------------------------+
//| Custom indicator initialization function |
//+------------------------------------------------------------------+
int OnInit(void)
{
//--- 1 additional buffer used for counting.
IndicatorBuffers(2);
IndicatorDigits(Digits);
//--- middle line
SetIndexStyle(0,DRAW_LINE);
SetIndexBuffer(0,Fast_MA);
SetIndexShift(0,0);
SetIndexLabel(0,"Fast_MA");
//--- upper band
SetIndexStyle(1,DRAW_LINE);
SetIndexBuffer(1,Slow_MA);
SetIndexShift(1,0);
SetIndexLabel(1,"Slow_MA");
//--- work buffer
//--- check for input parameter
if(SlowerMA<=0)
{
Print("Wrong input parameter Bands Period=",FasterMA);
return(INIT_FAILED);
}
//---
SetIndexDrawBegin(0,SlowerMA);
//--- initialization done
return(INIT_SUCCEEDED);
}
//+------------------------------------------------------------------+
//| Bollinger Bands |
//+------------------------------------------------------------------+
int OnCalculate(const int rates_total,
const int prev_calculated,
const datetime &time[],
const double &open[],
const double &high[],
const double &low[],
const double &close[],
const long &tick_volume[],
const long &volume[],
const int &spread[])
{
int limit=rates_total-prev_calculated;
//--- main loop
for(int i=0; i<limit; i++)
{
//--- ma_shift set to 0 because SetIndexShift called abowe
Fast_MA[i]=iMA(NULL,0,FasterMA,0,MODE_EMA,PRICE_CLOSE,i);
Slow_MA[i]=iMA(NULL,0,SlowerMA,0,MODE_EMA,PRICE_CLOSE,i);
}
//---- OnCalculate done. Return new prev_calculated.
return(rates_total);
}