- 显示:
- 42
- 等级:
- 已发布:
-
需要基于此代码的EA交易或指标吗?请在自由职业者服务中订购 进入自由职业者服务
我删除了代码体。已不可用。请不要下载。
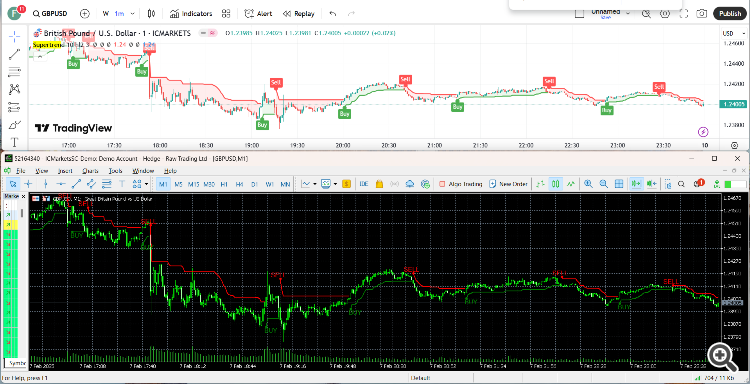
此代码的目的是向寻求将松树脚本转换为 MQL5 的简单而实用的方法的人传达一种理念。
您可以在此处 下载编译版本。
这里是 pine 脚本代码:
//@version=4
study("Supertrend", overlay = true, format=format.price, precision=2, resolution="")

Periods = input(title="ATR Period", type=input.integer, defval=10)
src = input(hl2, title="Source")
Multiplier = input(title="ATR Multiplier", type=input.float, step=0.1, defval=3.0)
changeATR= input(title="Change ATR Calculation Method ?", type=input.bool, defval=true)
showsignals = input(title="Show Buy/Sell Signals ?", type=input.bool, defval=true)
highlighting = input(title="Highlighter On/Off ?", type=input.bool, defval=true)
atr2 = sma(tr, Periods)
atr= changeATR ? atr(Periods) : atr2
up=src-(Multiplier*atr)
up1 = nz(up[1],up)
up := close[1] > up1 ? max(up,up1) : up
dn=src+(Multiplier*atr)
dn1 = nz(dn[1], dn)
dn := close[1] < dn1 ? min(dn, dn1) : dn
trend = 1
trend := nz(trend[1], trend)
trend := trend == -1 and close > dn1 ? 1 : trend == 1 and close < up1 ? -1 : trend
upPlot = plot(trend == 1 ? up : na, title="Up Trend", style=plot.style_linebr, linewidth=2, color=color.green)
buySignal = trend == 1 and trend[1] == -1
plotshape(buySignal ? up : na, title="UpTrend Begins", location=location.absolute, style=shape.circle, size=size.tiny, color=color.green, transp=0)
plotshape(buySignal and showsignals ? up : na, title="Buy", text="Buy", location=location.absolute, style=shape.labelup, size=size.tiny, color=color.green, textcolor=color.white, transp=0)
dnPlot = plot(trend == 1 ? na : dn, title="Down Trend", style=plot.style_linebr, linewidth=2, color=color.red)
sellSignal = trend == -1 and trend[1] == 1
plotshape(sellSignal ? dn : na, title="DownTrend Begins", location=location.absolute, style=shape.circle, size=size.tiny, color=color.red, transp=0)
plotshape(sellSignal and showsignals ? dn : na, title="Sell", text="Sell", location=location.absolute, style=shape.labeldown, size=size.tiny, color=color.red, textcolor=color.white, transp=0)
mPlot = plot(ohlc4, title="", style=plot.style_circles, linewidth=0)
longFillColor = highlighting ? (trend == 1 ? color.green : color.white) : color.white
shortFillColor = highlighting ? (trend == -1 ? color.red : color.white) : color.white
fill(mPlot, upPlot, title="UpTrend Highligter", color=longFillColor)
fill(mPlot, dnPlot, title="DownTrend Highligter", color=shortFillColor)
alertcondition(buySignal, title="SuperTrend Buy", message="SuperTrend Buy!")
alertcondition(sellSignal, title="SuperTrend Sell", message="SuperTrend Sell!")
changeCond = trend != trend[1]
alertcondition(changeCond, title="SuperTrend Direction Change", message="SuperTrend has changed direction!")
由MetaQuotes Ltd译自英文
原代码: https://www.mql5.com/en/code/60369
 Pinbar Detector MT4
Pinbar Detector 是一个 MetaTrader 指标,用于检测 Pinbars(也称为 "Pin-bar "或 "Pin bar"),并在看涨的 Pinbars 下方和看跌的 Pinbars 上方放置一个 "笑脸 "符号来标记它们。这是一个纯粹的价格行为指标,其代码中不使用任何标准技术指标。Pinbar 检测的配置可通过指标的输入参数完成。Pinbar Detector 可在检测时发出平台警报和电子邮件警报。该指标同时适用于 MT4 和 MT5 版本的交易平台。
 Point and Figure Indicator for MetaTrader 5
Point-and-Figure MetaTrader 5 指标是一个可以在 MT5 图表主窗口中直接绘制点图的指标。您可以根据自己的偏好设置所有点图法参数,如方框大小和反转距离。此外,您还可以控制 PnF 图表的所有显示参数。该点位和图形指标支持各种警报。它基于真实刻度线数据,因此仅适用于 MT5。


