Ivan Stefanov / Profil
- Bilgiler
|
8+ yıl
deneyim
|
27
ürünler
|
68
demo sürümleri
|
|
0
işler
|
0
sinyaller
|
0
aboneler
|
Gelişmiş momentum osilatörü, daha doğru aşırı alım ve aşırı satım sinyalleri için periyodunu piyasa oynaklığına göre otomatik olarak ayarlar. Çalışma Prensibi: Gösterge, yüksek oynaklıkta kısalan ve düşük oynaklıkta uzayan uyarlanabilir bir periyot hesaplaması kullanır. Bu dinamik ayar, piyasa trend halindeyken daha hızlı sinyaller sağlar ve yatay piyasa koşullarında yanlış sinyalleri azaltır. RSI değeri, bu değişken periyoda göre hesaplanır, bu da onu mevcut piyasa koşullarına daha duyarlı hale
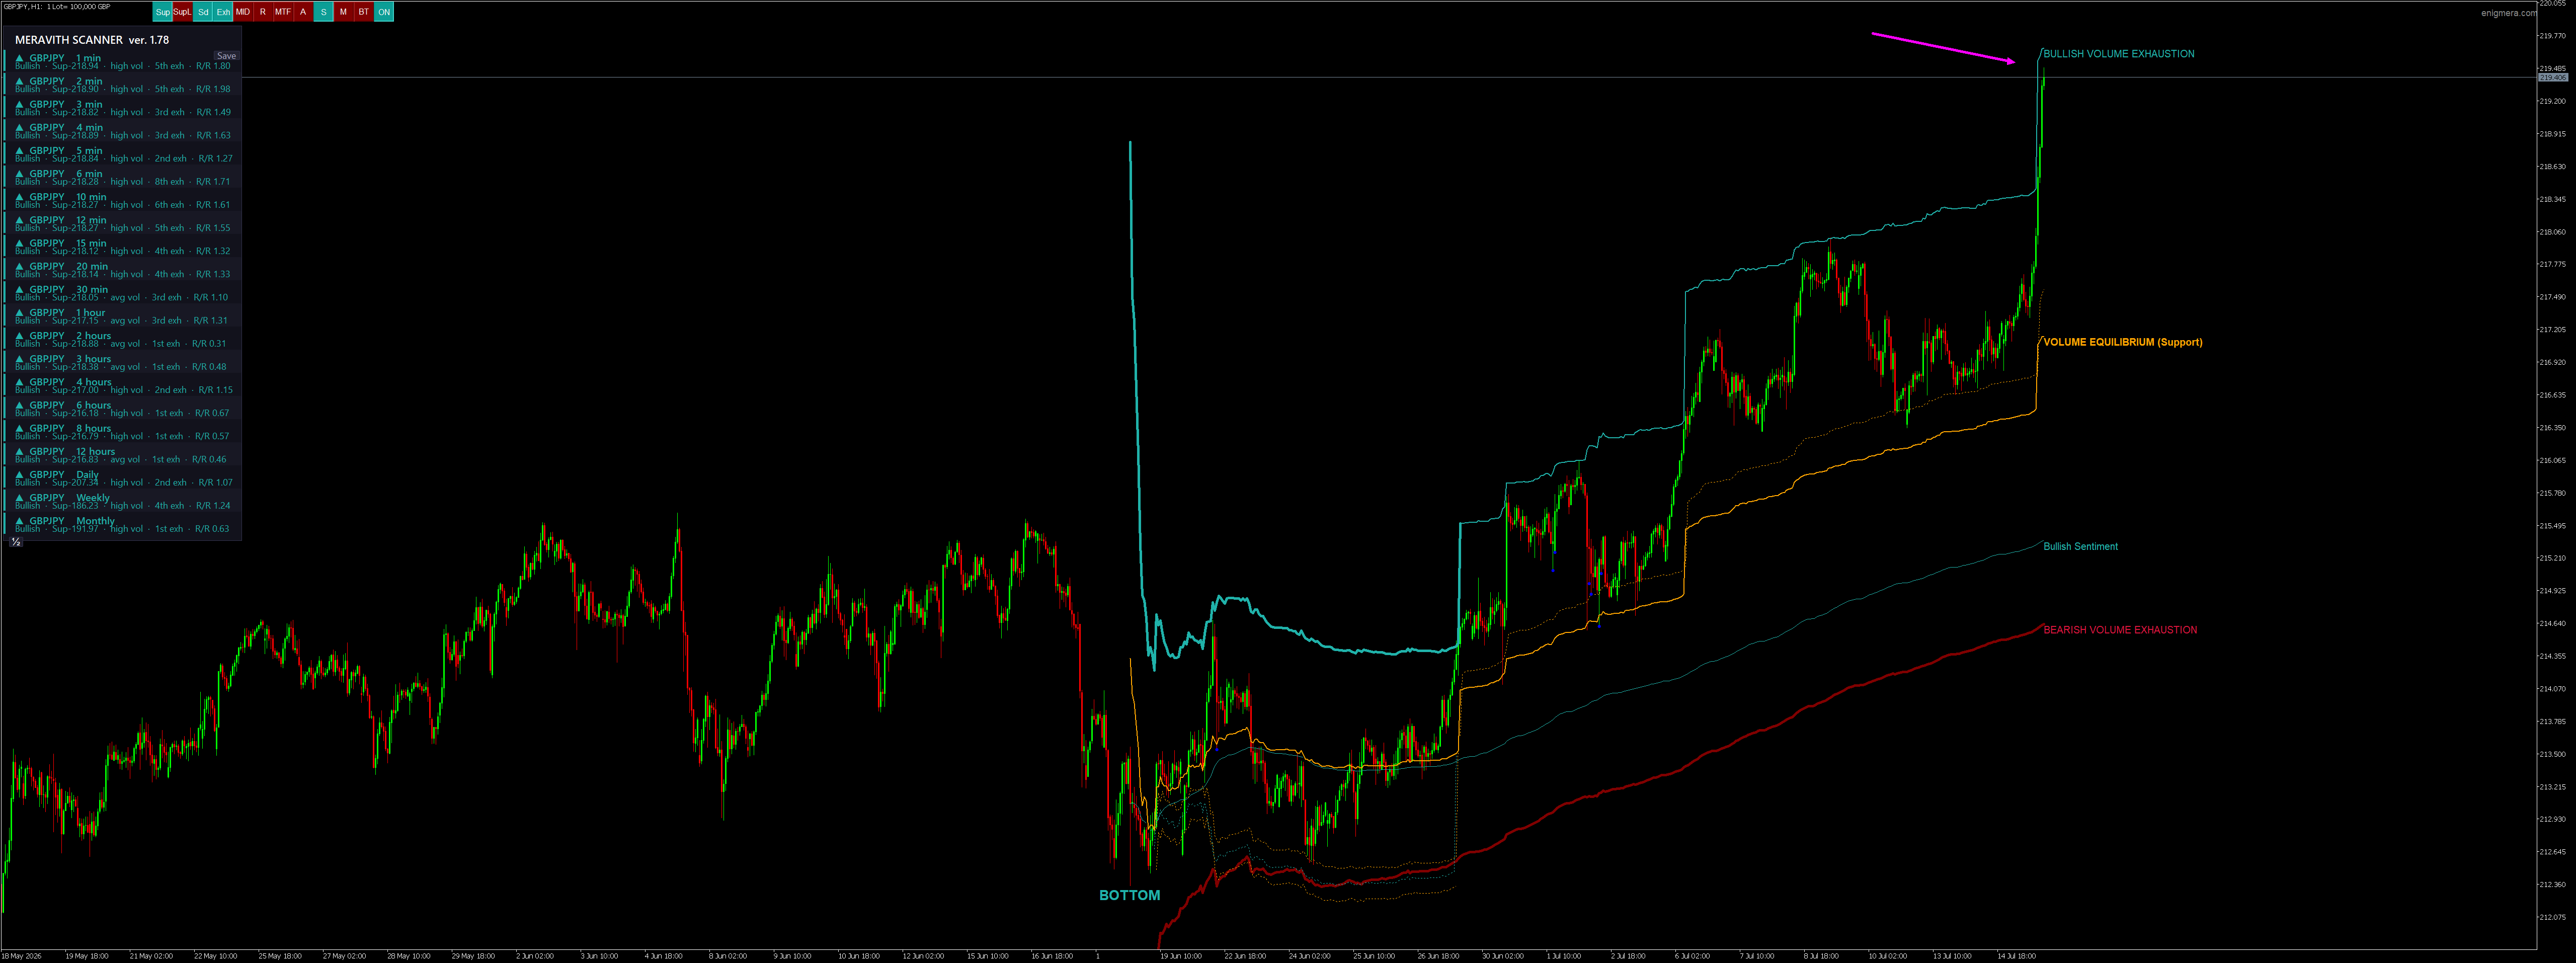
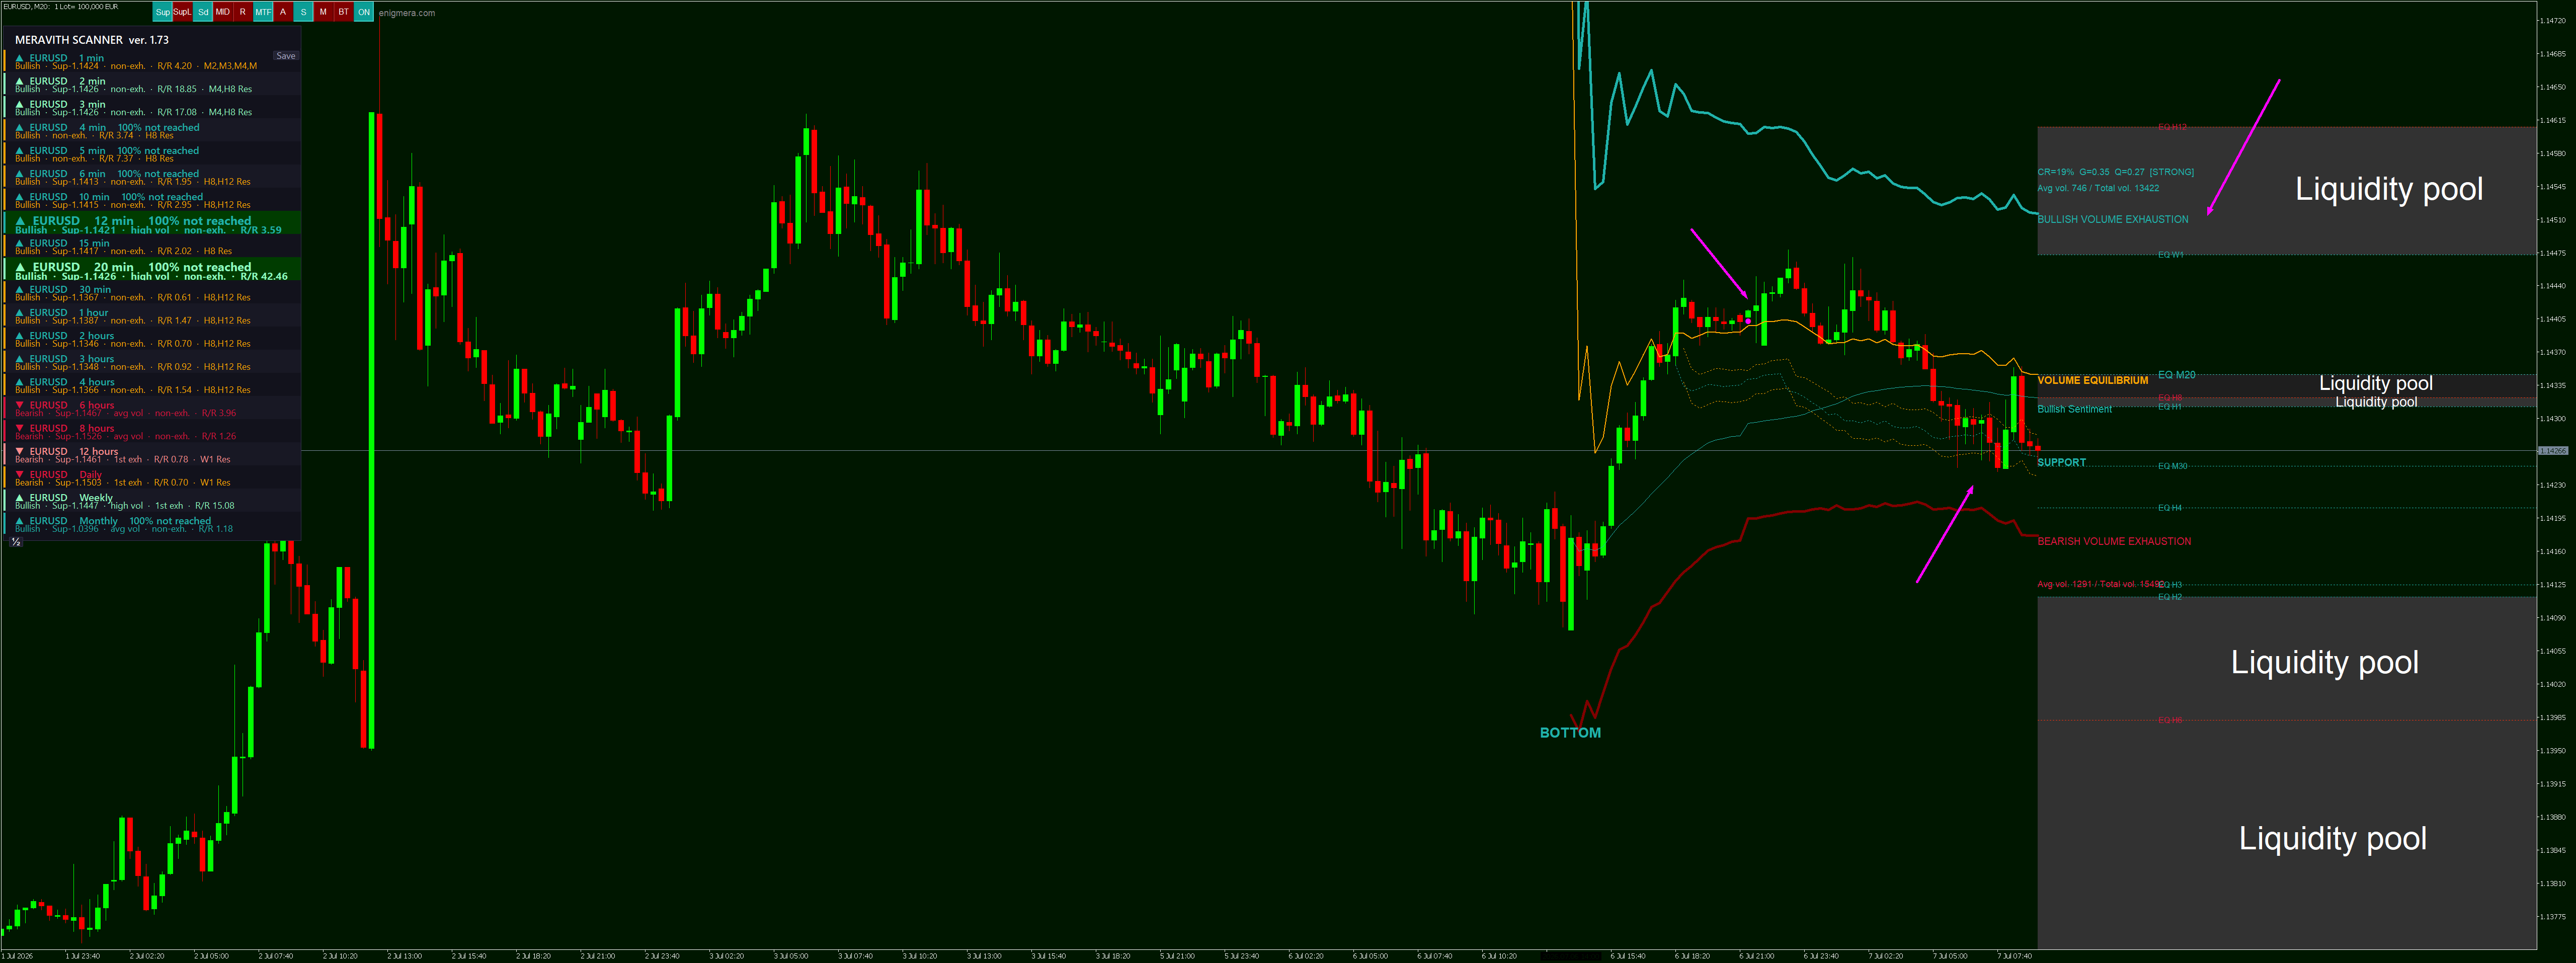
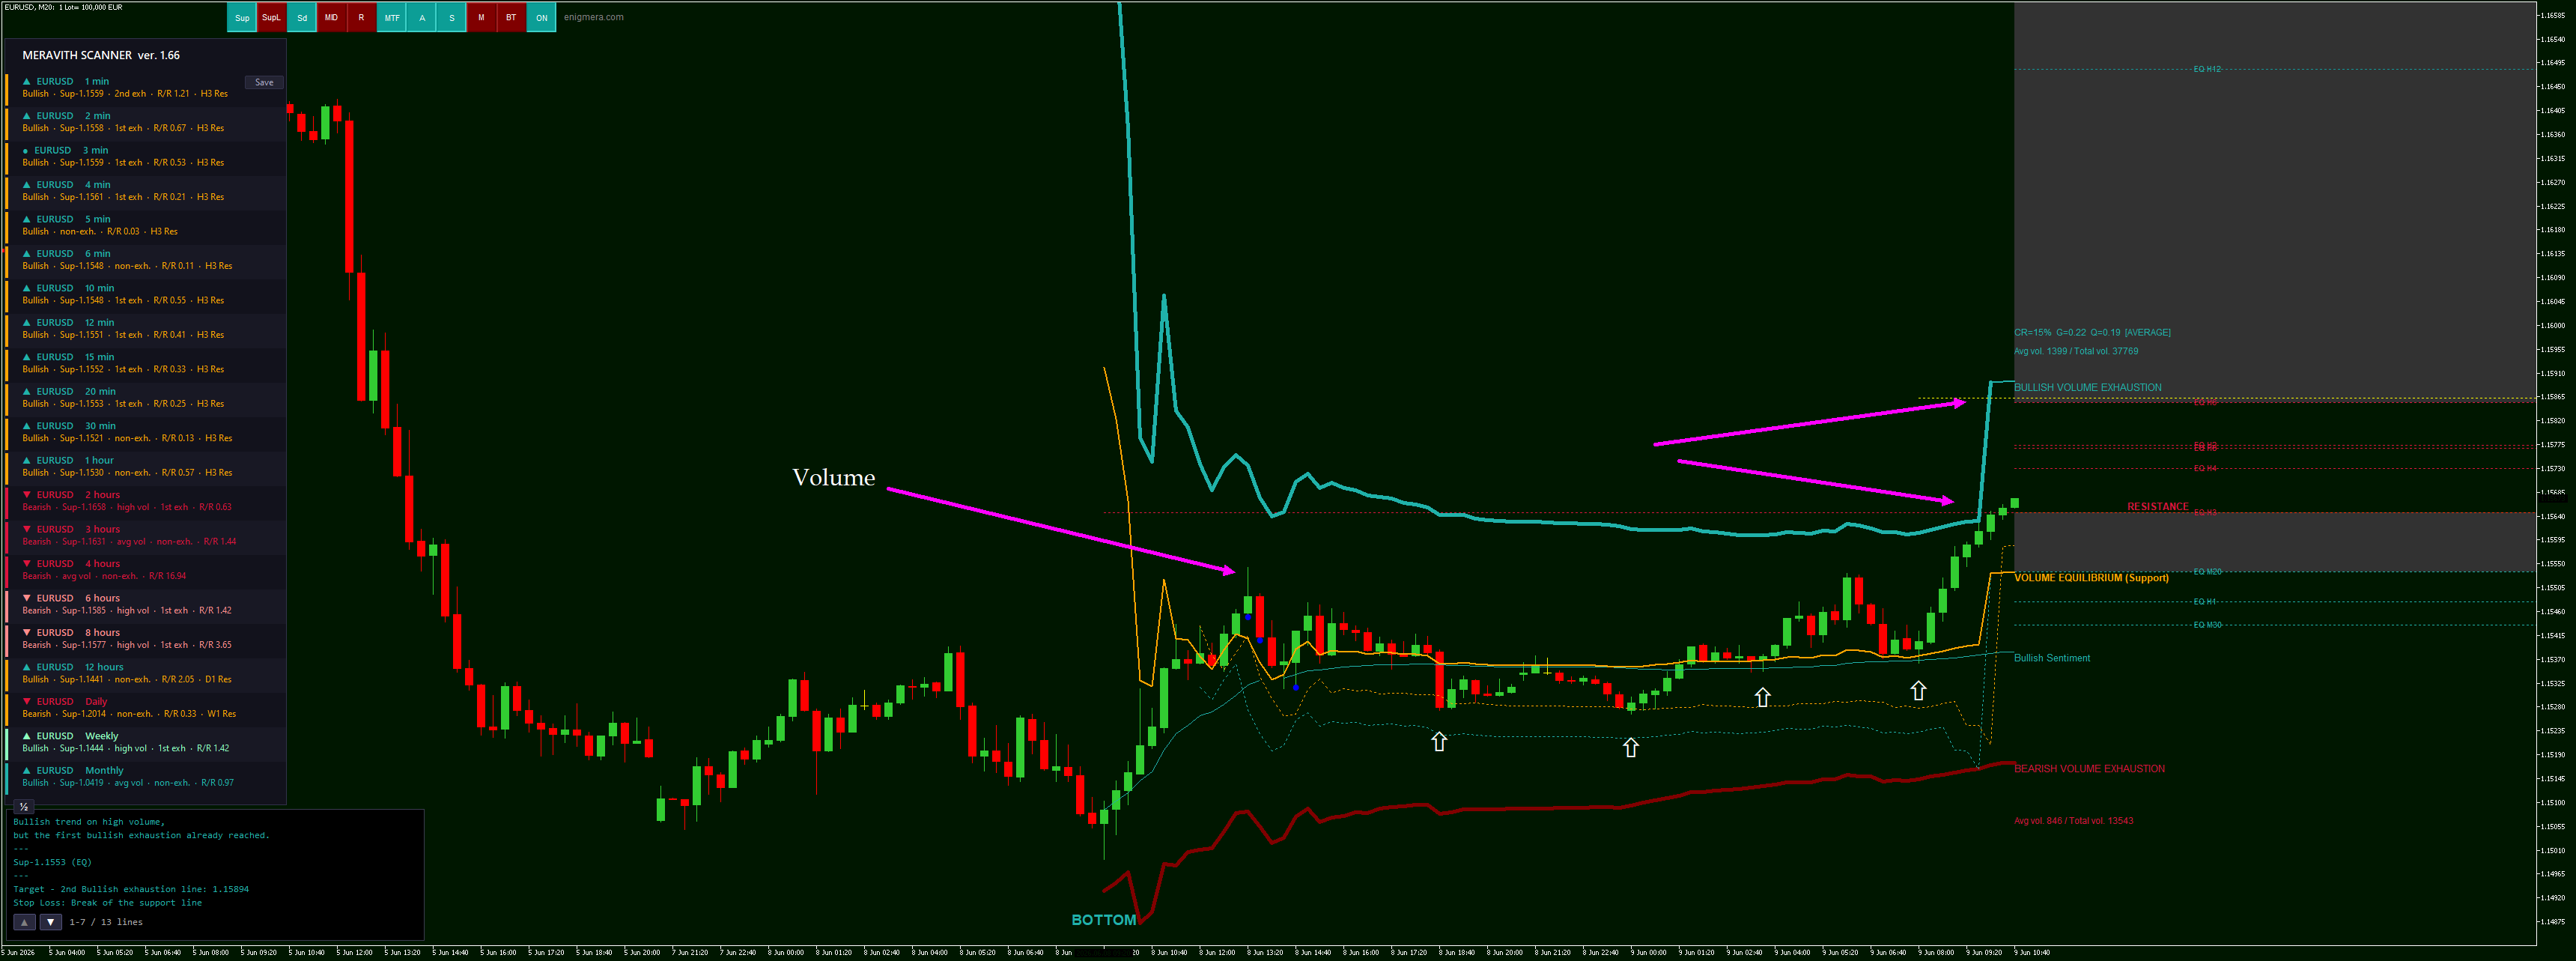
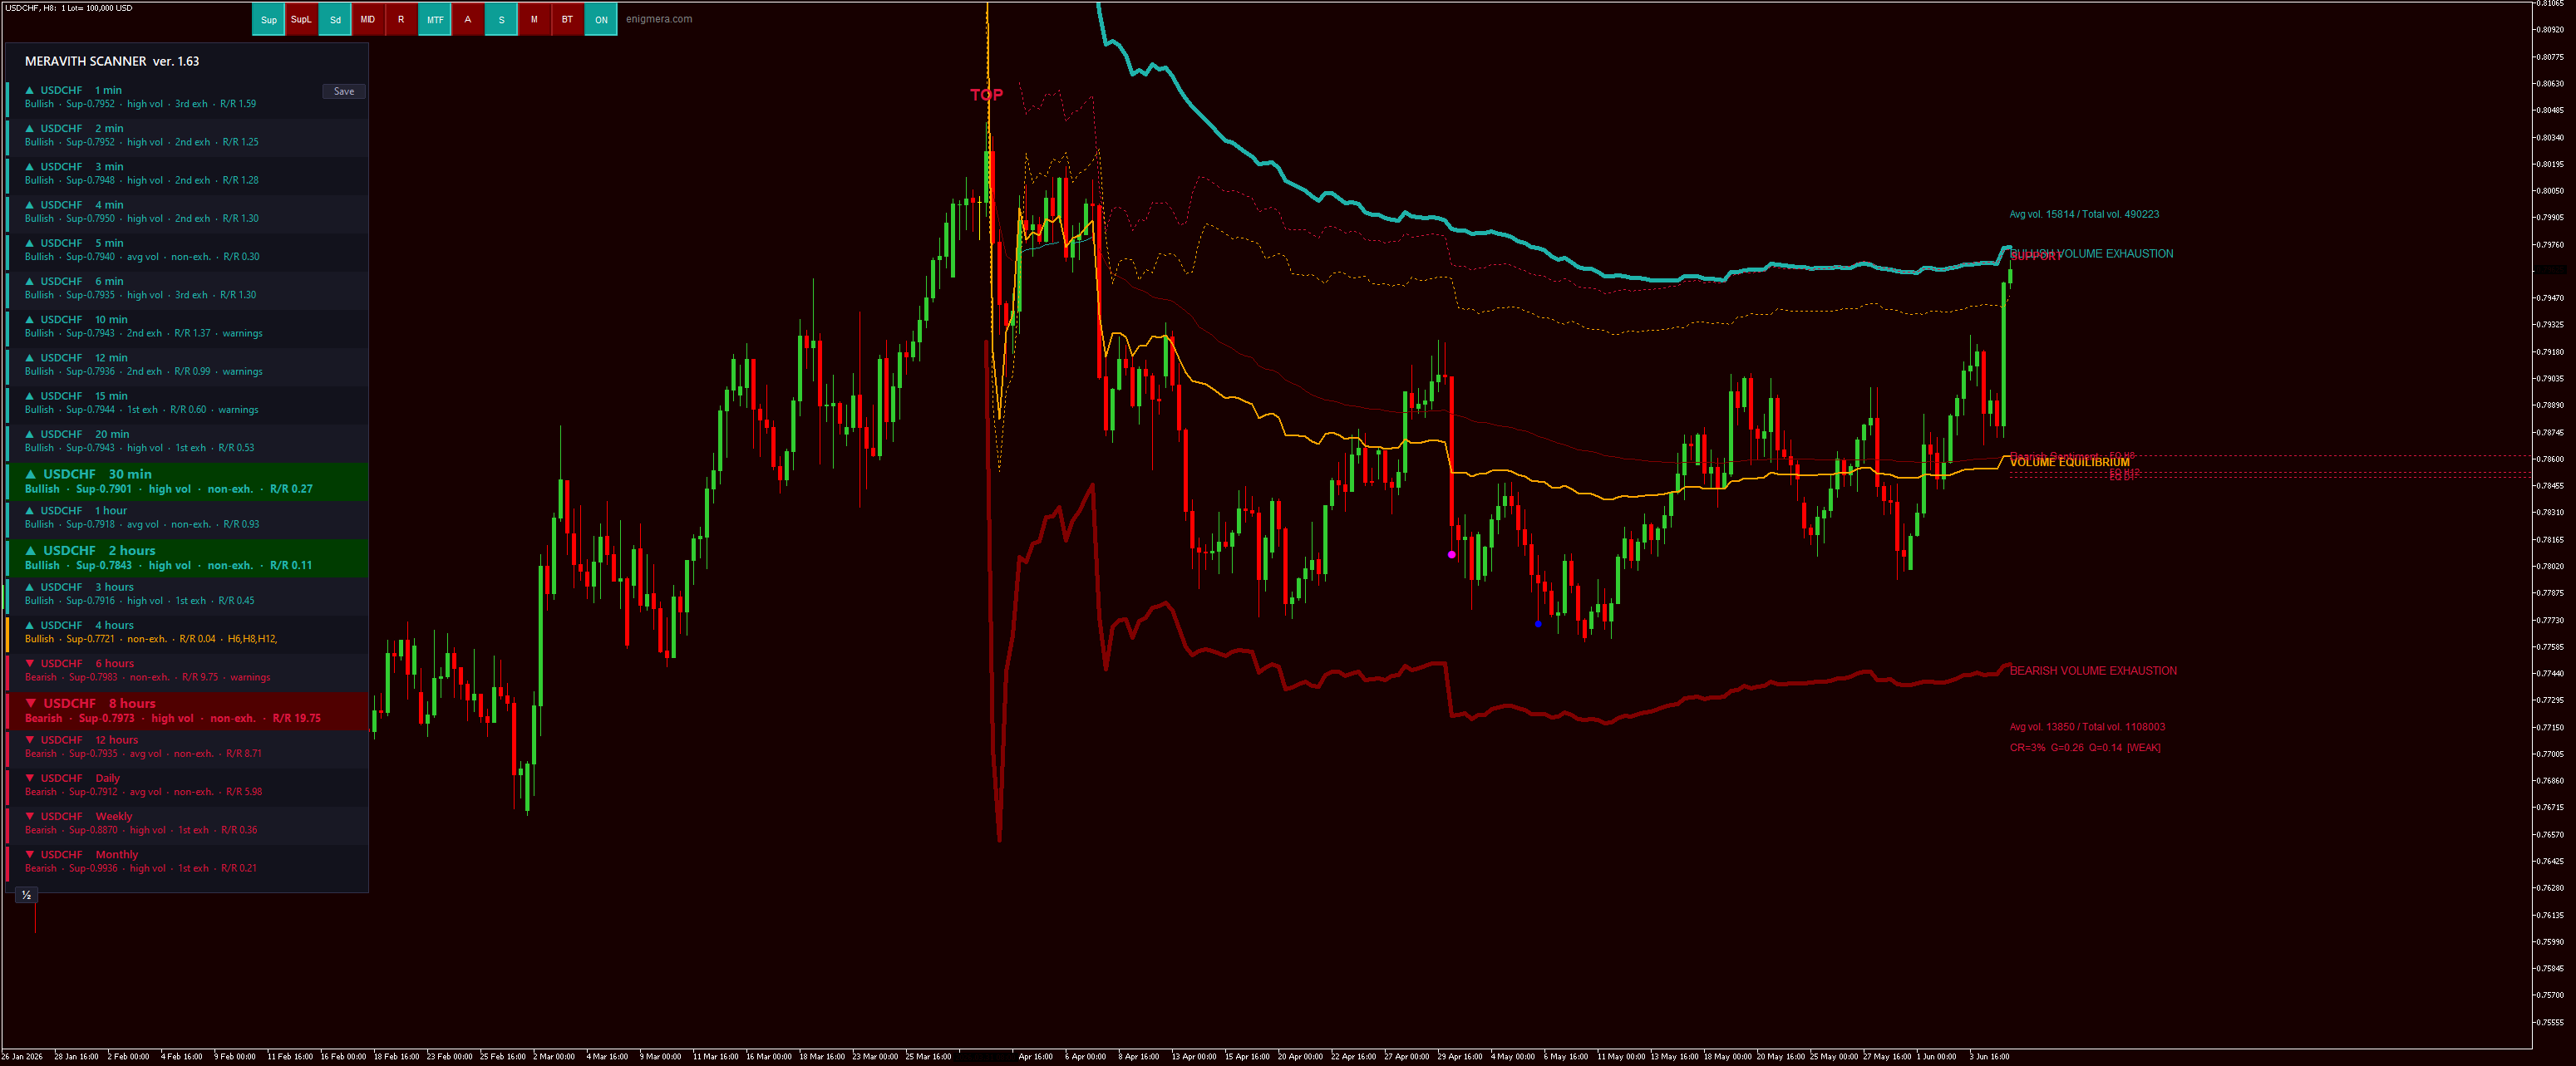
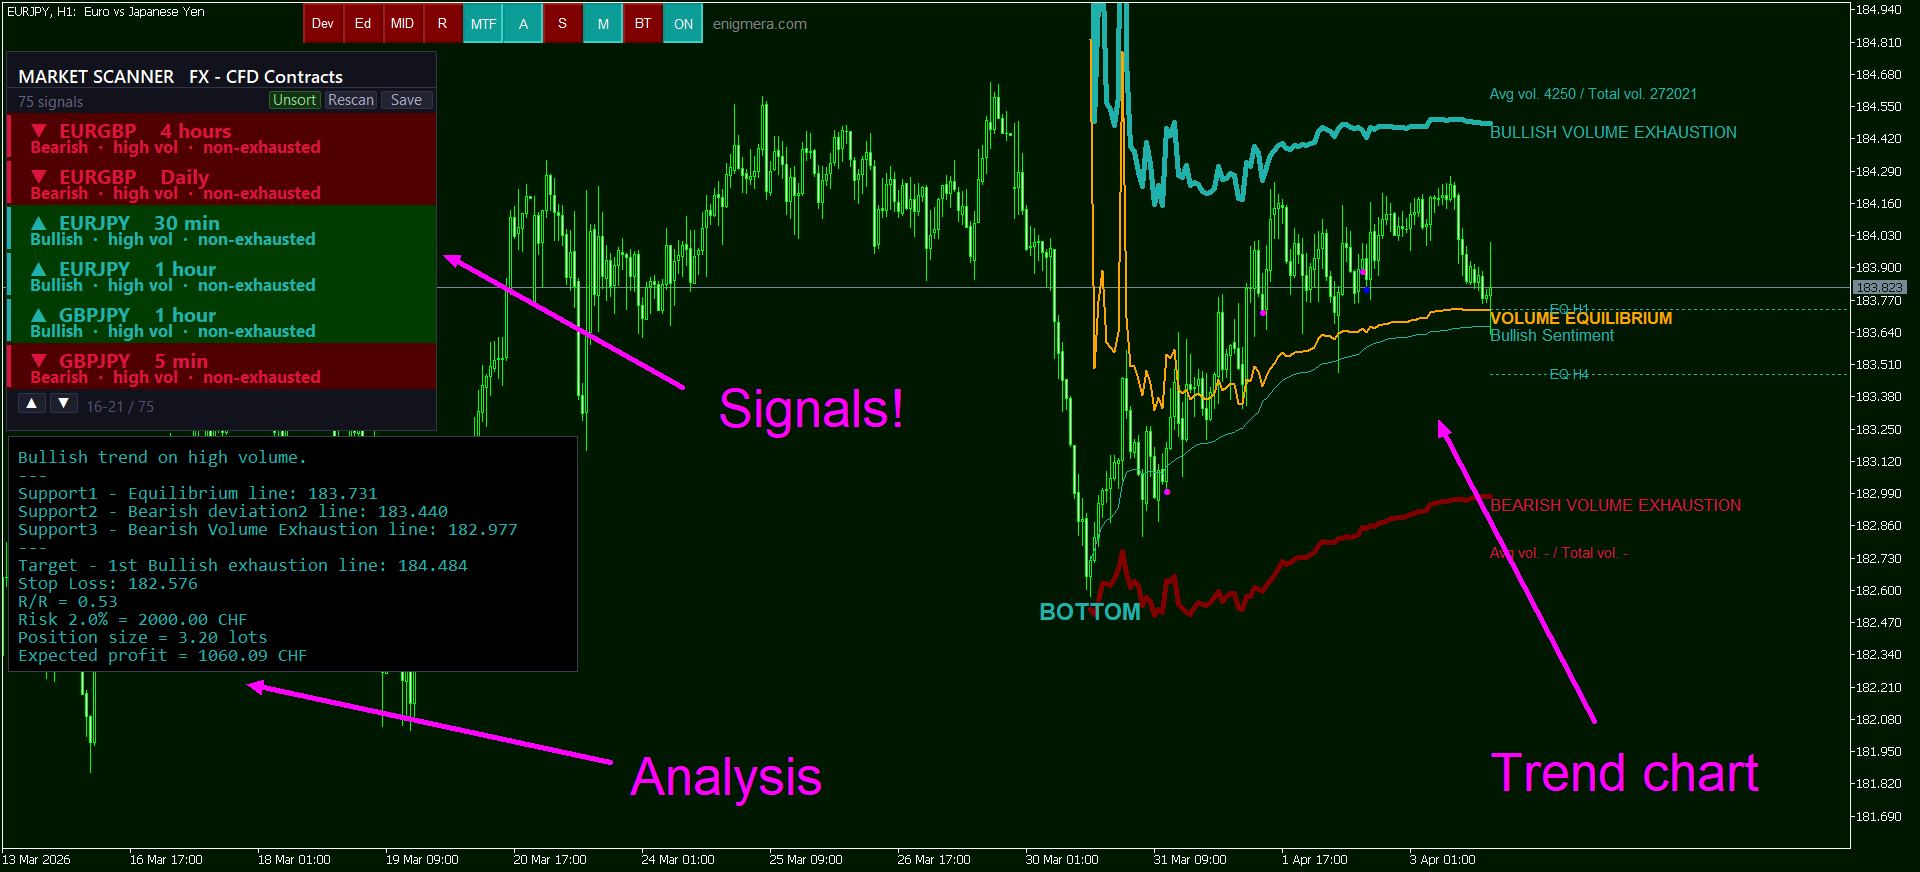
Göstergе, herhangi bir noktadan hacmi analiz eder ve bu hacim için piyasanın tükeniş seviyelerini hesaplar. Meravith’in ana çizgileri: Boğa hacim tükeniş çizgisi – hedef olarak kullanılır. Ayı hacim tükeniş çizgisi – hedef olarak kullanılır. Trend çizgisi – piyasa trendini gösterir. Piyasanın boğa mı ayı mı olduğuna bağlı olarak rengi değişir ve trend desteği görevi görür. Nasıl kullanılır: Mor dikey çizgiye çift tıklayın ve istediğiniz konuma taşıyın. Her şeyi analiz edebilirsiniz – trendleri
Mode 1 - the profile is calculating from the initial point of the indicator to the most current candle.
Mode 2 - the profile is calculating from top to bottom (or viceversa)
In Elliott Wave Theory, a triangle forms in wave 4 or B — never in wave 2.
It’s a pattern that confirms the trend.
Let’s look at the example above.
This is indeed a triangle, and it has broken to the upside, which means that when you see it, you should start buying immediately.
However, there’s a nuance here — volume. You can’t see the volume, and that makes it hard to know whether this triangle will actually break and only then produce a move either up or down.
This is where Transaction Speed can help determine direction.
Notice how the entire triangle is located within the accumulation zone — not just a part of it.
If volume were accumulating only in the area near the bottom of the supposed wave 4, then there would be no problem with buying. But in this case, the triangle has absolutely no significance, because it’s not the one defining the levels.
In such a scenario, the triangle can be easily invalidated and is not a reliable pattern.
Keep in mind that, very often at the end of many trends, similar situations form that look like triangles but aren’t — and when everyone expects continuation, the price makes a sharp reversal.
Actually the market will respect not the triangle, but the Transaction Speed levels i.e. the accumulated volume.