Oleg Rodin / Profil
- Bilgiler
|
12+ yıl
deneyim
|
49
ürünler
|
545
demo sürümleri
|
|
0
işler
|
0
sinyaller
|
0
aboneler
|
Merhaba!
15 yıldır tüccar ve ticaret yazılımı geliştiricisiyim. Burada, farklı piyasalarda ticaret yapmak için kullanılabilecek yüksek kaliteli araçlar sağlayarak diğer tüccarlarla deneyimlerimi paylaşmak için elimden gelenin en iyisini yapıyorum.
Amacım, dünyanın her yerinden tüccarların şu anda sahip oldukları deneyim düzeyi ne olursa olsun ticarette başarı elde etmelerine yardımcı olmaktır. Bu yüzden buradayım.
En kaliteli desteğim ve araçlarım ile her tüccar ticarette kolayca daha iyi hale gelebilir.
15 yıldır tüccar ve ticaret yazılımı geliştiricisiyim. Burada, farklı piyasalarda ticaret yapmak için kullanılabilecek yüksek kaliteli araçlar sağlayarak diğer tüccarlarla deneyimlerimi paylaşmak için elimden gelenin en iyisini yapıyorum.
Amacım, dünyanın her yerinden tüccarların şu anda sahip oldukları deneyim düzeyi ne olursa olsun ticarette başarı elde etmelerine yardımcı olmaktır. Bu yüzden buradayım.
En kaliteli desteğim ve araçlarım ile her tüccar ticarette kolayca daha iyi hale gelebilir.
Oleg Rodin
Gann Made Easy. BTCUSD M30. Watch for Gann 8/8 area. If the price breaches it, the chance is high we will the price going down toward the TP1 area.
Oleg Rodin
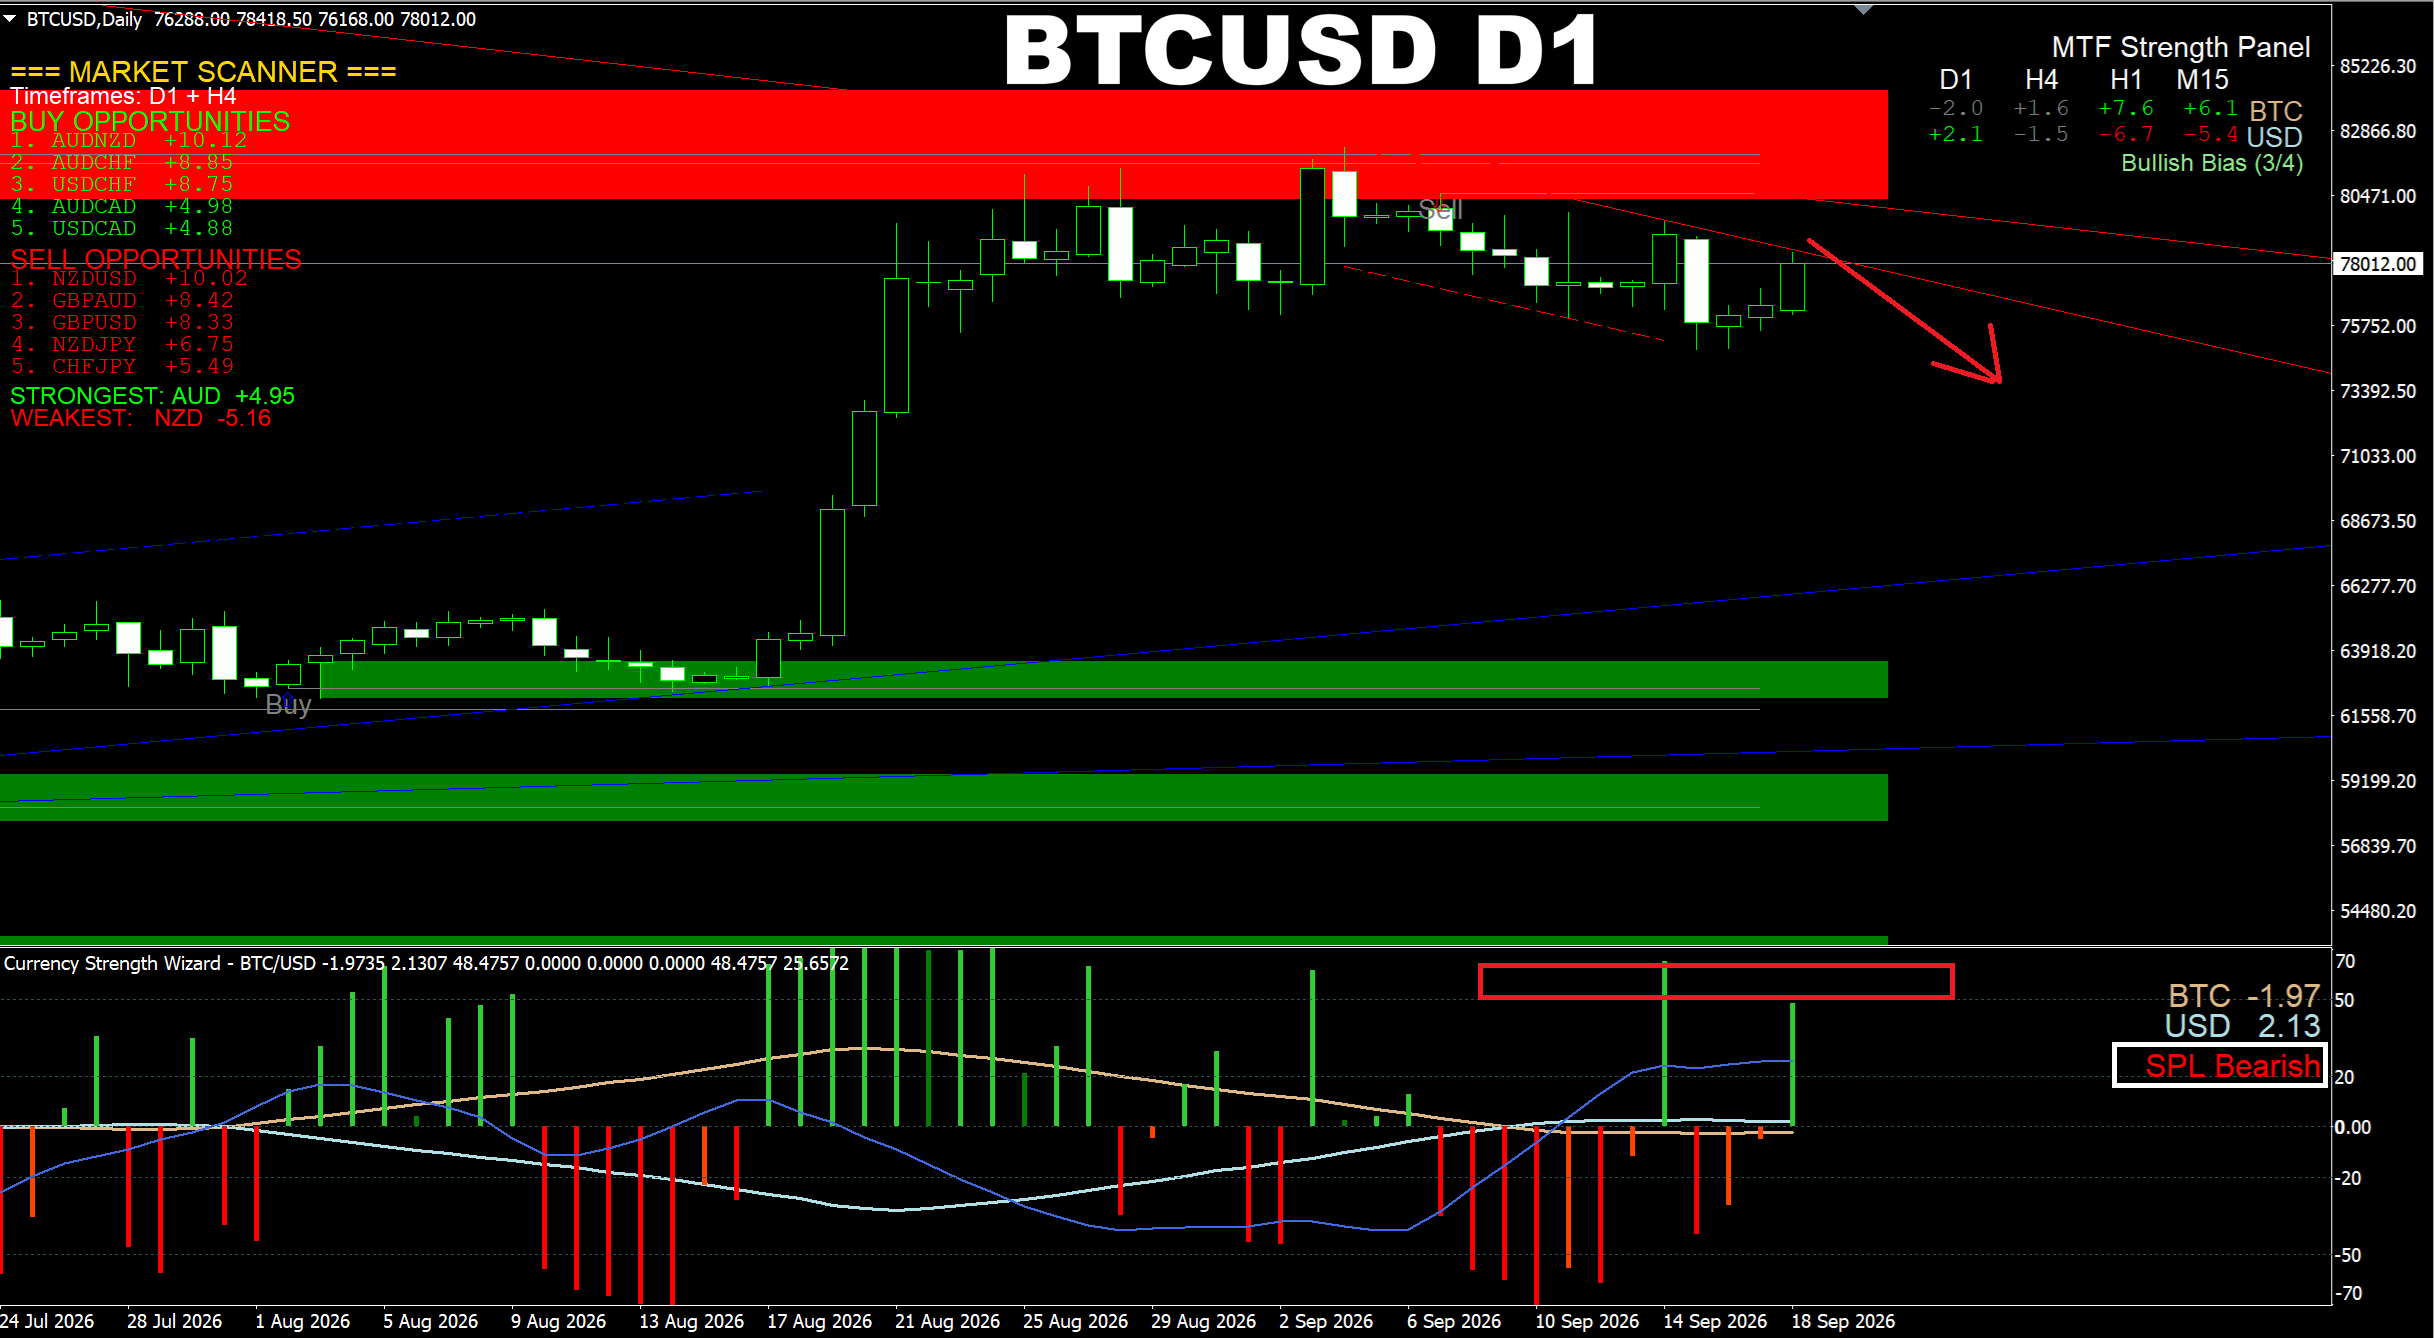
Currency Strength Wizard. BTCUSD D1. Update on current market. We have a selling wave toward Support shown by the Buy line in the screenshot.
Oleg Rodin
Scalper Vault. GBPUSD M15. I want to show one more example showing the breakout signals type I mentioned in my recent post regarding the ways of trading with the dot signal type. Here I want to show you how easy it is to tell if we have breakout conditions or not. Actually if you have an arrow signal and the dot type signal on the same candle, it means this is a breakout type signal which will probably lead the price in the predicted direction. I hope the tips I share with you here, will be helpful to you in real trading.
Oleg Rodin
Scalper Vault. USDJPY H1. I would like to show you how the dot type signal in the indicator can be helpful for us to detect breakouts. This info will be helpful to all users of the indicator. If you're a user of this indicator, you already know that we can work with such signals using different techniques where they can be helpful for exit and even entry. But such signals can also be used to detect breakouts. If you see a series of dot signals like I've just shown in the screenshot, it means we have a clear Support area there (based on this example). When we start noticing the trend line to change its color, it will be the sign that the price may break that area. But the moment of breakout is the situation when price breaks the area shown by the dot signals. And this will be a confirmed breakout for us which we can use for a SELL entry, especially if we have the signal arrow and the dot signal on the same candle.
Oleg Rodin
SR Liquidity. USDJPY M1. Default Mode 3. Confirmed patterns only. A new opposite pattern still has not been provided, it means the selling pressure is still there.
Oleg Rodin
Currency Strength Wizard system. EURUSD H1. Another update on current market. Now price has reached the predicted area.
Oleg Rodin
Currency Strength Wizard system. EURUSD H1. Another update on current market. Price has reached the main target. But it will go higher toward the opposite border of the channel.
Oleg Rodin
Currency Strength Wizard. GBPUSD D1. We have a SELL pattern almost formed on D1 TF. The Swing Predictor line is showing high probability of a SELL reversal in the near future.
: