Техническое задание
Id like to see the COT report data represented in the following way
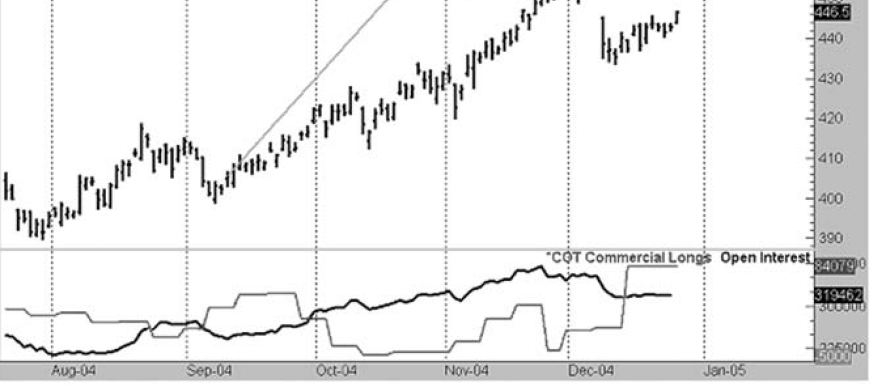
Commercials Net positions - Represented as a Red line
Large speculators Net positions Represented as a Green line
With a blue zero line representing Long positions are above and if Net short then line is below.
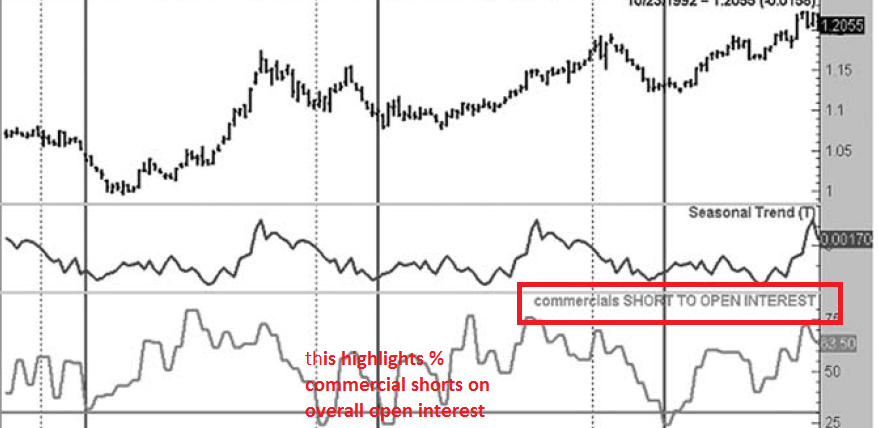
Another piece of data I would want to show is the open interest % rate for commercials
For example if commercials have 100,000 contracts NET LONG and EURUSD overall open interest is 200,000 then the commercial open interest Net Long % would be 50% and show be displayed as it would on a stochastic indicator.
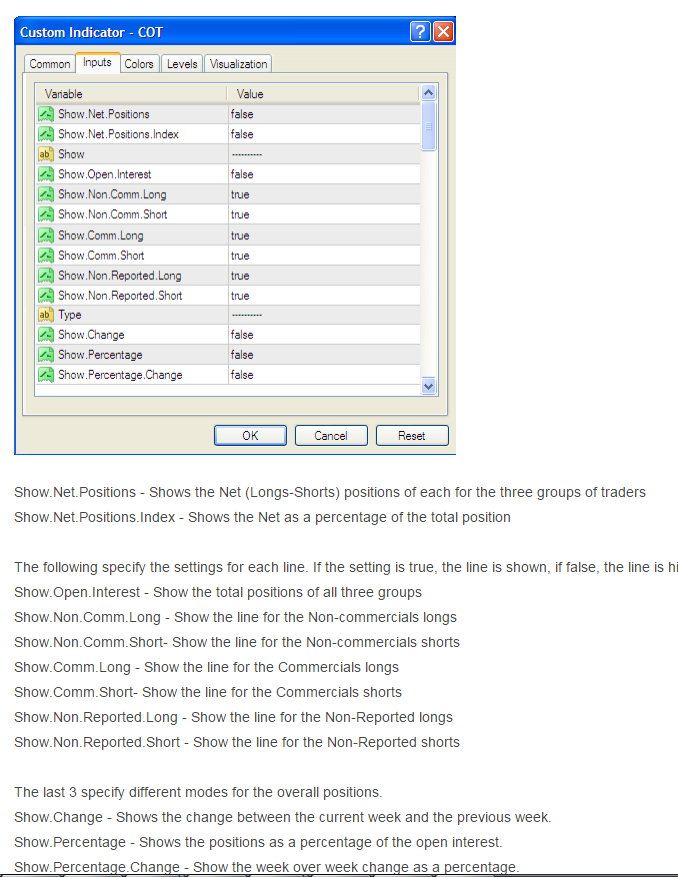
I also require that the indicator allow to show and hide the data points ie - show only commercials, show only open interest % etc
The above data is to be able to be used on any time frame but the indicator itself is based on Weekly charts/data and will need to include the last 2 years of historical data for EUR USD & USD YEN
Prefer to work within contractor that actually knows what COT is and possibly built some form of project based on this data.
Attached are a couple pictures giving a guide on what id like including a sample extern option screen