Hello all,
I am looking for someone who can construct an indicator in MT5 for the purpose of continuously populating a selected Currency’s chart with Bullish and Bearish Fibonacci Retracements to the effect that all candles on a selected chart within the preselected timeframe will be encapsulated in one or more Fib Retracements, as well as plot new Fib Retracements as new candlesticks close overtime and fulfill charting parameters. This indicator will ultimately function as the foundation to my trading strategy which depends on these charts, so before constructing a full trading EA, I am wanting to build this Charting Function first.
Upon startup, this indicator should look for any candlesticks that fulfill the parameters of any of the 4 Bearish or 4 Bullish charting situations that are detailed to be found on a chart.
-Essentially, every candle close that is immediately preceded by a candlestick of the opposite nature will then be eligible for an initial chart to be drawn with the coordinates for the fib chart placed at the high and low of the closed candlestick in question.
-If there is a sequence of 2 or more candles that are the same nature of the most recent initial candle, then a second chart would be eventually drawn after the sequence is ended by the formation of a closed candlestick of the opposite nature.
-The other two charting instances occur when the candle, or any candle from the series of candlesticks which immediately precedes the initial charting candle possess an extended high or low that reaches a higher or lower point than the high or low of the initial candle in question then that candles relative high or low would also be an eligible coordinate for use when plotting the second point in one of these charting instances.
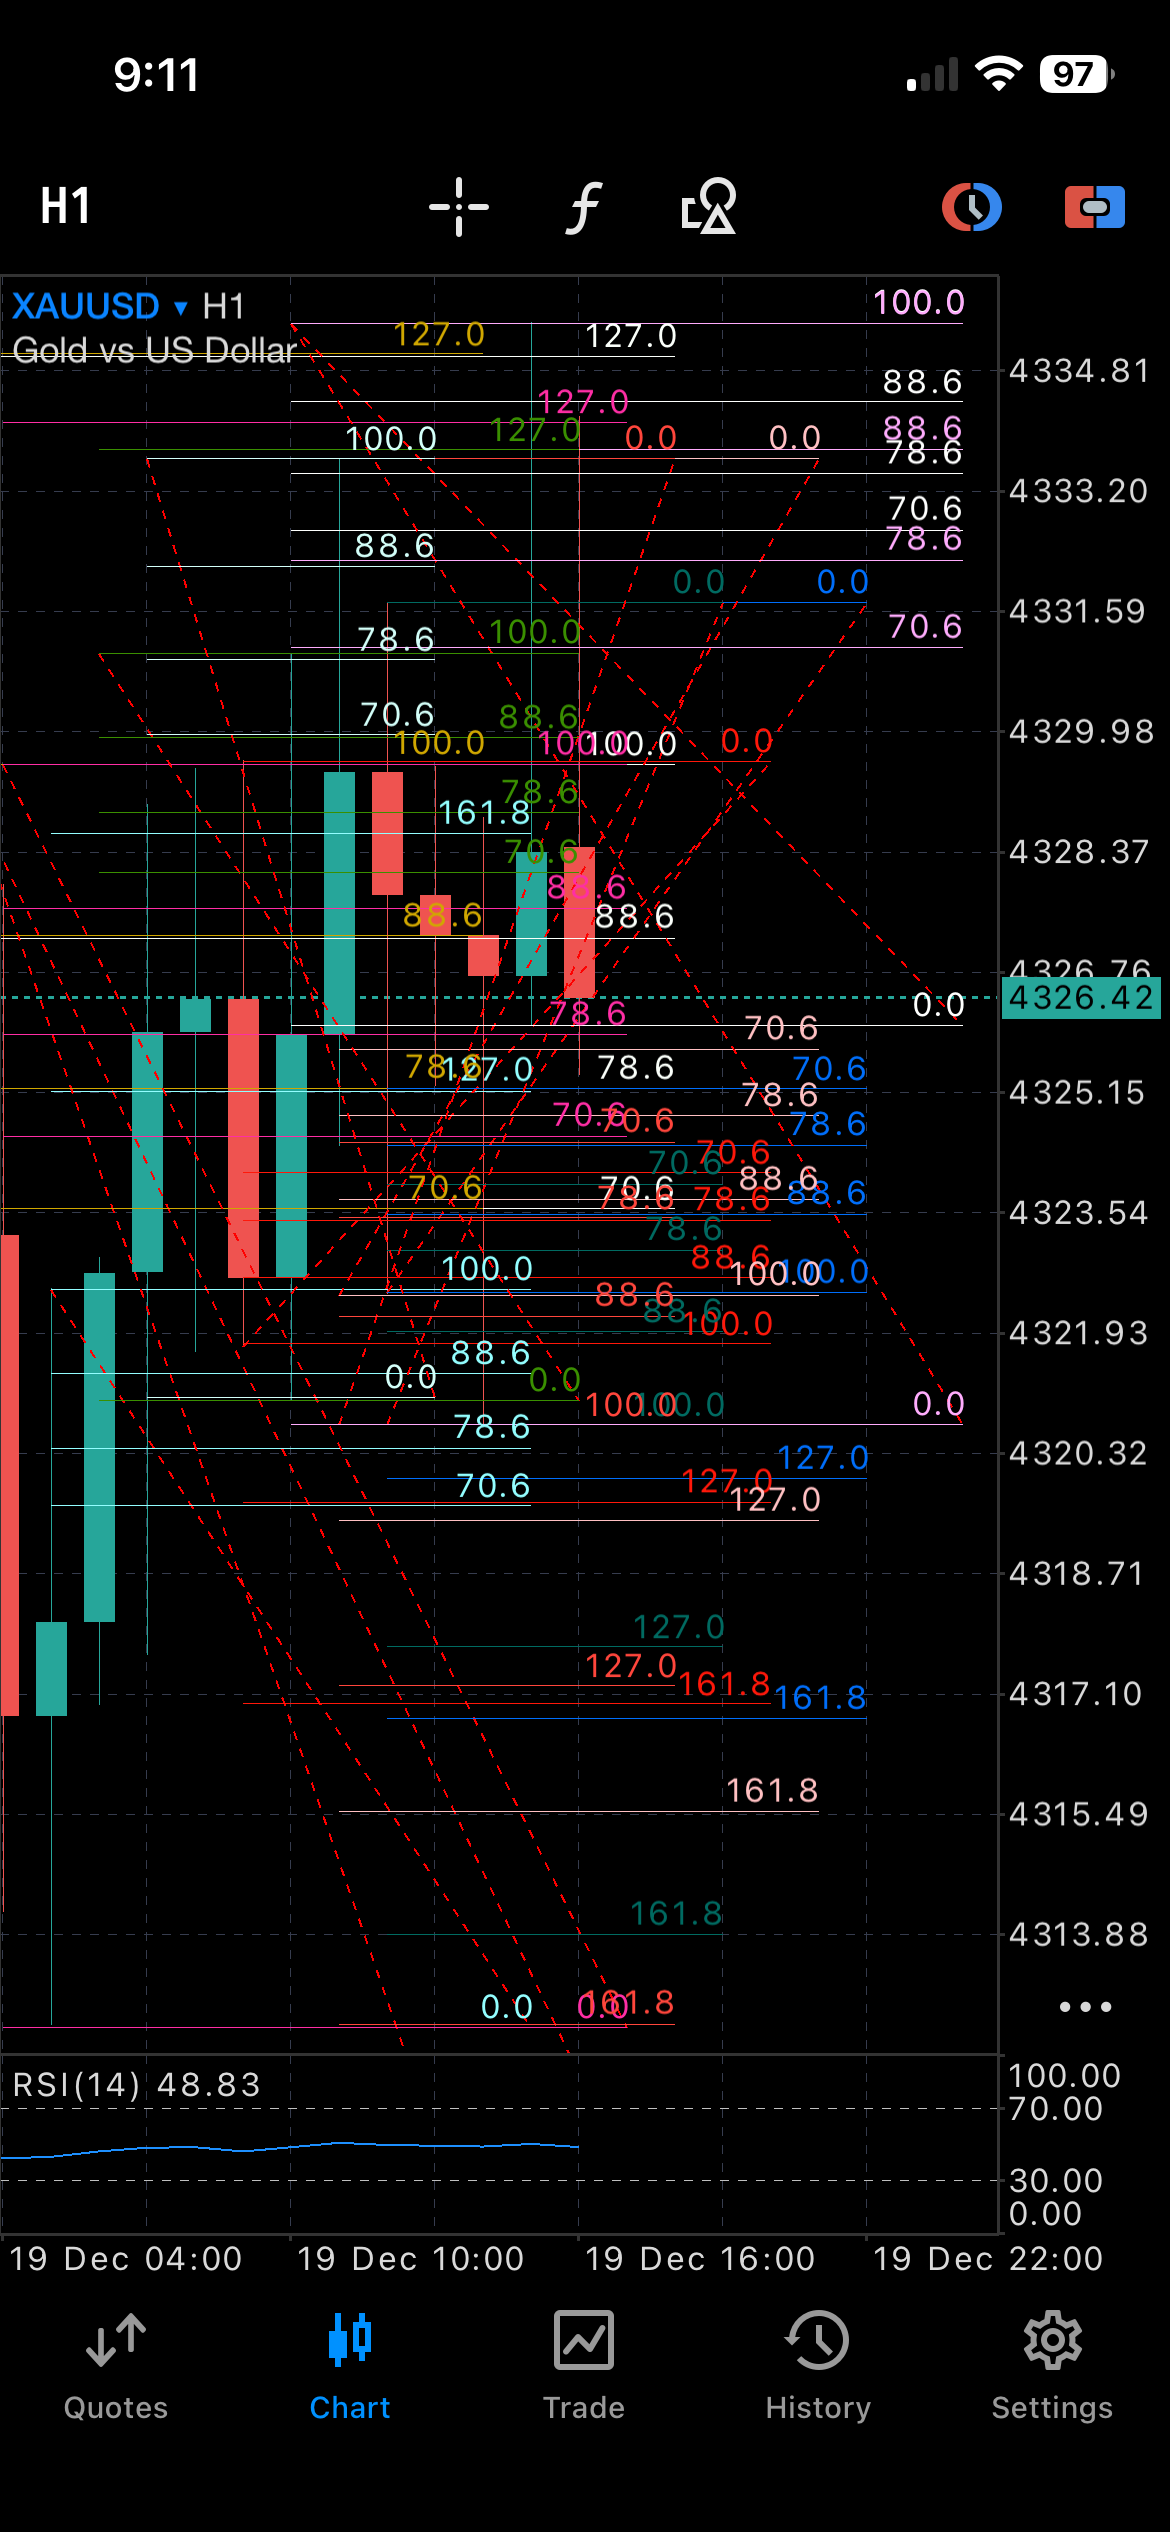
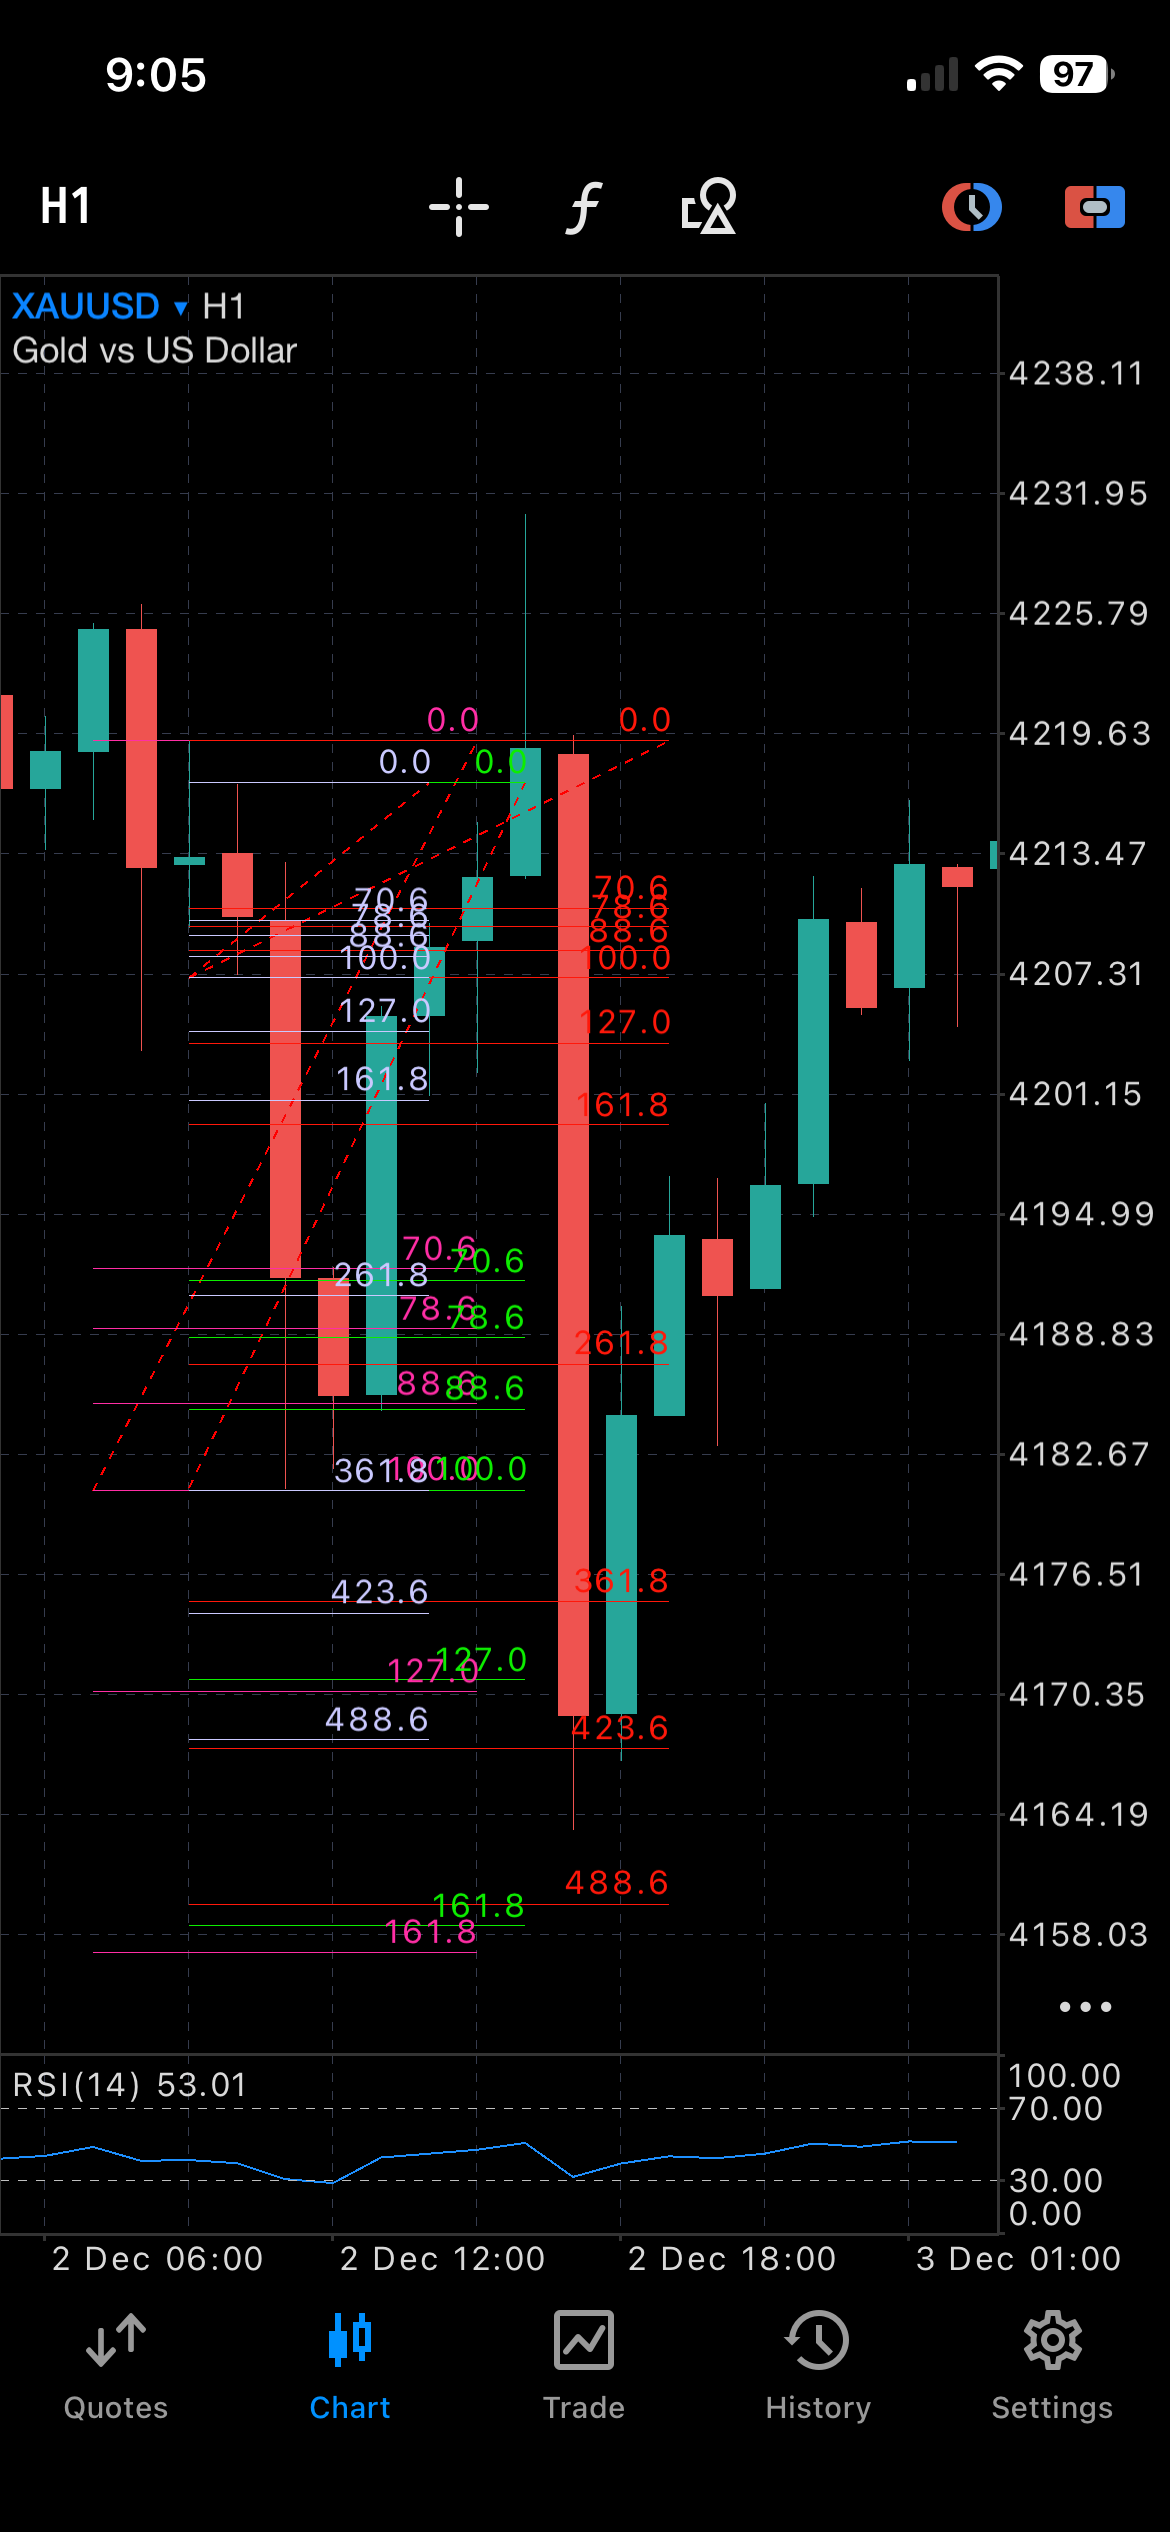
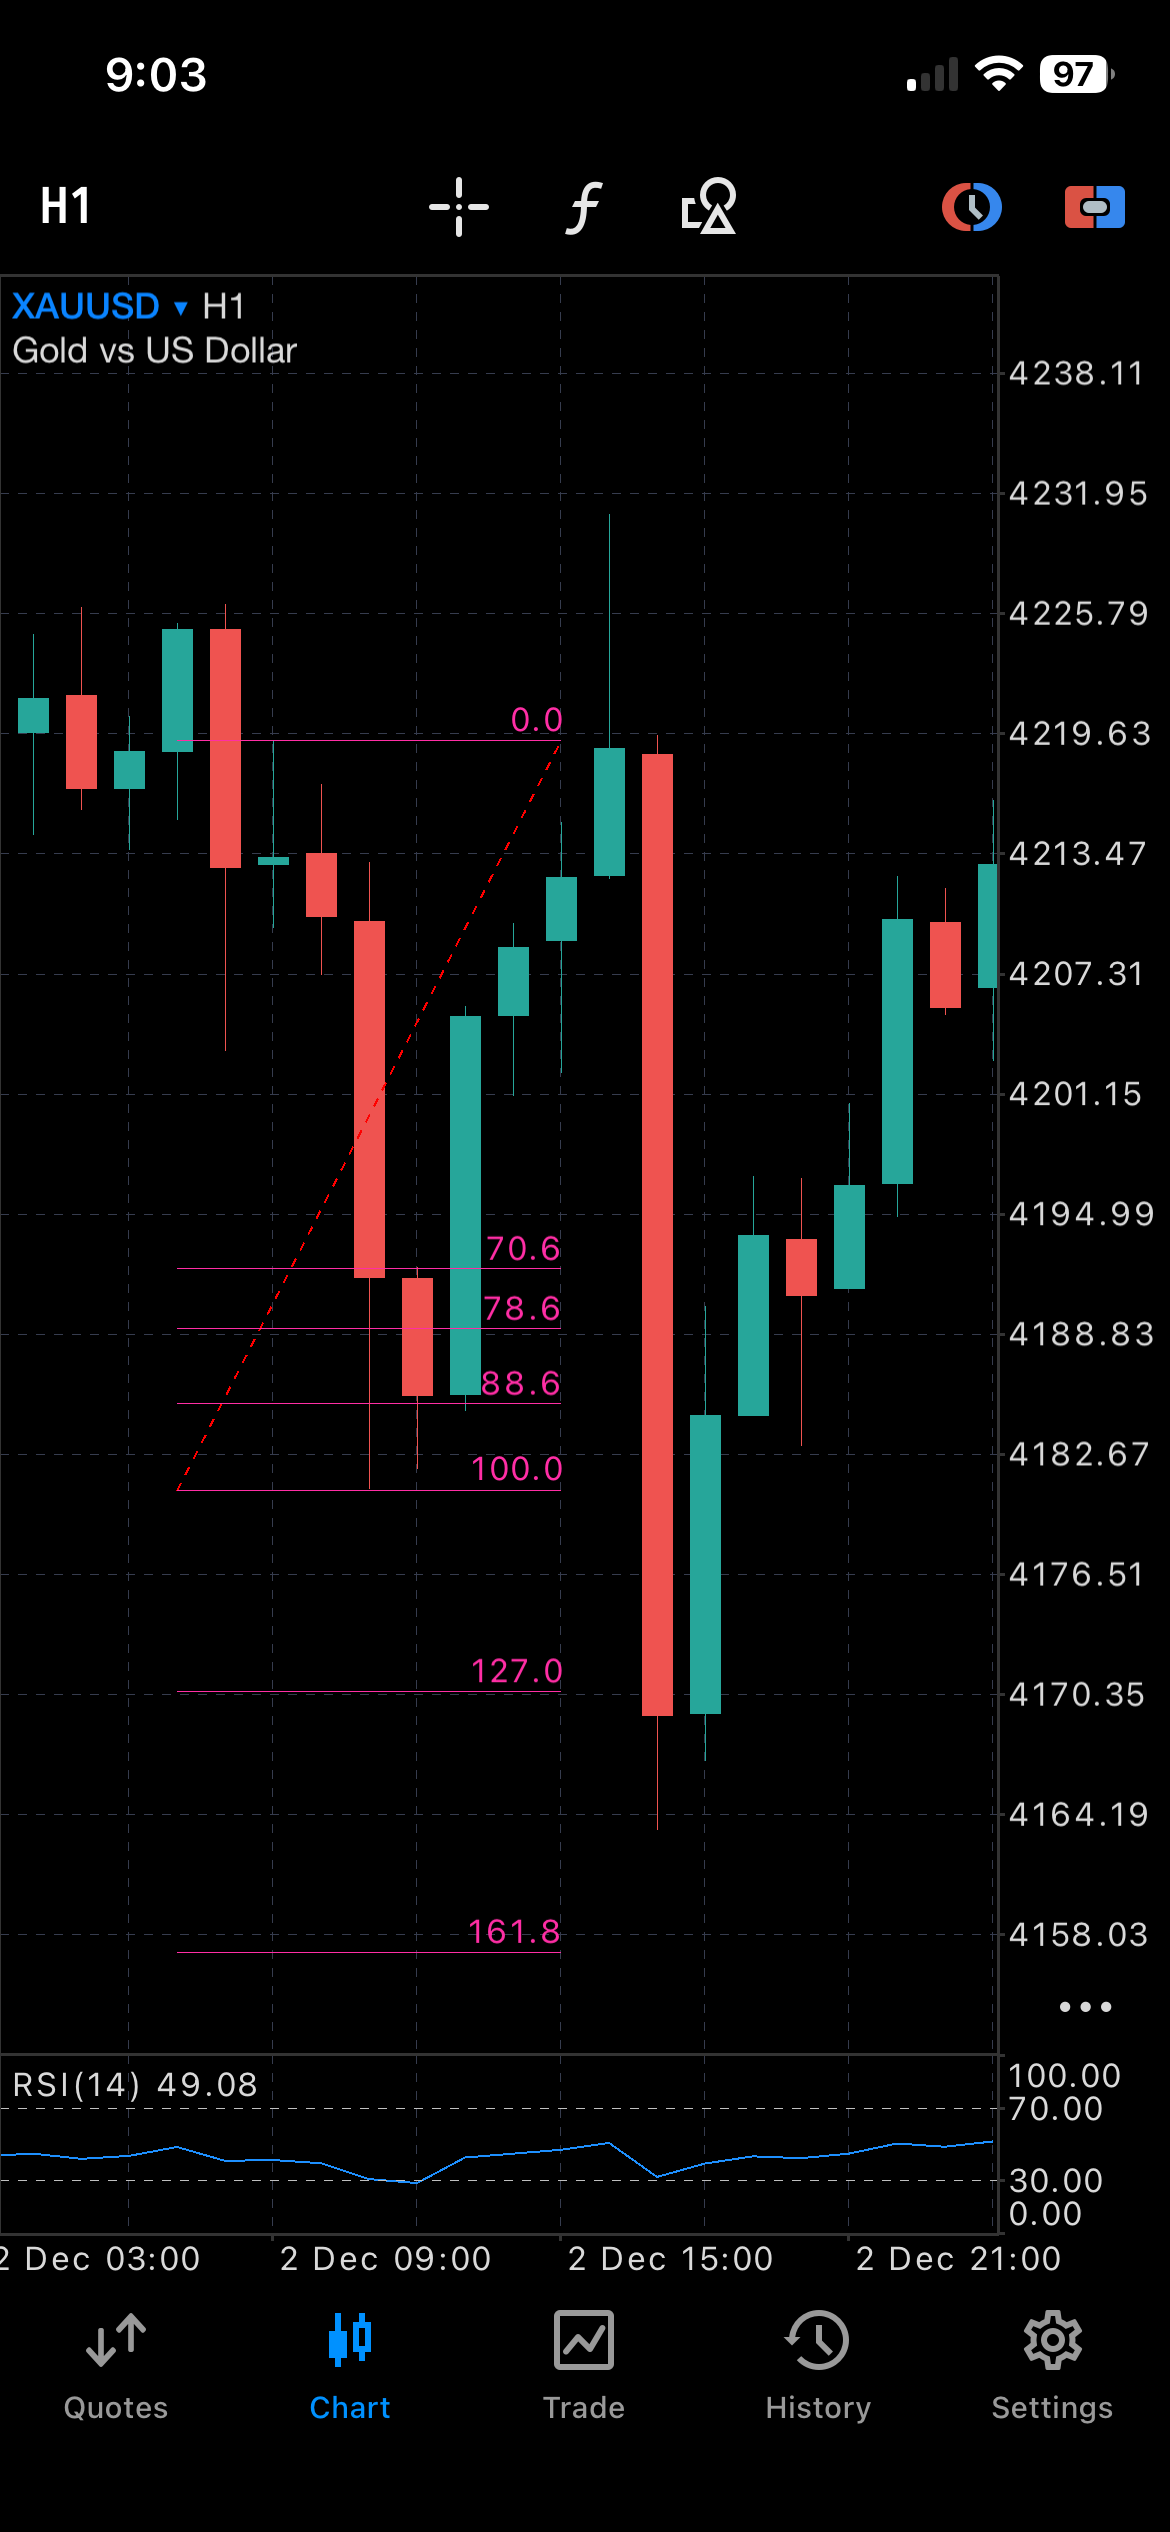
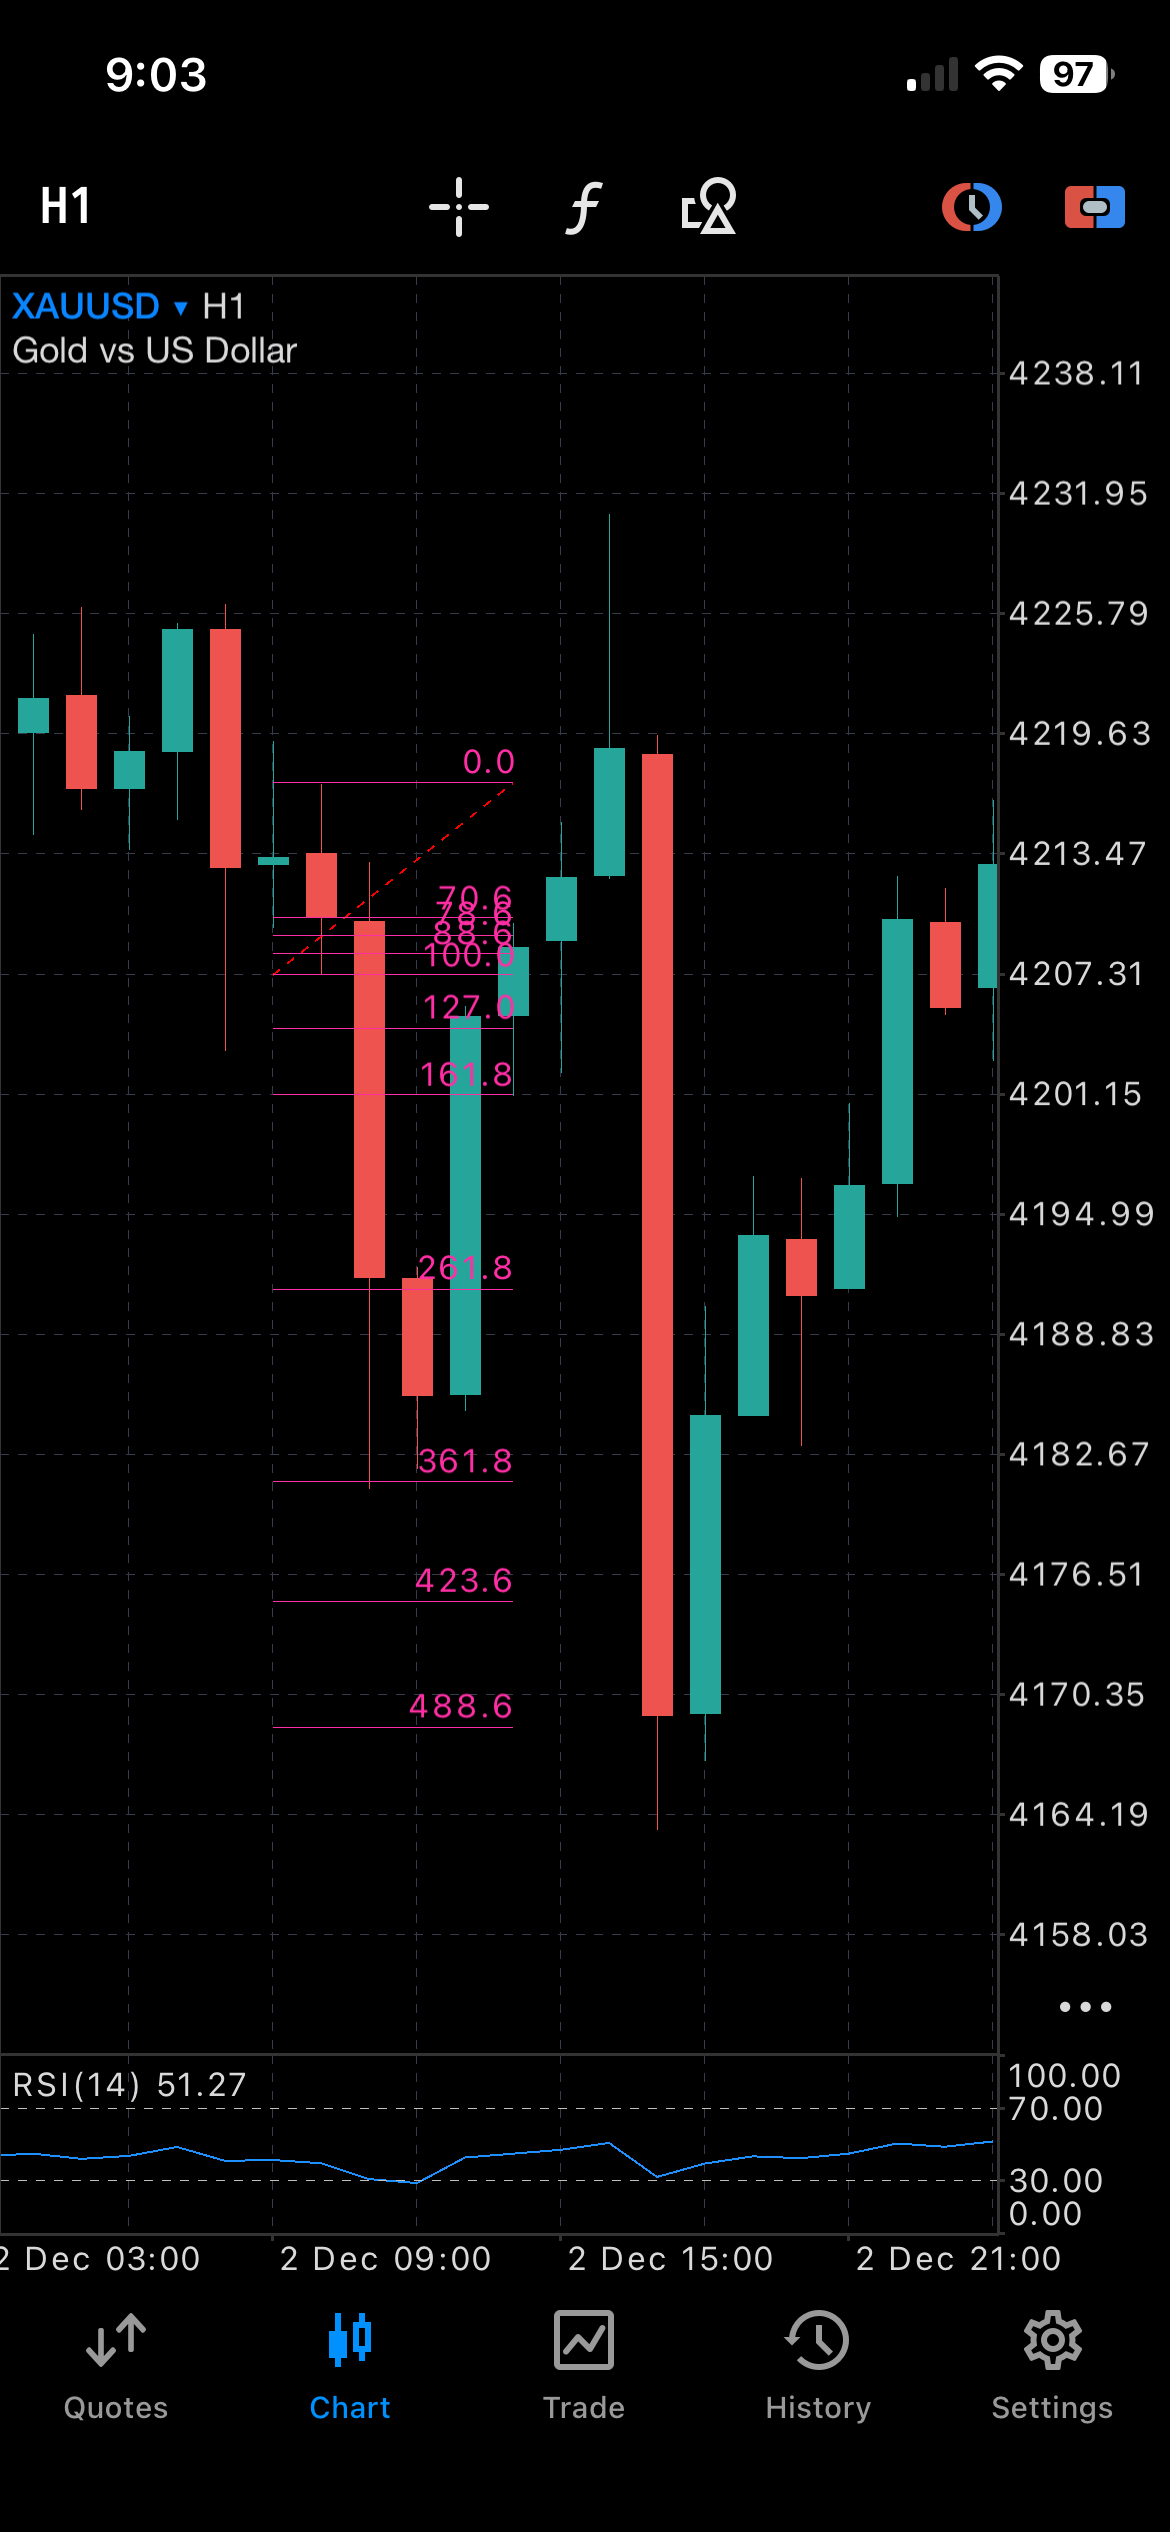
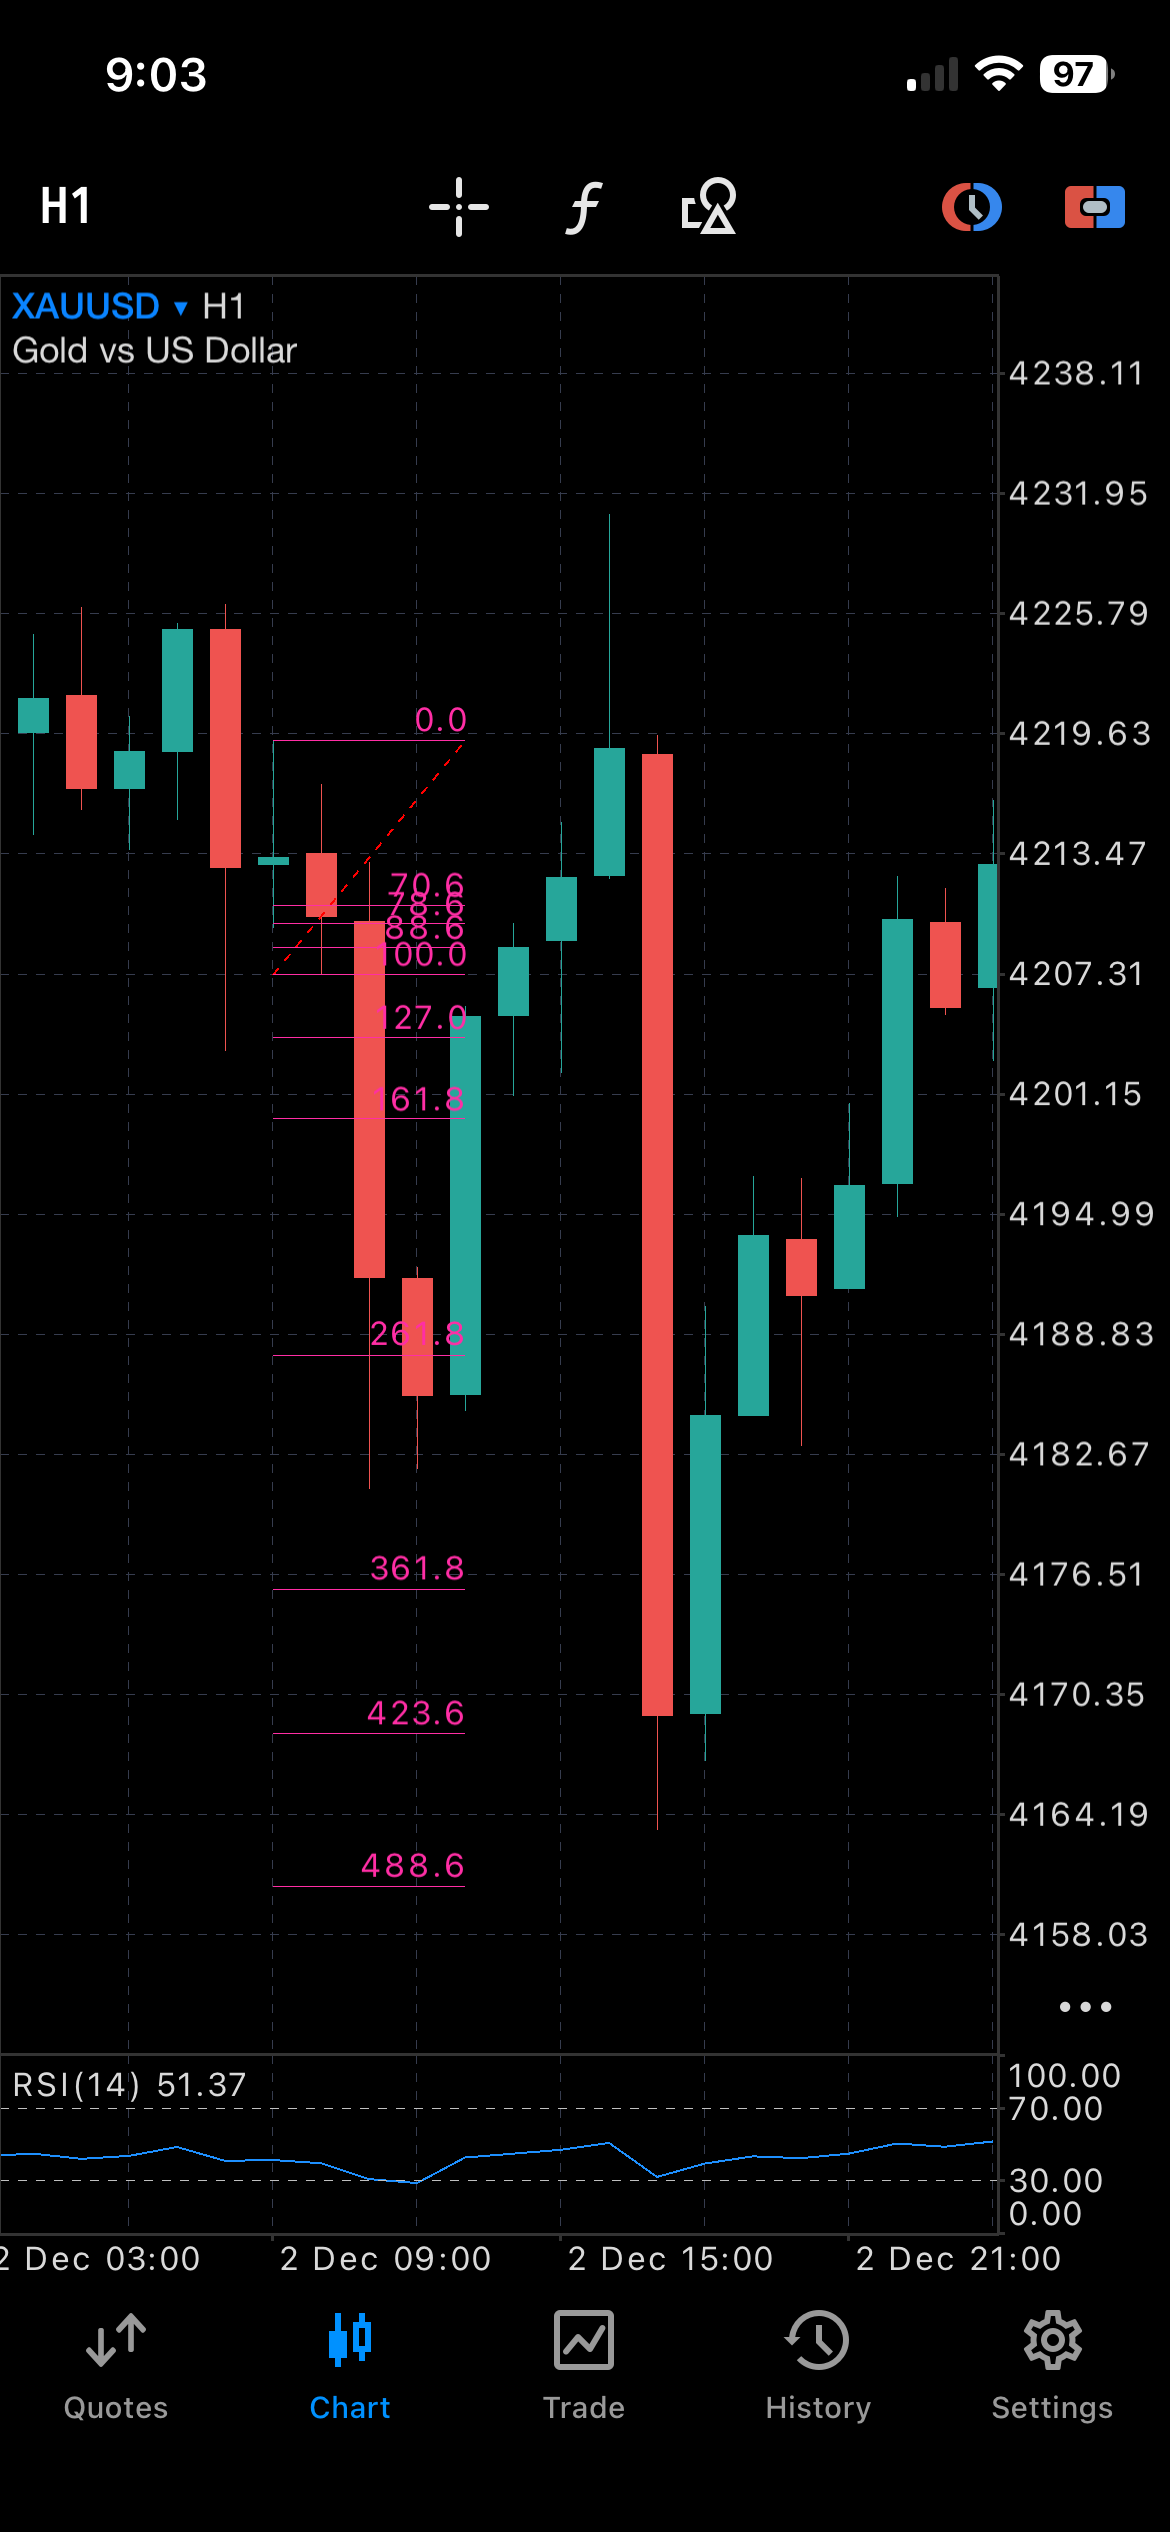
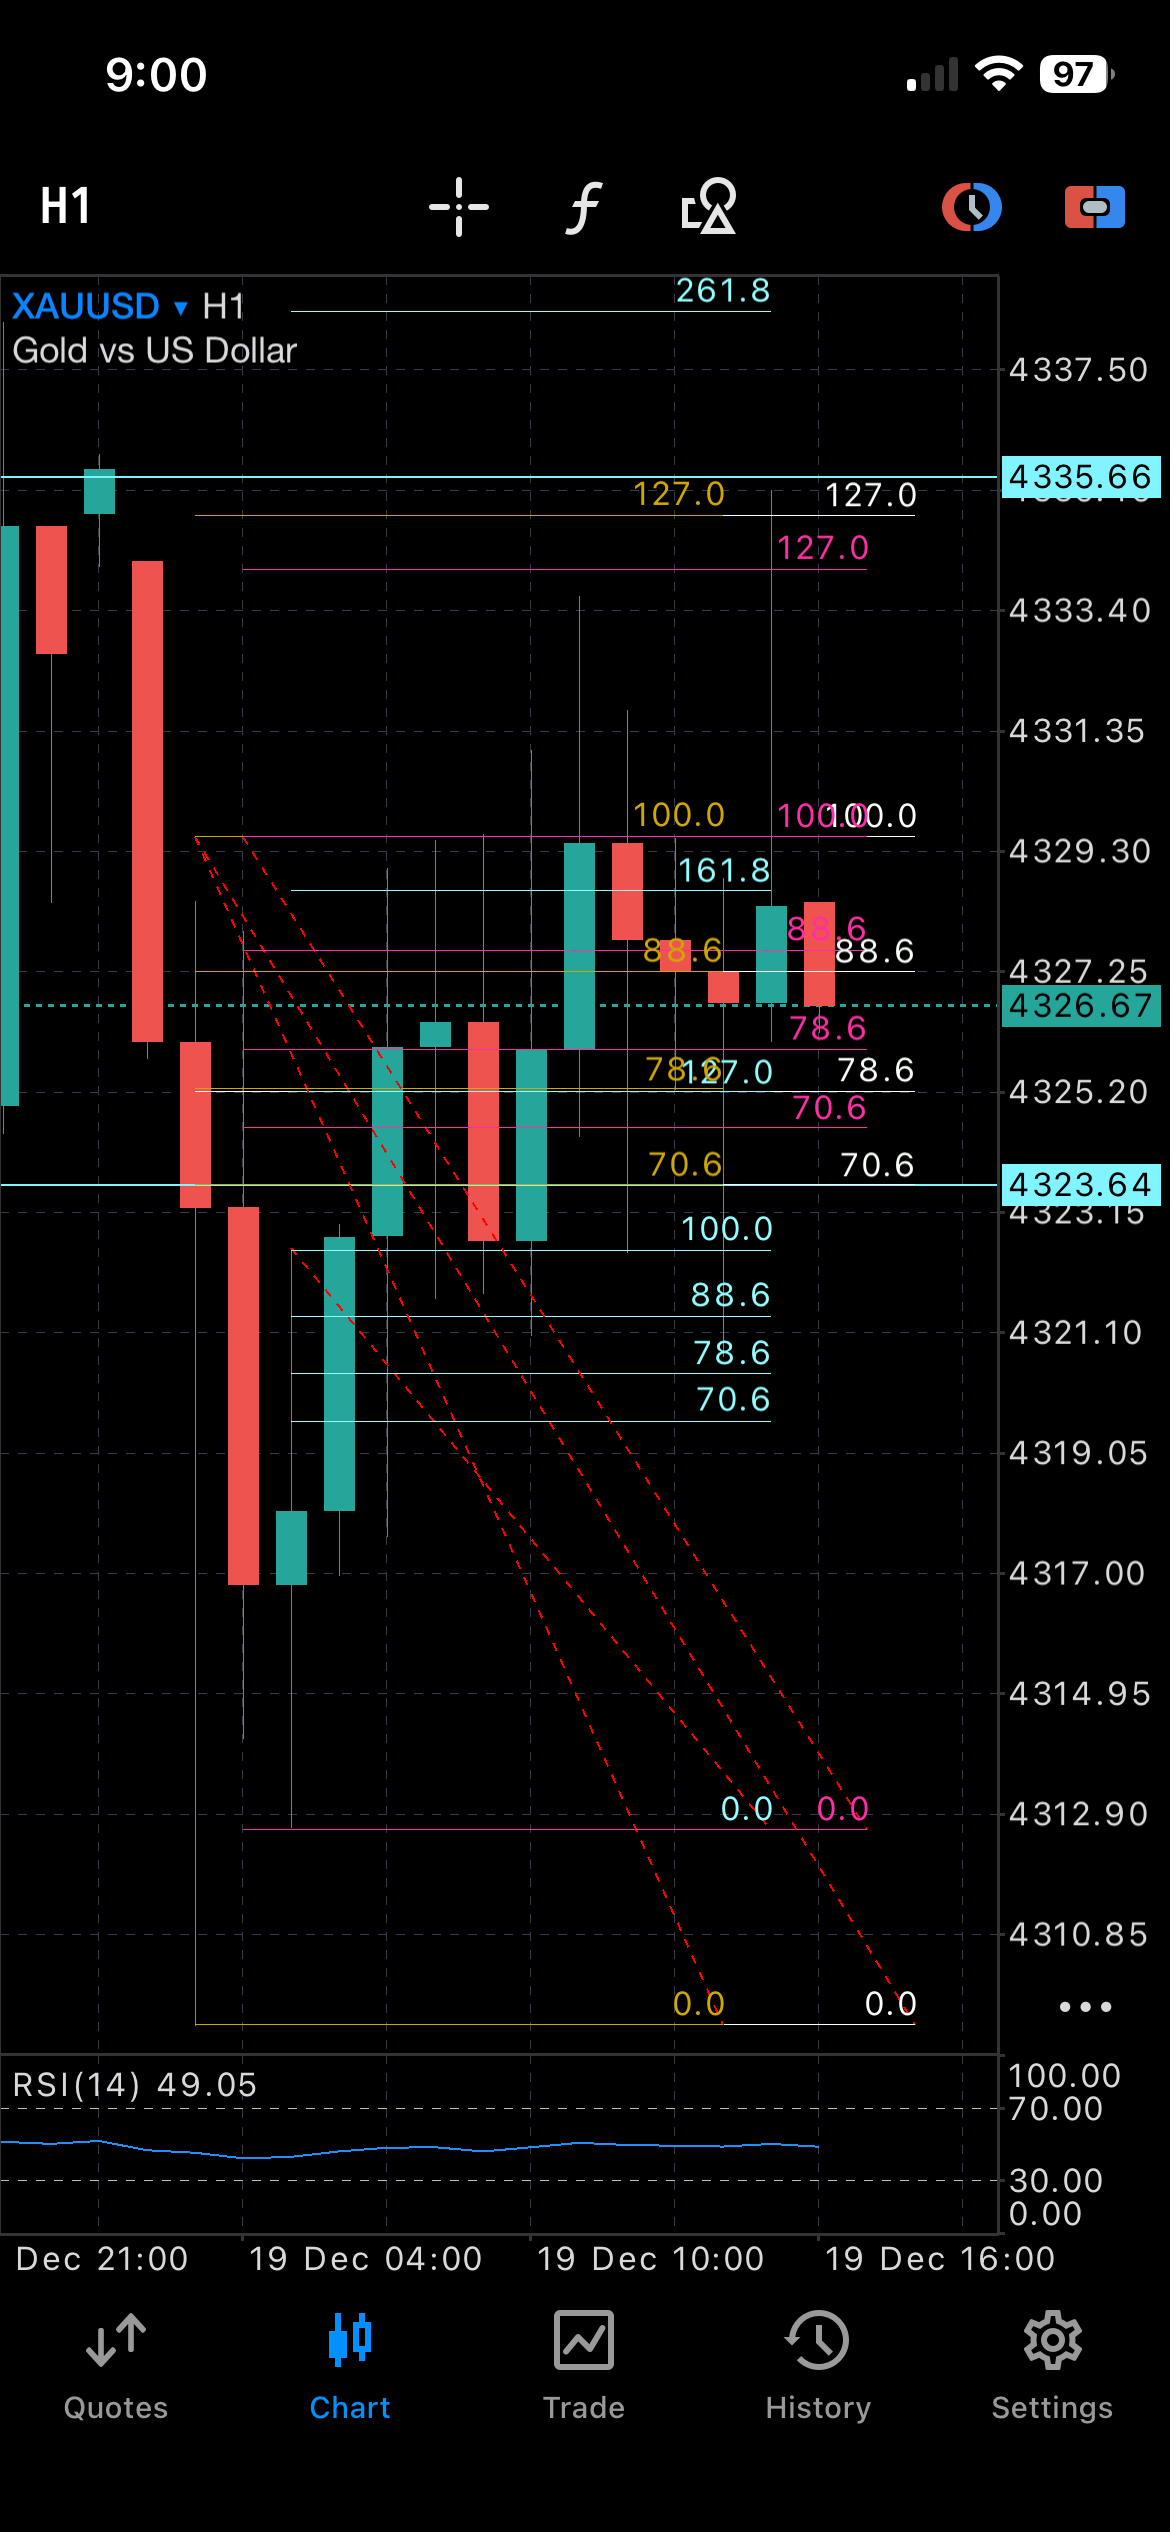
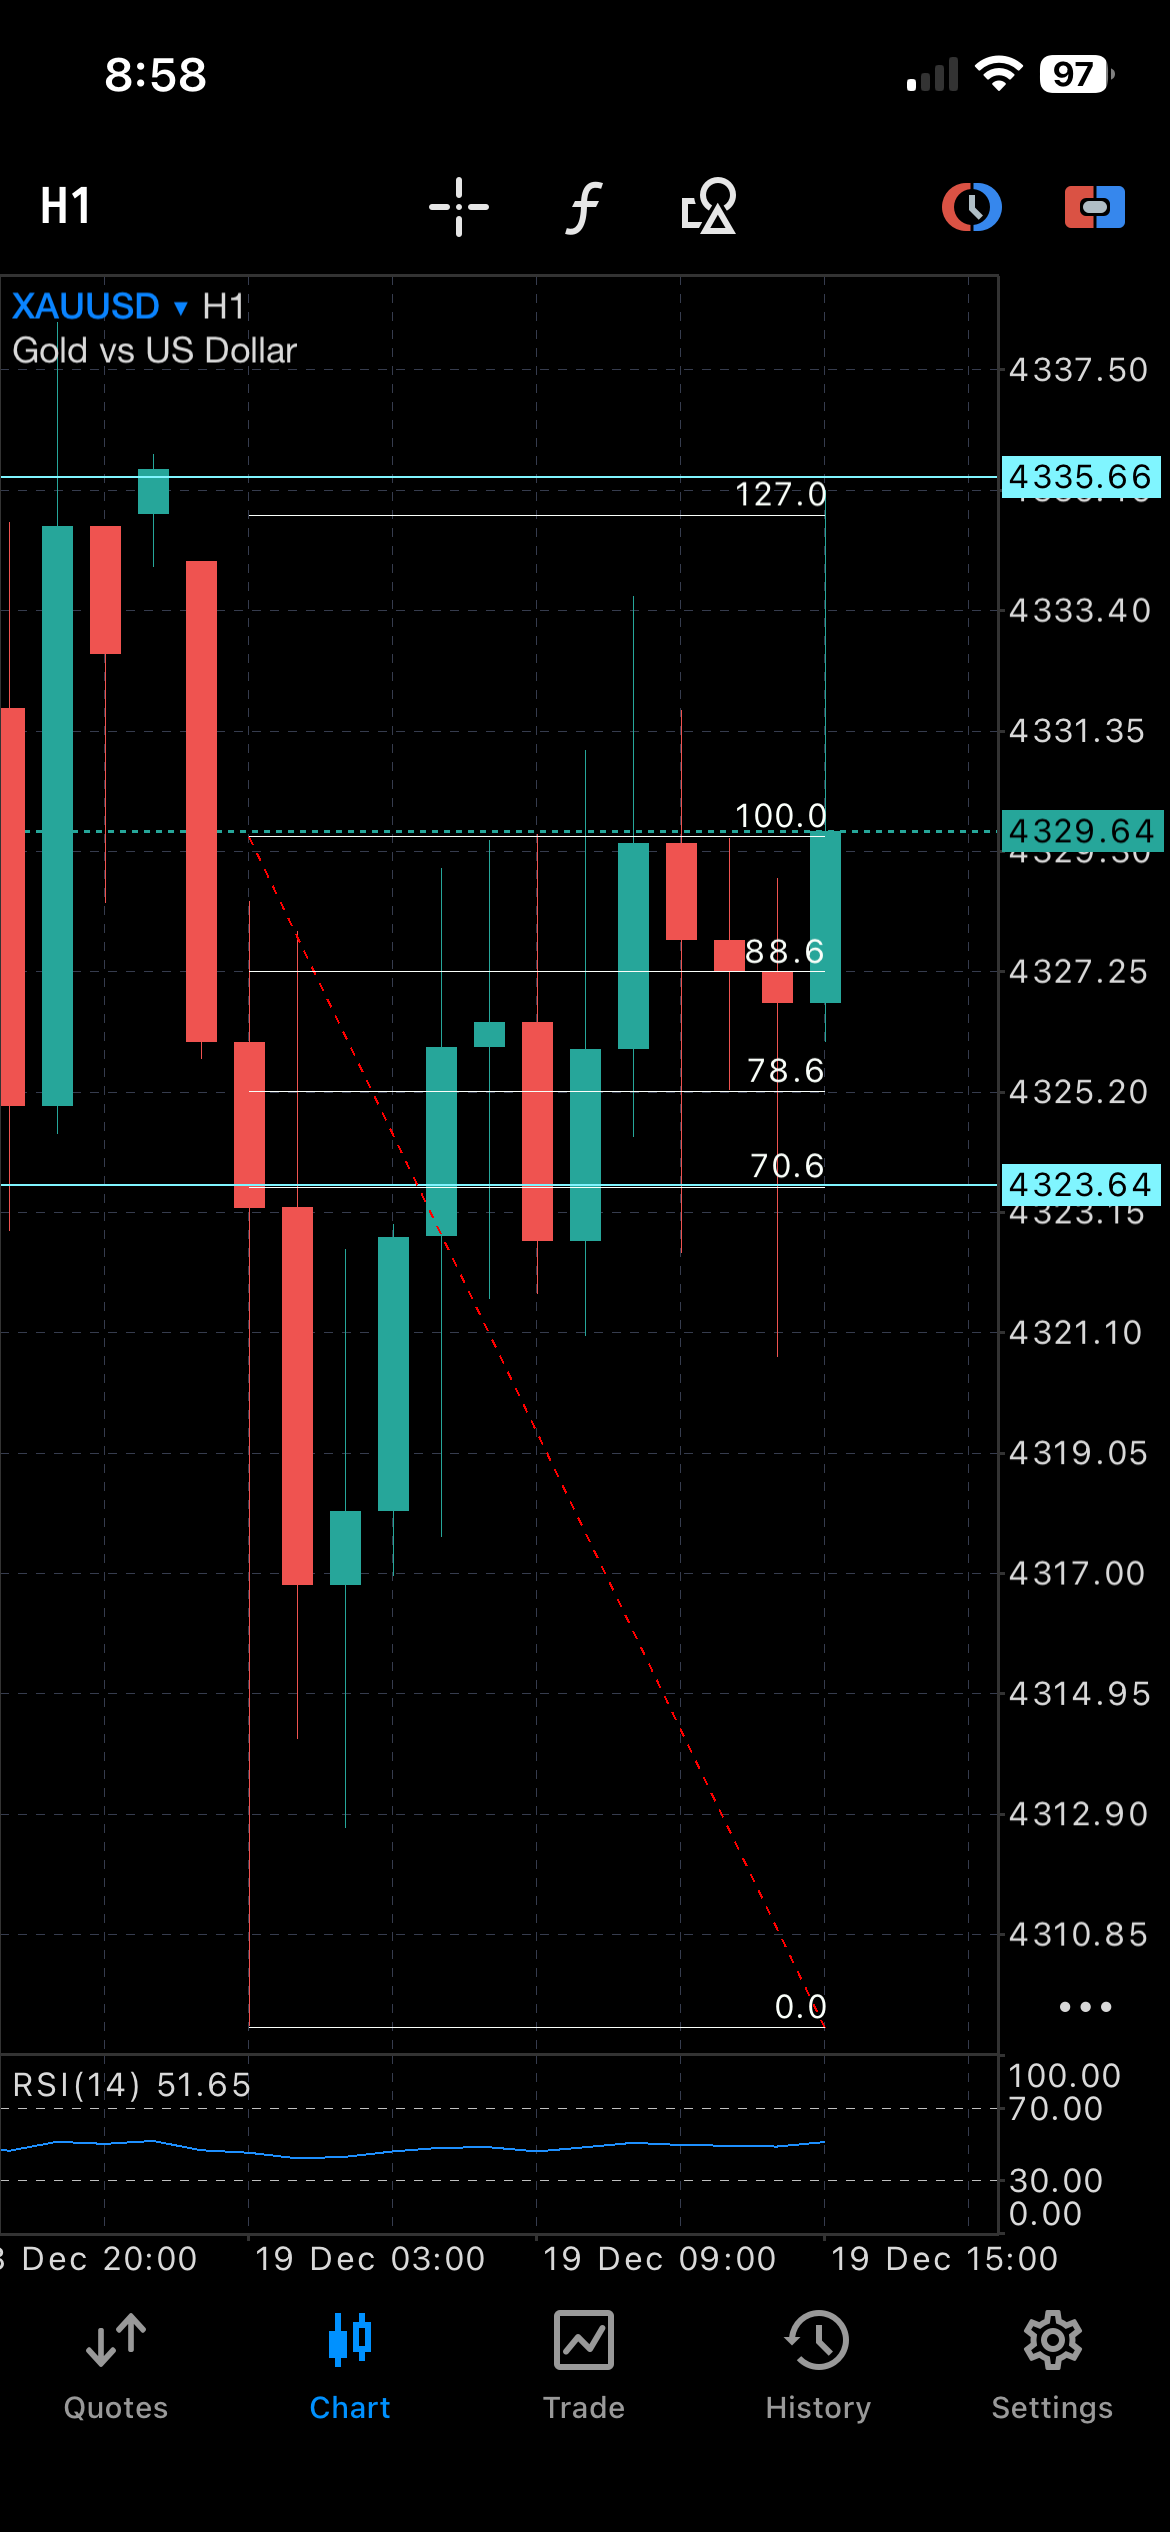
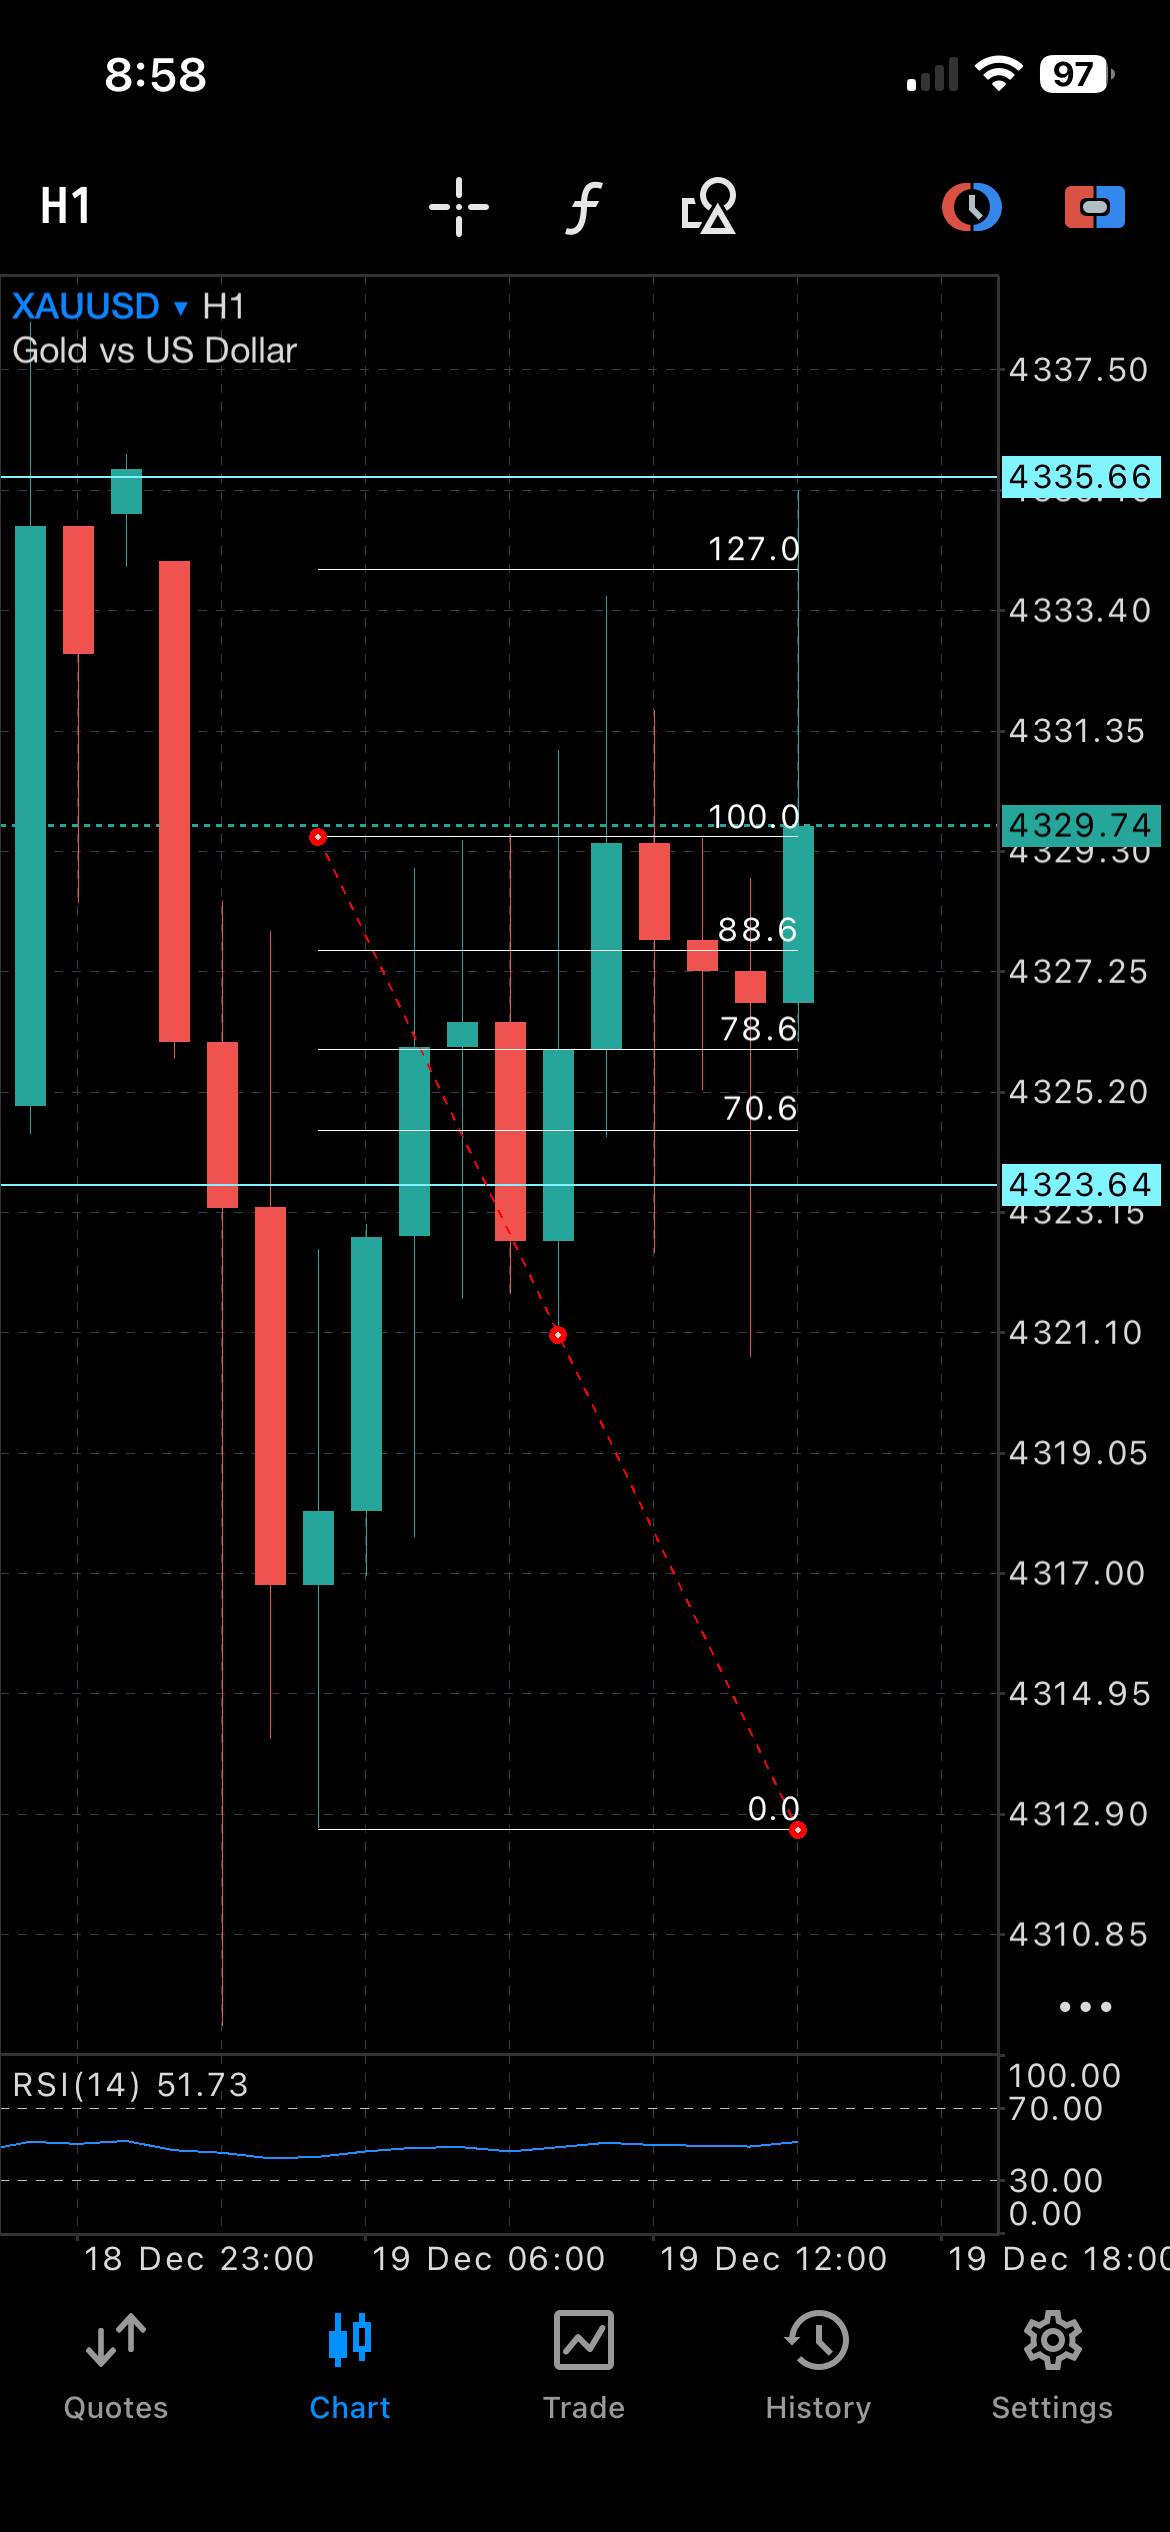
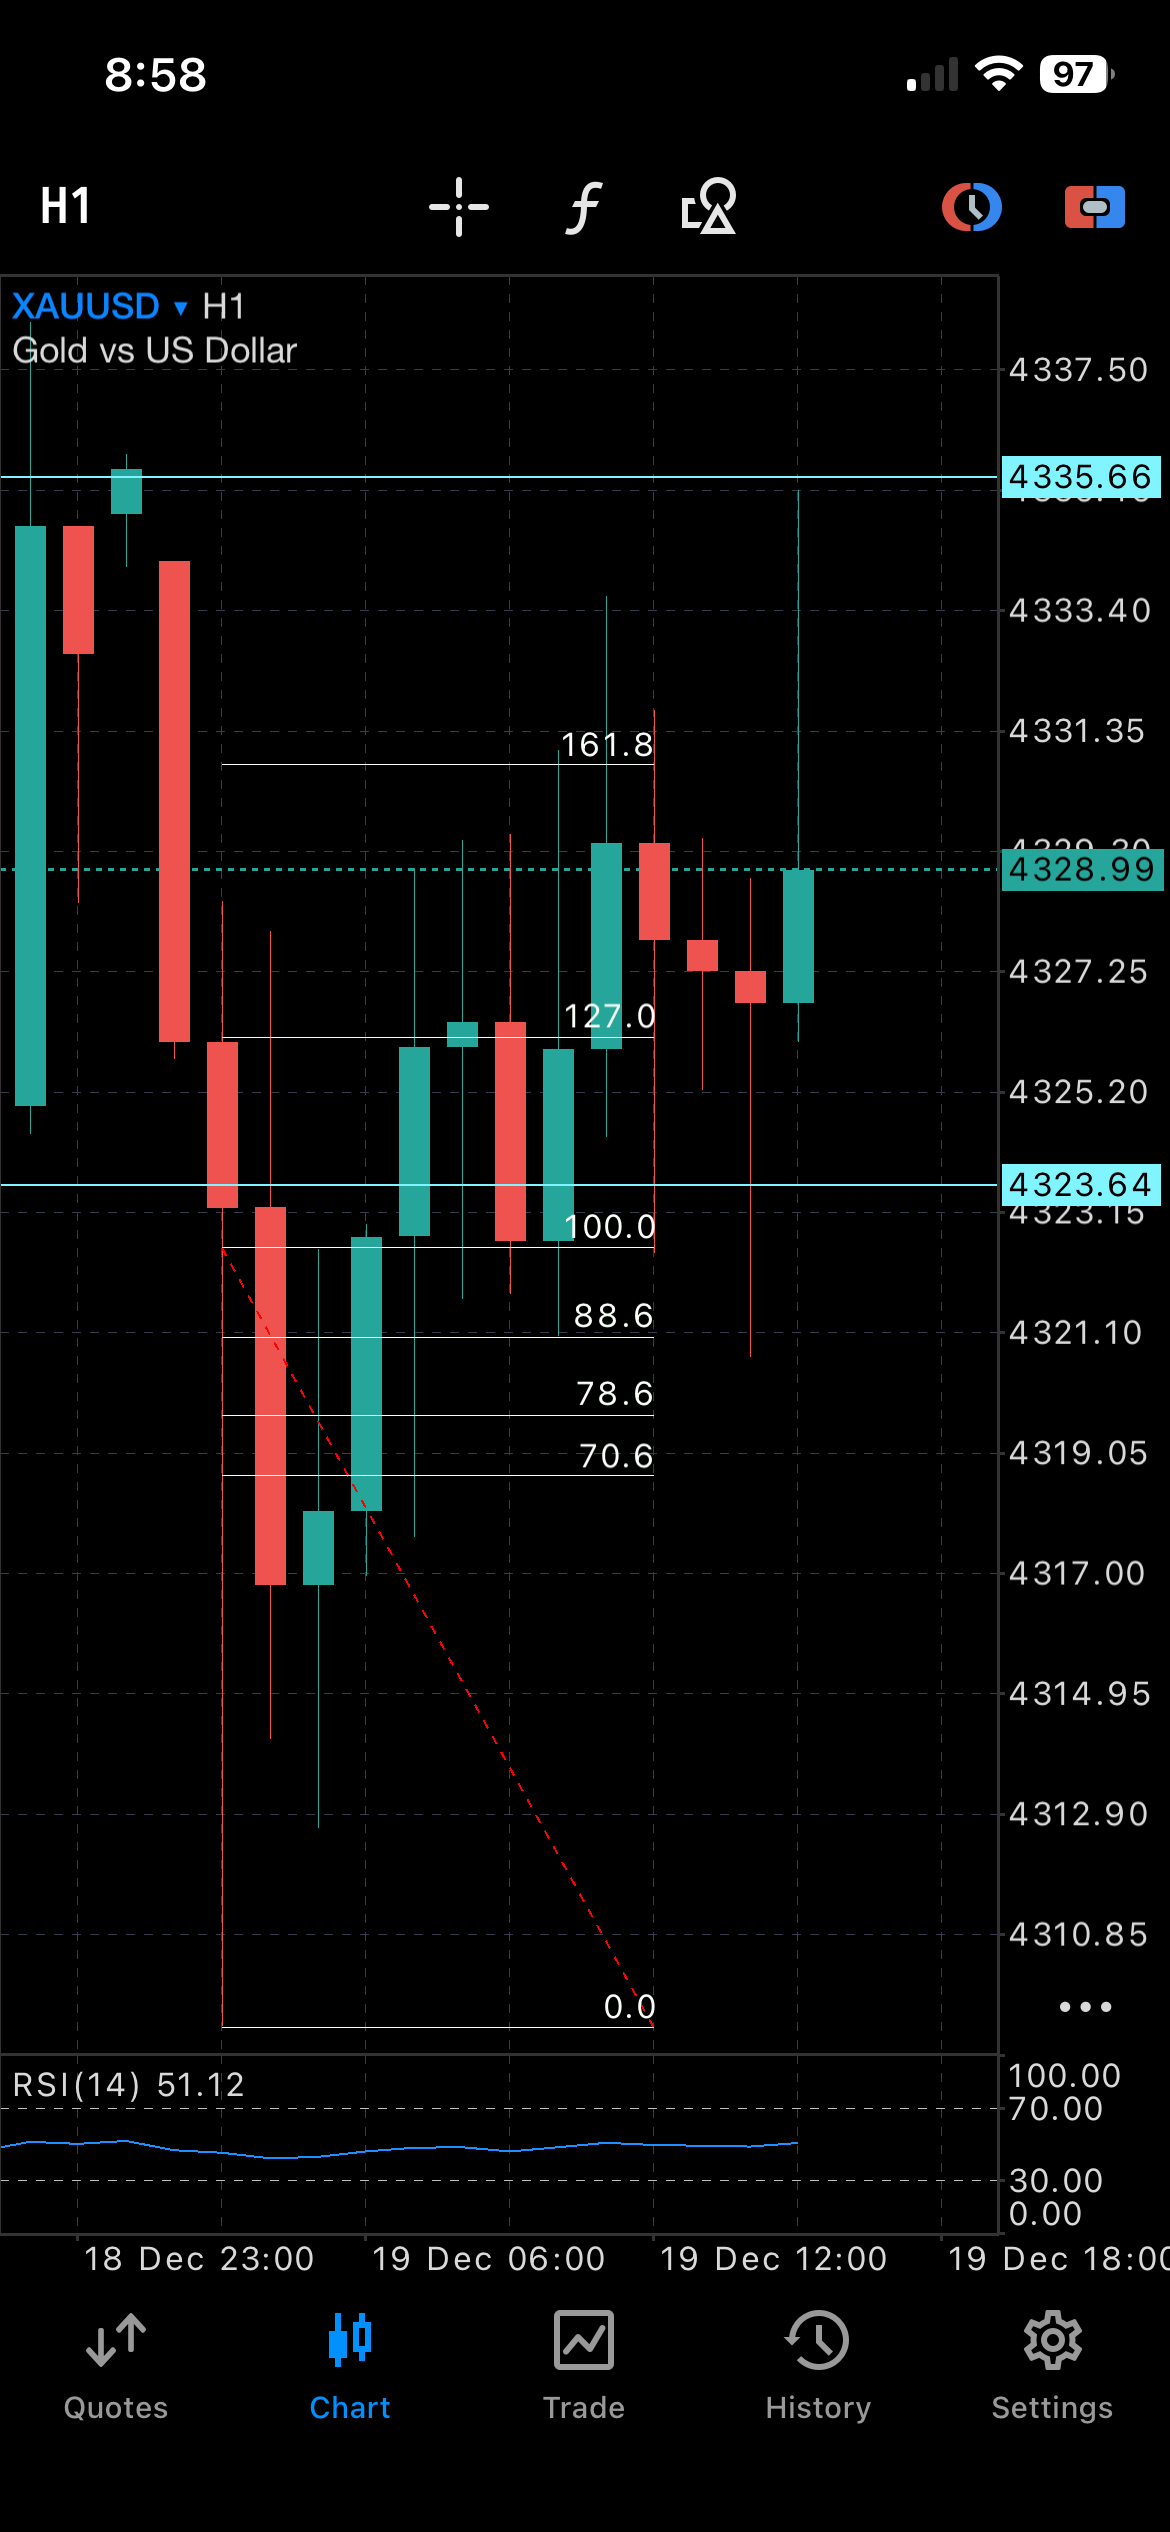
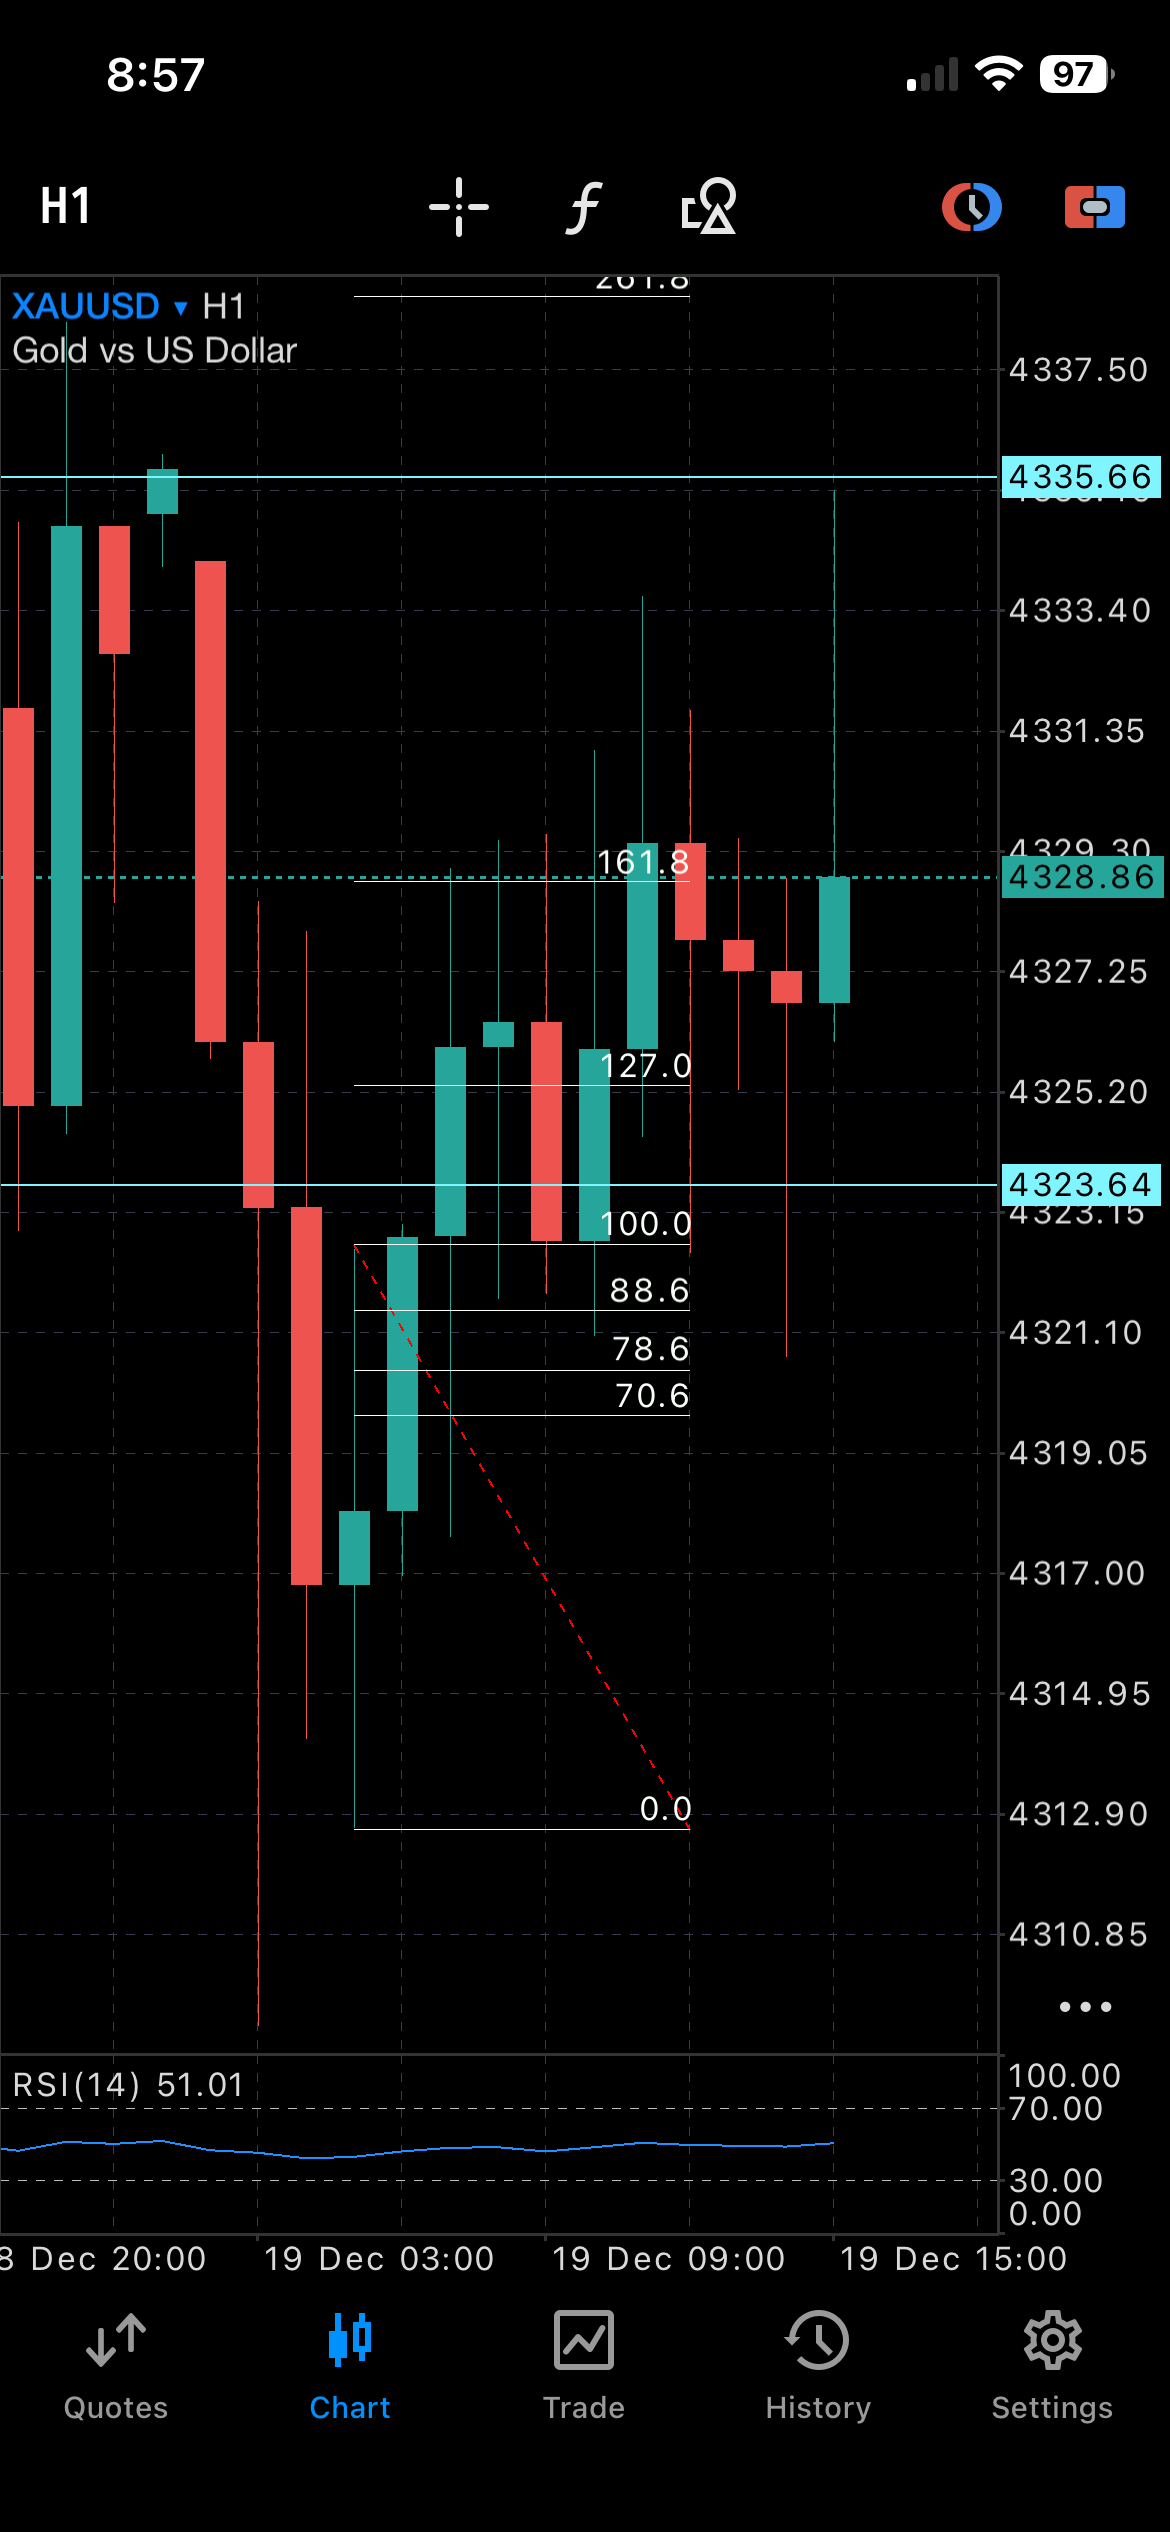
-In the end, there are 8 charting instances in total, which is just the 4 scenarios described above in both Bearish and Bullish Charting Setups. The examples show extra levels, but the only levels that need to be assigned to each chart are 88.6%, 100.0%, 127.0%, 161.8%, and 400.0%. I am fine to color coding being whatever is convenient.
I am attaching images that show examples of how each of the chart types would look when drawn, but the desired end goal is fairly simple to understand. I am unsure of how complicated this will be to code, but once this is completed and functional, I have at least one or 2 more jobs that will build on this tool to equal a completely functional trading algorithm for MT5.
The other two task that will need to be done after this job will be a candlestick sequence identifier which needs to determine when candlesticks from a selected time frame close specifically after touching levels from Valid Fib Retracements. After that, it will just need a signal sending function to react to a completed candlestick sequence, as well as the various functions that can enable the final EA to determine order sizes, exits, place orders, and so on…
Thank you again to any who are interested, and I look forward to getting this job completed.
Похожие заказы
I'm looking for an experienced NinjaTrader 8 (C#) developer to build a fully automated futures trading strategy. Please apply only if you have proven experience developing and testing NinjaTrader strategies. Project Overview Develop a fully automated NinjaTrader 8 strategy. Designed for Apex funded and evaluation accounts. Primary instruments: NQ/MNQ Futures (with flexibility to support other futures later). Trading
Code An Loss Rate 90-100% MT5 EA , that can blow a 100 USD account a day ,with fixed TP of 3000 points and SL of 3000 For better Rate Calculations get an strategy that can lead to so
I need a professional MT5 Expert Advisor (MQL5) for XAU/USD (Gold) only. Requirements: - Symbol: XAU/USD only - Timeframe: H1 trend, M5 entry - Smart Money Concept (SMC) - Liquidity Sweep - Break of Structure (BOS) - Order Block Retest - Confirmation Candle (Engulfing or Pin Bar) - ATR-based Stop Loss - Risk:Reward = 1:3 (adjustable) - Auto Lot (1% risk) - Break Even - Trailing Stop - Maximum 2 trades per day - One
Hello, I am looking for an existing, fully backtestable MT5 Expert Advisor or EA portfolio designed specifically for passing an FTMO-style prop-firm evaluation. I am not looking for unrealistic profit claims or a visually perfect backtest. My priority is a statistically defensible probability of passing the challenge while respecting all risk limits. Primary objective The system should be designed for the current
I have a High-Frequency Trading (HFT) Expert Advisor for both MT4 and MT5 designed primarily for US30 (Dow Jones Index) . The EA performs consistently and profitably on demo accounts, but when I run it on an IC Markets Raw or Standard live account, it starts generating losses under what appear to be the same trading conditions. At this time, I cannot provide the source code (.mq4/.mq5). I can only provide the
I need an Expert Advisor for MT5 on XAUUSD 1min timeframe using SMC concepts. STRATEGY RULES: SELL: 1. Identify previous day High/Low as liquidity 2. Entry only during London-NY session: 15:00-19:00 GMT+3 3. If price sweeps previous day High and closes back below it 4. Check for bearish 1min FVG below sweep candle 5. Wait for BOS - lower low 6. Entry: Sell at 50% of the FVG 7. SL: 10 pips above sweep wick 8. TP: 2R
Hello looking for someone to convert an indicator from tradingview to Thinkorswim I have attached the codes from trading view Also, I like make it trigger (alert) a one-time alert when the trend changes, and can also create a custom watchlist column that flags symbols currently in a new trend so you can scan multiple stocks easily. And like the watchlist to show only fresh trend changes or the current trend direction
I want to build a fundamental news trading bot that trade off economic news data, as we know every economic news data released always have effect on the asset associated with it, so this bot will take a trade instantly based on the news data released either to buy or sell, it will come with good money management and also SL and TP target based on price and pips value
Specification : 1. Goal I am commissioning a mean-reversion grid Expert Advisor for XAUUSD on MT5. The deliverable is the complete, commented .mq5 source (strictly personal usel). Offers limited to compiled .ex5 will not be considered. 2. Required framework (non-negotiable) 2.1. Works natively on M5; signals evaluated on closed bars; symmetric long/short. 2.2. Entry logic built on Bollinger Bands + Moving Average
1. Use two EMAs: 20 and 50. If EMA 20 is above EMA 50 → uptrend (look for buys) If EMA 20 is below EMA 50 → downtrend (look for sells) 2. Wait for a pullback into the area between the two EMAs. - For buys: price must touch or move between EMA 20 and EMA 50 during the last few candles. - For stils: same idea, but in a downtrend. 3. Entry signal: Buy: a bullish engulfing candle in an uptrend after the pullback