Смотри, как быстро заказать торгового робота
Ознакомьтесь с правилами перед работой
Как заказать торгового робота на MQL5 и MQL4
Посмотри пример Технического задания для заказа робота
Новое в категории:
30 - 200 USD
30 - 80 USD
30+ USD
30+ USD
250+ USD
30 - 50 USD
30+ USD
30+ USD
500 - 1500 USD
Работа завершена
Время выполнения 3 часа
Отзыв от заказчика
very fast and efficient coder, he understands well what you need
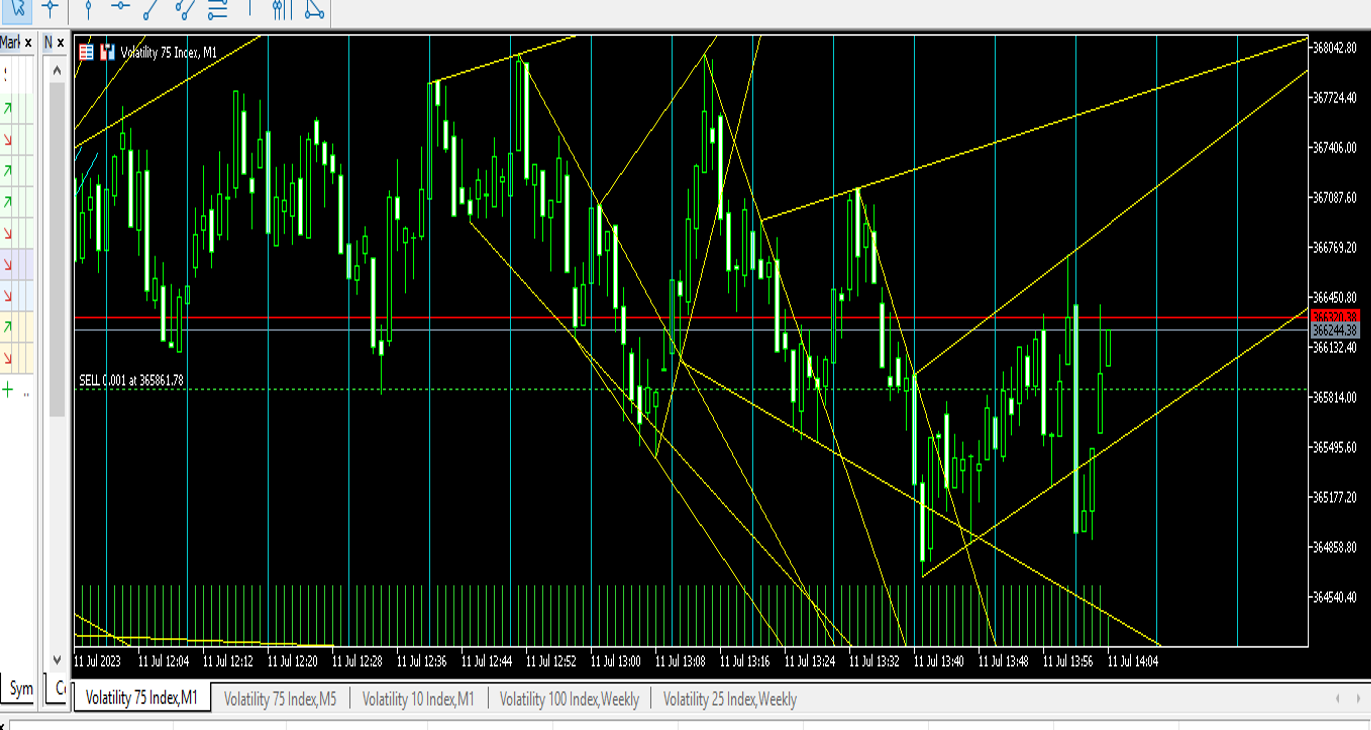
Техническое задание
i need a script or indicator that will draw a trendline connecting the high and low of every 10 minutes period or ten bars beginning from market open till the close i have also added a picture for reference note it is on the one minute chart
also i drew the blue line separator and noted the time in bold white font so that i will give you an idea of each ten minutes periodother high and low that connects to the other 10 minutes period
Откликнулись
1
Оценка
Проекты
414
55%
Арбитраж
12
50%
/
42%
Просрочено
1
0%
Свободен
2
Оценка
Проекты
80
6%
Арбитраж
46
11%
/
54%
Просрочено
7
9%
Работает
3
Оценка
Проекты
487
75%
Арбитраж
6
67%
/
17%
Просрочено
0
Свободен
4
Оценка
Проекты
651
33%
Арбитраж
41
41%
/
46%
Просрочено
11
2%
Занят
5
Оценка
Проекты
0
0%
Арбитраж
2
0%
/
100%
Просрочено
0
Свободен
Похожие заказы
I am looking for an experienced MT5 developer to build a custom, aggressive XAUUSD scalping EA with structured basket management and momentum continuation logic. This is not a generic EA — it requires careful architecture and proper risk control. Key Requirements: Instrument & Timeframes: XAUUSD only M1 execution chart M5/M15 for directional bias and structure context Execution & Basket Logic: Aggressive basket-style
1. Project Overview Asset: XAUUSD (Gold) Timeframe: M1 (1-Minute) for execution; M5/M15 for trend filtering. Objective: Execute high-frequency scalps during peak liquidity (London/NY overlap) to capture 10–30 pip movements with high precision. Core Logic: The "Poverty Bot" strategy relies on Mean Reversion combined with Momentum Burst (Price Action + RSI/EMA filters). 2. Strategy Logic (The "Poverty"
Simple MA indicator with buy and sell arrow with a push notification. Conditions for buy or sell should be when price breaks above or below the MA and then retraced back to the MA creating a HH/HL or LH/LL then the buy/sell signal arrow should be at the reversal candle that forms the HL/HH. And on indicator window1 RSI cross over MA and the RSI line
Hi, I hope you doing Greate, Let me share details , so the original EA already working but you can check and verify everything fine.First you verify that all original EA features are working correctly then add a user dashboard showing the number of detected zones, buy sell both none status, and an on off button. also ensure mitigated zones disappear properly and that trades follow the zone rules, and integrate the
I need to calculate the following from existing MT4 and MT5 account trading history: Maximum floating loss Maximum floating profit By “floating loss / floating profit,” I mean the largest unrealized loss and unrealized profit that occurred at any moment while positions were still open, not the final closed P/L. My requirements are: The calculation should be based on historical trading records It should ideally
A perfect indicator
30 - 80 USD
Merge nearby zones yes/no Alert on/off Label on/off Show only current relevant zones near price yes/no Distance filter from current price Zone transparency Colors Preferred Output on Chart: I want the indicator to show only: the strongest nearby support zones under price the strongest nearby resistance zones above price major higher timeframe zones clean chart view I do not want excessive clutter. Entry Assistance
Project Title: Custom XAUUSD Support & Resistance Indicator Platform Required: MT5 preferred. If possible, also provide TradingView Pine Script version later. Main Goal: I want a custom indicator made specifically for XAUUSD (Gold) only. The indicator should automatically detect and draw strong support and resistance zones where price has a high probability of reacting, rejecting, or reversing. It must update
2STEP MA WITH SUPERTREND
40+ USD
BUY ALERT 1. Supertrend turns Bullish 2. On this candle , or during the last time Supertrend was Bearish, price was < or = MA1 3. On this candle , or during the last time Supertrend was Bearish , BBStops is Bearish 4. STEP MA1 and STEP MA 2 are both Bullish SELL ALERT 1. Supertrend turns Bearish 2. On this candle , or during the last time Supertrend was Bullish, price was
Please only rrspond if you are serious and legit. If there are developers or traders that feel they have good skulls or software but no funds to take advantage of those skills or software let me know and maybe we could help each other out
Com este Expert Advisor, você pode comprar e vender com um stop loss automático aplicado no momento da compra ou venda. Você pode personalizar seu nível de risco aceitável. Seu gerenciamento de riscos se torna mais preciso e elimina perdas potenciais antes que o gráfico mude. Com o botão "reverter ordem", você pode fechar a ordem atual com lucro e imediatamente colocar a mesma ordem na direção oposta. Aproveite
Информация о проекте
Бюджет
30 - 40 USD