Create a Dashboard/Screener to monitor stocks on multi timeframes

Работа завершена

Время выполнения 4 дня
Отзыв от заказчика
Great Job! I hope we will work again.
Отзыв от исполнителя
Excellent client highly recommended A+++

Техническое задание

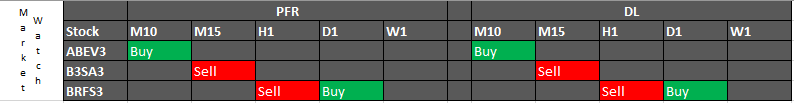
I need a dashboard to scan around 50 stocks at the Market Watch with the following conditions:

Name Condition #1 PFR
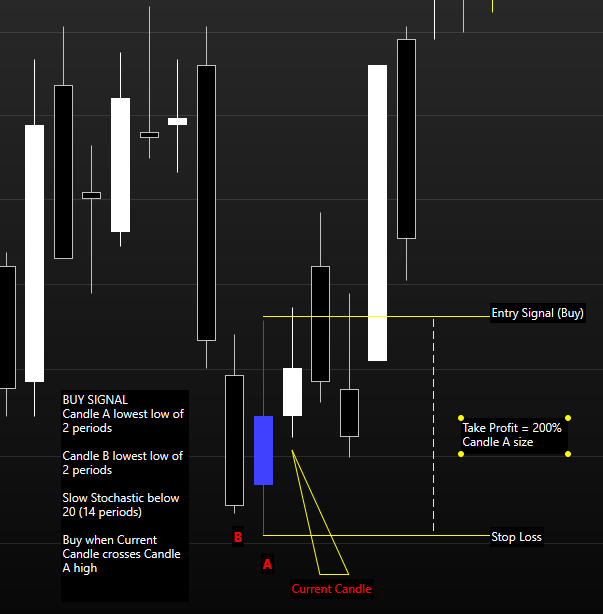
a) Buy signal

- Bar -1(A) lowest low of 2 periods; and

- Bar -2(B) lowest low of 2 periods; and

- Bar -1(A) close is higher than close Bar -2(B); and

- Slow Stochastic (8period) is lower than 20.
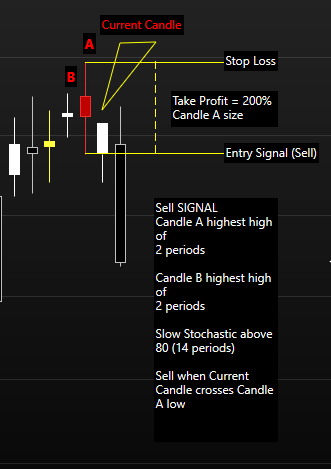

b) Sell signal

- Bar -1(A) highest high of 2 periods; and

- Bar -2(B) highest high of 2 periods; and

- Bar -1(A) close is lower than close Bar -2(B); and

- Slow Stochastic (8period) is higher than 80.


Scan this condition (on market watch or according choosen stocks) in the following timeframes: 10m, 15m, 30m, 60m, daily and weekly (this condition must have the option to on/off). The signal must show when the current bar has the previous condition.


Name Condition #2 DL
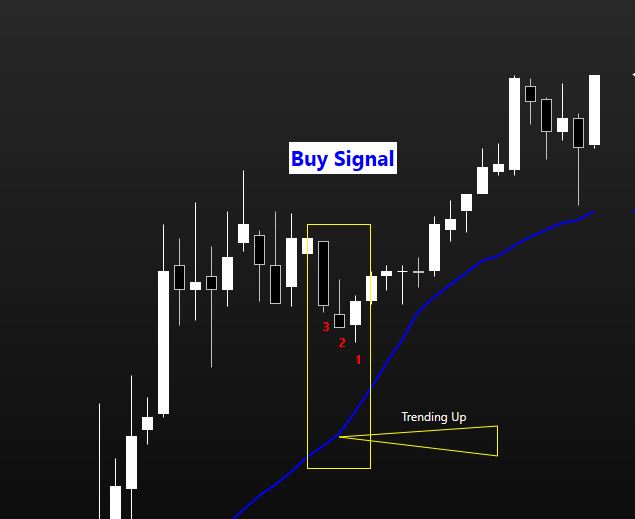
a)Buy signal

- Current Bar (1) low is lower than Bar -1(2) and Bar -2(3); and

- MA 21 is trending up; and

- MA 21 is lower than current bar.
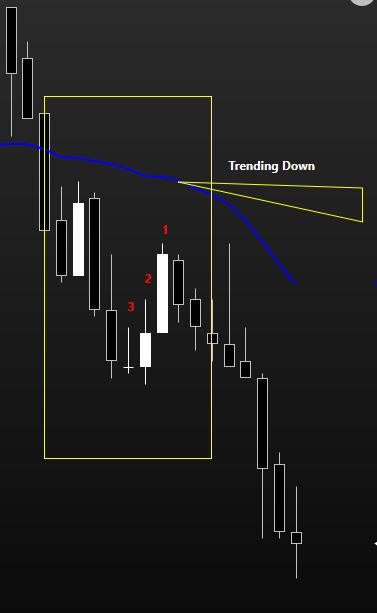

b) Sell signal

- Current Bar (1) high is higher than Bar -1(2) and Bar -2(3); and

- MA 21 is trending down; and

- MA 21 is higher than current bar.


Scan this condition (on market watch or according choosen stocks) in the following timeframes: 10m, 15m, 30m, 60m, daily and weekly. The signal must show when the current bar has the previous condition.


Name Condition #3 RSI

Show the RSI value (possibilty to choose the input like period and average) of a market watch or a list of choosen stocks.


The examples are attached.

Файлы:

PNG
PFR_buy.png
20.6 Kb
PNG
PFR_short.png
12.9 Kb
JPG
DL_Buy.JPG
29.1 Kb
JPG
DL_Short.JPG
24.1 Kb

Откликнулись

1
Разработчик 1
Оценка
(213)
Проекты
246
45%
Арбитраж
42
10% / 57%
Просрочено
5
2%
Свободен
2
Разработчик 2
Оценка
(167)
Проекты
197
48%
Арбитраж
3
33% / 33%
Просрочено
2
1%
Работает
3
Разработчик 3
Оценка
(294)
Проекты
470
39%
Арбитраж
102
40% / 24%
Просрочено
78
17%
Загружен
Опубликовал: 2 примера
4
Разработчик 4
Оценка
(277)
Проекты
334
55%
Арбитраж
14
36% / 29%
Просрочено
1
0%
Свободен
Похожие заказы
// Add this to your EA after ExportState() function void SendToBase44(const string state, const string dir, double entry, double sl, double tp) { string url = " https://preview-sandbox--ee0a32a725b788974de435e8cef40b7a.base44.app/api/functions/receiveEAState "; string headers = "Content-Type: application/json\r\n"; string json = "{" "\"symbol\":\""+_Symbol+"\","
1.Sinyal Perdagangan : Sinyal beli: garis MACD utama memotong garis sinyal ke atas (macd_current>signal_current && macd_previous<signal_previous). Sinyal jual: garis MACD utama memotong garis sinyal ke bawah (macd_current<signal_current && macd_previous>signal_previous). Gambar di bawah menunjukkan kasus beli dan jual. 2. Posisi ditutup pada sinyal yang berlawanan: Posisi beli ditutup pada sinyal jual, dan posisi
EA grid hunter 30 - 200 USD
1. Platform & Environment Platform: MetaTrader 5 (MT5 ONLY) Language: MQL5 Account type: ECN / Netting or Hedging Designed for broker rebate/commission return programs No DLLs, no external dependencies 2. Strategy Overview The EA is a high-frequency scalping Expert Advisor focused on maximizing the number of trades with minimal price movement, where the main source of profitability is broker rebate rather than market
Olá, preciso de um programador para montar um indicador com base na sobrevenda do estocastico, volume macd, para uma estrategia de reversão e falso rompimento com regioes de OB validos minimas e maximas de H1, H4, D1 e canais para confluencias, quero que seja didatico visualmente e com cores, sons de alertas e algum sinal de call ou put como setas indicando reversões e falsos rompimentos e continuidade

Информация о проекте

Бюджет
30 - 50 USD