The simple truth is that anyone who trades in a direction opposite to what the major players are trading will fail.
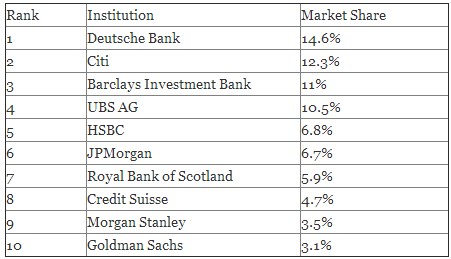
That makes banking institutions some of the biggest players in the forex market. The fact of the matter is that 70% of all daily forex day trading is done by banks.
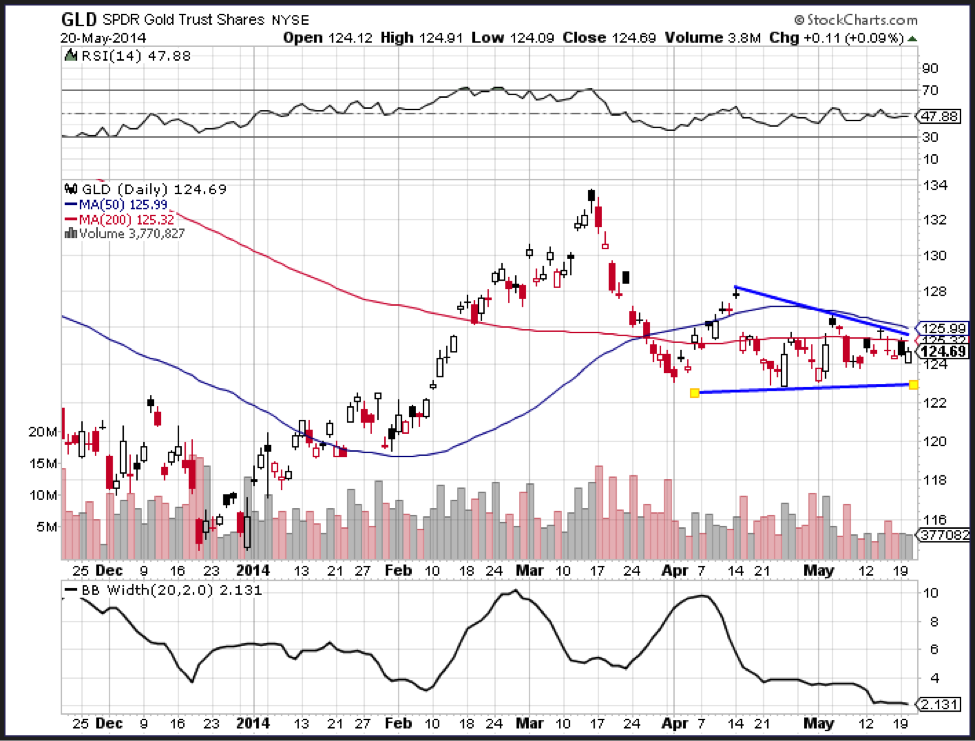
Gold prices have been stuck in neutral since early April as it consolidates near 1300. The GLD ETF fell below 124 in early April and bouncing off the 50-62% retracement few times. A lower high formed in early May and a descending triangle could be taking shape now. This is a bearish continuation pattern and a break below the April lows would signal a continuation of the March decline. The May highs mark a resistance zone in the 126-127 area.
A break above this zone is needed to negate the descending triangle and turn bullish on bullion. Gold needs to break 1320 to get some upside traction.
The 50-day moving average on the GLD is poised to close below the 200-day moving average, which is referred to as the death cross. When this occurs, a long term trend is considered in place and gold prices will likely continue to trend lower.
The Bollinger band width, which is calculated by subtracting the Bollinger band high (two standard deviations above the 20-day moving average) from the Bollinger band low (two standard deviations below the 20-day moving average). The end product is a representation of historical volatility as it shows that net standard deviation of the GLD time series. The low levels of historical volatility reflect the current consolidation in gold prices and reflects that prices could quickly jump with a new catalyst.
The Silver ETF (SLV) fell back to the December-January lows at the end of April and then moved into a tight consolidation. The Bollinger band width indicator has been below 5% for most of the last five weeks. Even though this volatility contraction is occurring near support, the trend since late February is clearly down. A move above this level would exceed the upper band and break the late April high. Such a breakout would suggest a successful support test and reverse the 12-week downtrend.