|
3 anos
experiência
|
6
produtos
|
854
versão demo
|
|
0
trabalhos
|
0
sinais
|
0
assinantes
|
If you require guidance and advice, please feel free to send me a private message, and I will respond as soon as possible.


Soraya Bahlekeh

· 2
Kevin Maher
2024.01.26
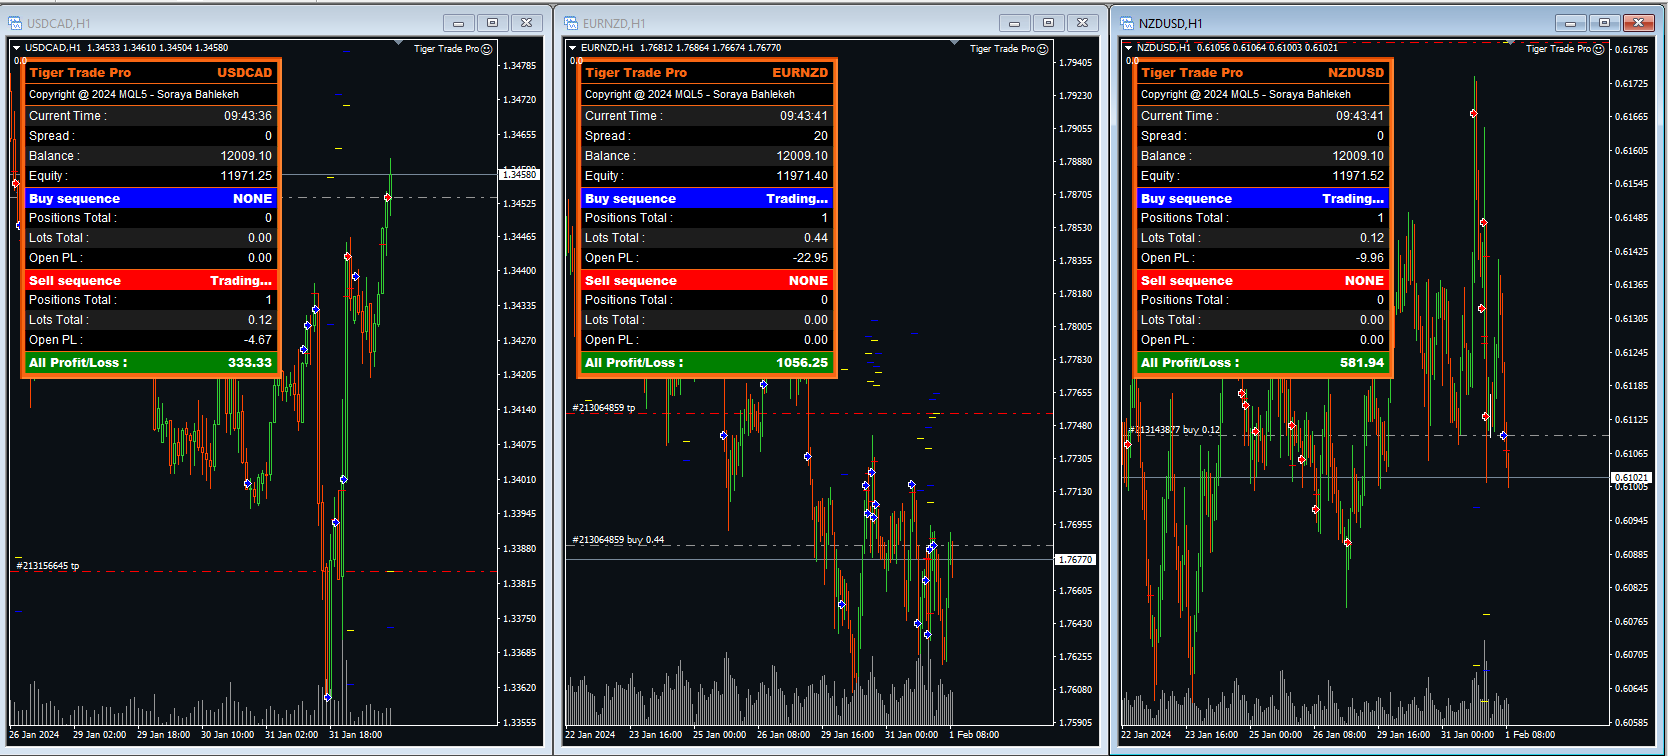
Nice EA with impressive results vs. price. However, I only use the MT5 platform. Please make a MT5 version!