mazen nafee / Perfil
- Informações
|
11+ anos
experiência
|
0
produtos
|
0
versão demo
|
|
0
trabalhos
|
0
sinais
|
0
assinantes
|
Amigos
976
Pedidos
Enviados
mazen nafee
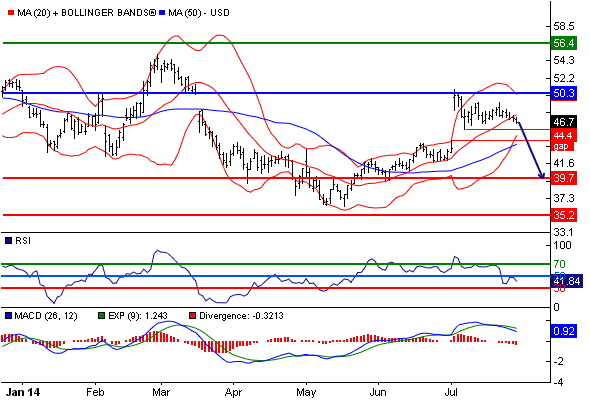
Shutterfly Inc ST: target 39.7
Our pivot point stands at 50.3.
Our preference: target 39.7.
Alternative scenario: above 50.3, look for 54.2 and 56.4.
Comment: the RSI is below 50. The MACD is positive and below its signal line. The MACD must penetrate its zero line to expect further downside. Moreover, the stock is trading under its 20 day MA (47.6) but above its 50 day MA (43.97).
Supports and resistances:
56.4 **
54.2 *
50.3 **
48.7
46.71 last
42
39.7 **
37.5 *
35.2 **

mazen nafee
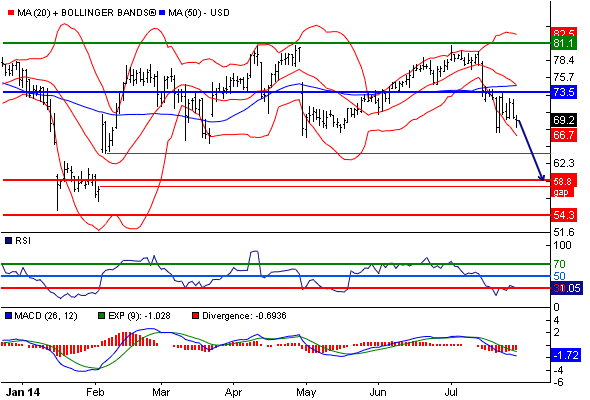
USANA Health Sciences Inc ST: the downside prevails as long as 73.5 is resistance
Our pivot point stands at 73.5.
Our preference: the downside prevails as long as 73.5 is resistance.
Alternative scenario: the upside breakout of 73.5 would call for 78.3 and 81.1.
Comment: the RSI is below 50. The MACD is negative and below its signal line. The configuration is negative. Moreover, the share stands below its 20 and 50 day MA (respectively at 74.63 and 74.54).
Supports and resistances:
81.1 **
78.3 *
73.5 **
71.7
69.18 last
62.5
59.8 **
57 *
54.3 **

mazen nafee
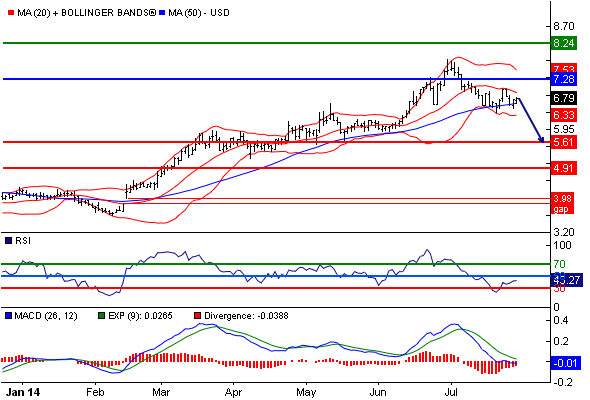
Petroquest Energy Inc ST: eye 5.61
7.28 is our pivot point.
Our preference: eye 5.61.
Alternative scenario: above 7.28, look for 7.88 and 8.24.
Comment: the RSI is below its neutrality area at 50. The MACD is below its signal line and negative. The configuration is negative. Moreover, the stock is below its 20 day MA (6.93) but above its 50 day MA (6.65).
Supports and resistances:
8.24 **
7.88 *
7.28 **
7.05
6.79 last
5.95
5.61 **
5.25 *
4.91 **

mazen nafee
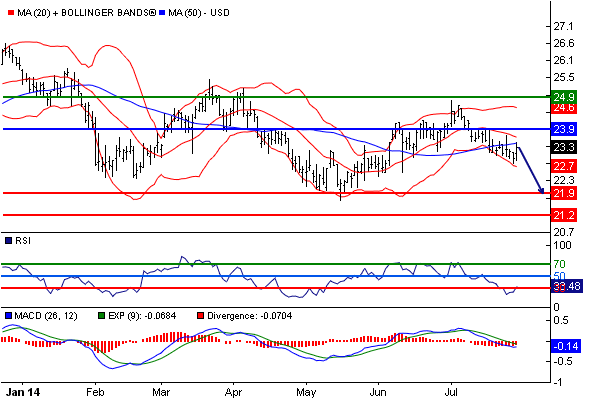
NBT Bancorp Inc ST: the downside prevails as long as 23.9 is resistance
23.9 is our pivot point.
Our preference: the downside prevails as long as 23.9 is resistance.
Alternative scenario: above 23.9, look for 24.5 and 24.9.
Comment: the RSI is below 50. The MACD is negative and below its signal line. The configuration is negative. Moreover, the share stands below its 20 and 50 day MA (respectively at 23.65 and 23.47).
Supports and resistances:
24.9 **
24.5 *
23.9 **
23.7
23.32 last
22.2
21.9 **
21.6 *
21.2 **

mazen nafee
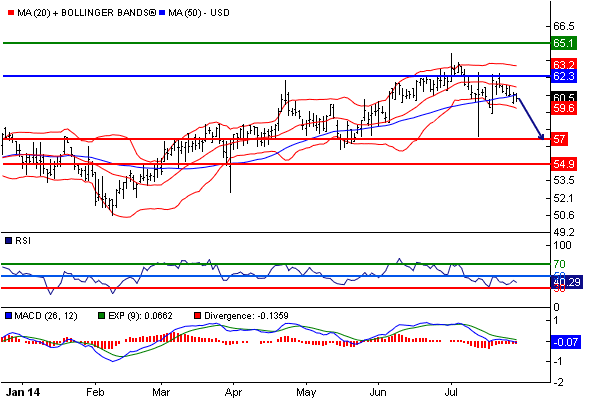
Bancfirst Corp ST: the downside prevails as long as 62.3 is resistance
Our pivot point is at 62.3.
Our preference: the downside prevails as long as 62.3 is resistance.
Alternative scenario: above 62.3, look for 64.1 and 65.1.
Comment: the RSI is below 50. The MACD is below its signal line and negative. The configuration is negative. Moreover, the stock is trading under both its 20 and 50 day MA (respectively at 61.44 and 60.79). Bancfirst Corp is currently trading near its 52 week high reached at 64.31 on 01/07/14.
Supports and resistances:
65.1 **
64.1 *
62.3 **
61.6
60.49 last
58.1
57 **
56 *
54.9 *

mazen nafee
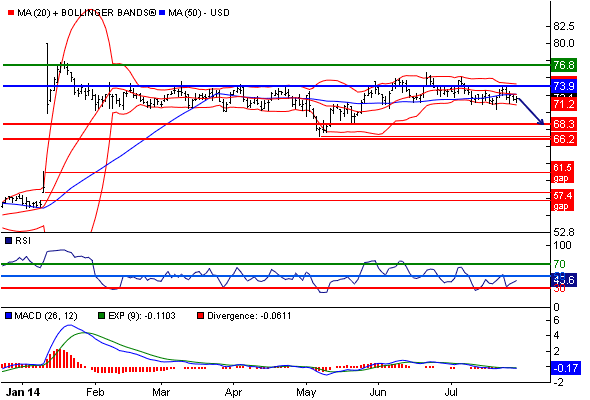
EnPro Industries Inc ST: the downside prevails as long as 73.9 is resistance
73.9 is our pivot point.
Our preference: the downside prevails as long as 73.9 is resistance.
Alternative scenario: the upside breakout of 73.9 would call for 75.7 and 76.8.
Comment: the RSI is below its neutrality area at 50. The MACD is below its signal line and negative. The configuration is negative. Moreover, the share stands below its 20 and 50 day MA (respectively at 72.68 and 72.74).
Supports and resistances:
76.8 **
75.7 *
73.9 **
73.2
72.095 last
69.4
68.3 **
67.3 *
66.2 **

mazen nafee
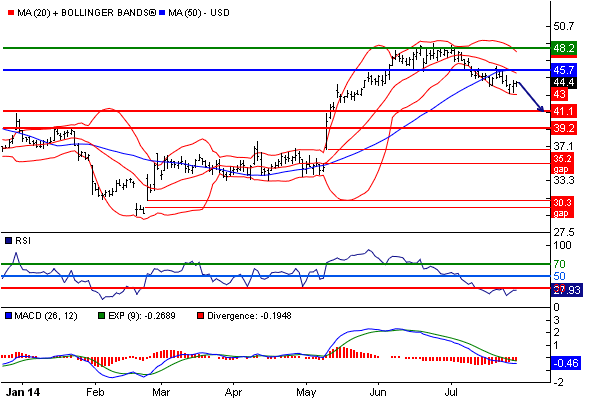
Polypore International Inc ST: the RSI is oversold
Our pivot point stands at 45.7.
Our preference: the downside prevails as long as 45.7 is resistance.
Alternative scenario: above 45.7, look for 47.3 and 48.2.
Comment: the RSI is below 30. It could either mean that the stock is in a lasting downtrend or just oversold and therefore bound to retrace (look for bullish divergence in this case). The MACD is below its signal line and negative. The configuration is negative. Moreover, the stock is trading under both its 20 and 50 day MA (respectively at 45.4 and 45.78).
Supports and resistances:
48.2 **
47.3 *
45.7 **
45.1
44.38 last
42
41.1 **
40.1 *
39.2 **

mazen nafee
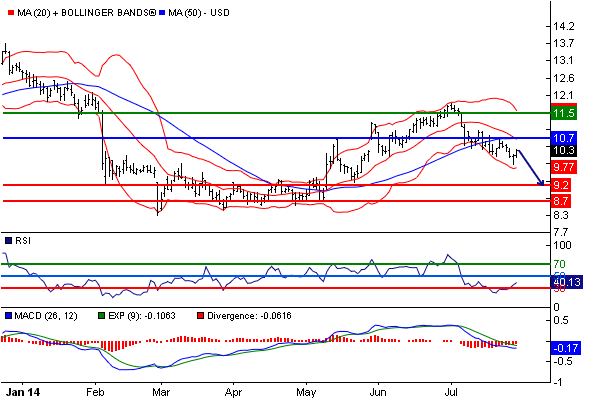
Clean Energy Fuels Corp ST: the downside prevails as long as 10.7 is resistance
10.7 is our pivot point.
Our preference: the downside prevails as long as 10.7 is resistance.
Alternative scenario: above 10.7, look for 11.2 and 11.5.
Comment: the RSI is below its neutrality area at 50. The MACD is negative and below its signal line. The configuration is negative. Moreover, the share stands below its 20 and 50 day MA (respectively at 10.67 and 10.71).
Supports and resistances:
11.5 **
11.2 *
10.7 **
10.5
10.315 last
9.5
9.2 **
8.9 *
8.7 **

mazen nafee
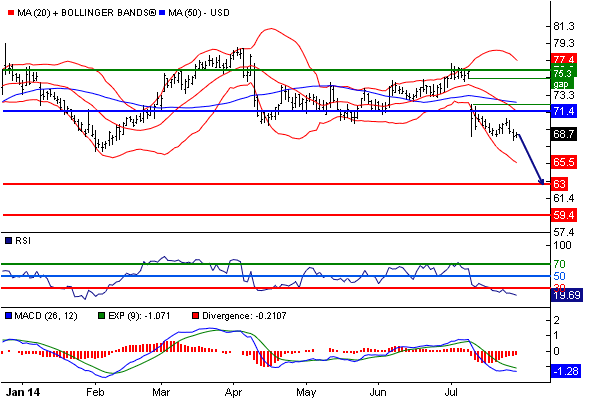
WD-40 Co ST: the RSI is oversold
Our pivot point is at 71.4.
Our preference: the downside prevails as long as 71.4 is resistance.
Alternative scenario: the upside breakout of 71.4 would call for 74.4 and 76.2.
Comment: the RSI is below 30. It could either mean that the stock is in a lasting downtrend or just oversold and therefore bound to retrace (look for bullish divergence in this case). The MACD is negative and below its signal line. The configuration is negative. Moreover, the share stands below its 20 and 50 day MA (respectively at 71.45 and 72.51).
Supports and resistances:
76.2 **
74.4 *
71.4 **
70.1
68.72 last
64.8
63 **
61.3 *
59.4 **

mazen nafee
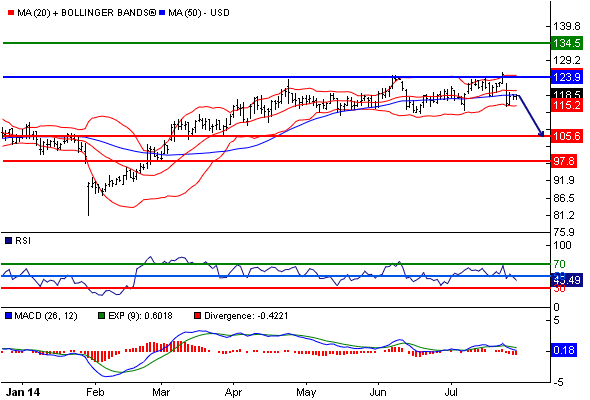
Allegiant Travel Co ST: under pressure below 123.9
123.9 is our pivot point.
Our preference: under pressure below 123.9.
Alternative scenario: above 123.9, look for 130.5 and 134.5.
Comment: the RSI is below 50. The MACD is positive and below its signal line. The MACD must penetrate its zero line to expect further downside. Moreover, the stock is trading under both its 20 and 50 day MA (respectively at 119.93 and 118.64). Allegiant Travel Co is currently trading near its 52 week high reached at 125.63 on 23/07/14.
Supports and resistances:
134.5 **
130.5 *
123.9 **
121.3
118.535 last
109.5
105.6 **
101.6 *
97.8 **

mazen nafee
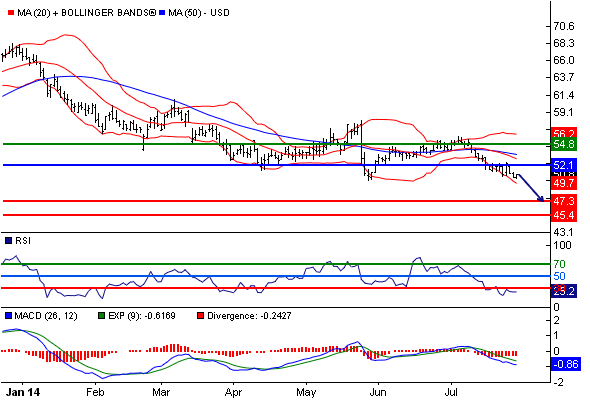
Hibbett Sports Inc ST: the RSI is oversold
Our pivot point stands at 52.1.
Our preference: the downside prevails as long as 52.1 is resistance.
Alternative scenario: above 52.1, look for 53.8 and 54.8.
Comment: the RSI is trading below 30. This could mean that either the stock is in a lasting downtrend or just oversold and that therefore a rebound could shape (look for bullish divergence in this case). The MACD is below its signal line and negative. The configuration is negative. Moreover, the share stands below its 20 and 50 day MA (respectively at 52.95 and 53.51). Hibbett Sports Inc is currently trading near its 52 week low at 50.04 reached on 28/05/14.
Supports and resistances:
54.8 **
53.8 *
52.1 **
51.5
50.8 last
48.3
47.3 **
46.4 *
45.4 **

mazen nafee
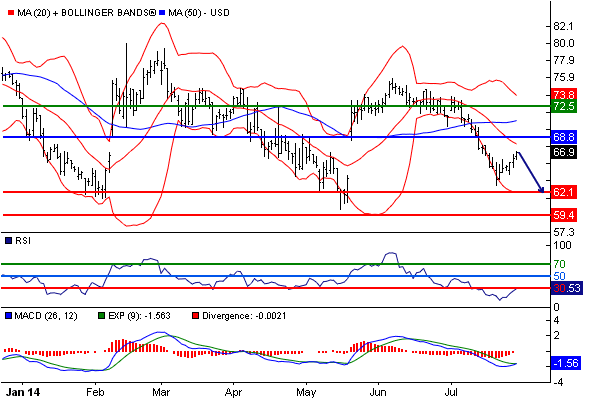
Red Robin Gourmet Burgers Inc ST: the downside prevails as long as 68.8 is resistance
Our pivot point stands at 68.8.
Our preference: the downside prevails as long as 68.8 is resistance.
Alternative scenario: the upside breakout of 68.8 would call for 71.1 and 72.5.
Comment: the RSI is below 50. The MACD is negative and below its signal line. The configuration is negative. Moreover, the share stands below its 20 and 50 day MA (respectively at 67.96 and 70.77).
Supports and resistances:
72.5 **
71.1 *
68.8 **
67.9
66.9 last
63.4
62.1 **
60.7 *
59.4 **

mazen nafee
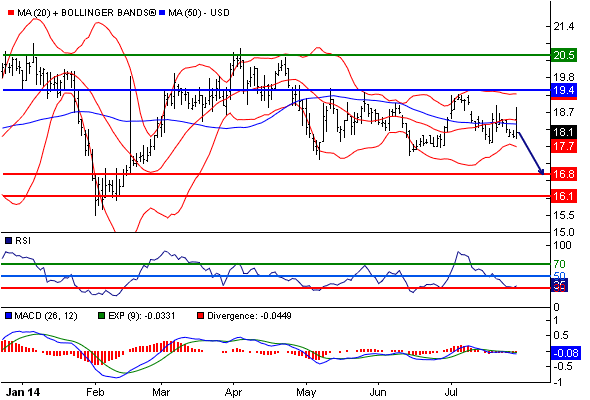
Heidrick & Struggles International Inc ST: the downside prevails as long as 19.4 is resistance
Our pivot point is at 19.4.
Our preference: the downside prevails as long as 19.4 is resistance.
Alternative scenario: above 19.4, look for 20.1 and 20.5.
Comment: the RSI is below its neutrality area at 50. The MACD is negative and below its signal line. The configuration is negative. Moreover, the stock is trading under both its 20 and 50 day MA (respectively at 18.48 and 18.36).
Supports and resistances:
20.5 **
20.1 *
19.4 **
19.2
18.09 last
17.2
16.8 **
16.4 *
16.1 **

mazen nafee
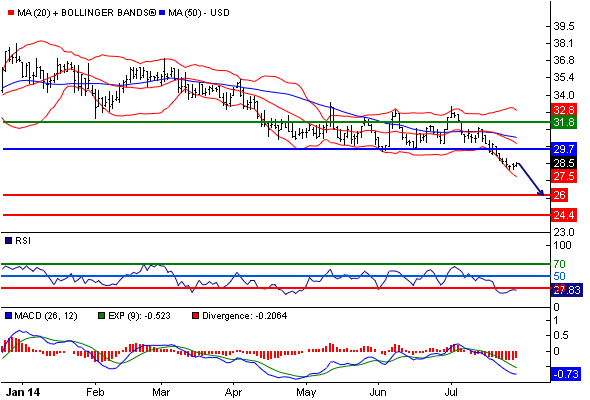
Tejon Ranch Co ST: the RSI is oversold
Our pivot point is at 29.7.
Our preference: the downside prevails as long as 29.7 is resistance.
Alternative scenario: the upside breakout of 29.7 would call for 31 and 31.8.
Comment: the RSI is trading below 30. This could mean that either the stock is in a lasting downtrend or just oversold and that therefore a rebound could shape (look for bullish divergence in this case). The MACD is negative and below its signal line. The configuration is negative. Moreover, the stock is trading under both its 20 and 50 day MA (respectively at 30.14 and 30.64). Tejon Ranch Co is currently trading near its 52 week low at 28.08 reached on 28/07/14.
Supports and resistances:
31.8 **
31 *
29.7 **
29.2
28.516 last
26.8
26 **
25.2 *
24.4 **

mazen nafee
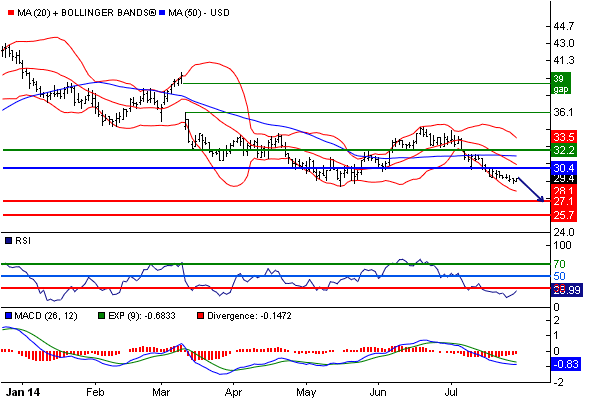
Raven Industries ST: the RSI is oversold
Our pivot point stands at 30.4.
Our preference: the downside prevails as long as 30.4 is resistance.
Alternative scenario: above 30.4, look for 31.5 and 32.2.
Comment: the RSI is below 30. It could either mean that the stock is in a lasting downtrend or just oversold and therefore bound to retrace (look for bullish divergence in this case). The MACD is below its signal line and negative. The configuration is negative. Moreover, the stock is trading under both its 20 and 50 day MA (respectively at 30.81 and 31.68). Raven Industries is currently trading near its 52 week low at 28.38 reached on 19/08/13.
Supports and resistances:
32.2 **
31.5 *
30.4 **
29.9
29.4 last
27.7
27.1 **
26.4 *
25.7 **

mazen nafee
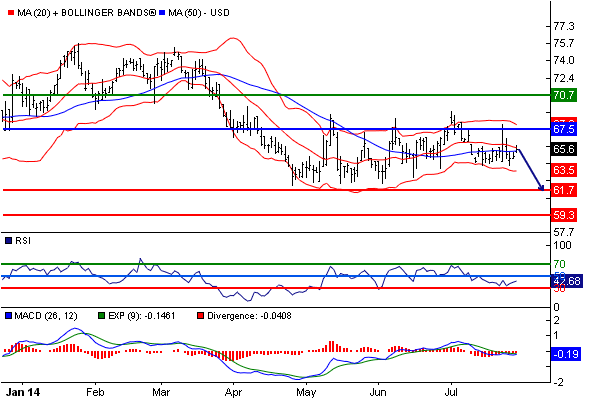
Infinity Property & Casualty Corp ST: eye 61.7
Our pivot point is at 67.5.
Our preference: eye 61.7.
Alternative scenario: the upside breakout of 67.5 would call for 69.5 and 70.7.
Comment: the RSI is below 50. The MACD is negative and below its signal line. The configuration is negative. Moreover, the stock is trading under its 20 day MA (65.73) but above its 50 day MA (65.44).
Supports and resistances:
70.7 **
69.5 *
67.5 **
66.7
65.59 last
62.9
61.7 **
60.5 *
59.3 **

mazen nafee
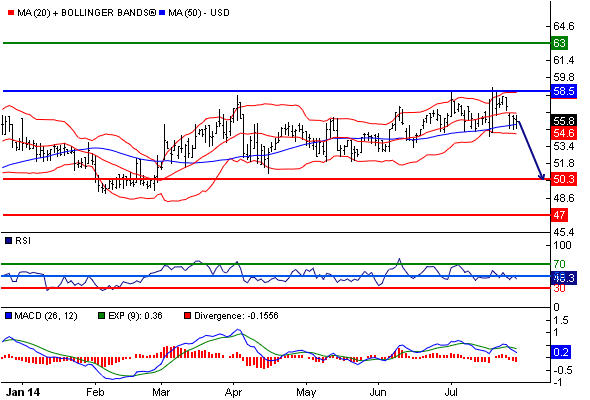
National Healthcare ST: target 50.3
Our pivot point stands at 58.5.
Our preference: target 50.3.
Alternative scenario: the upside breakout of 58.5 would call for 61.3 and 63.
Comment: the RSI is below its neutrality area at 50. The MACD is below its signal line and positive. The MACD must penetrate its zero line to expect further downside. Moreover, the stock is trading under its 20 day MA (56.52) but above its 50 day MA (55.48). National Healthcare is currently trading near its 52 week high reached at 58.92 on 18/07/14.
Supports and resistances:
63 **
61.3 *
58.5 **
57.4
55.75 last
51.9
50.3 **
48.6 *
47 **

mazen nafee
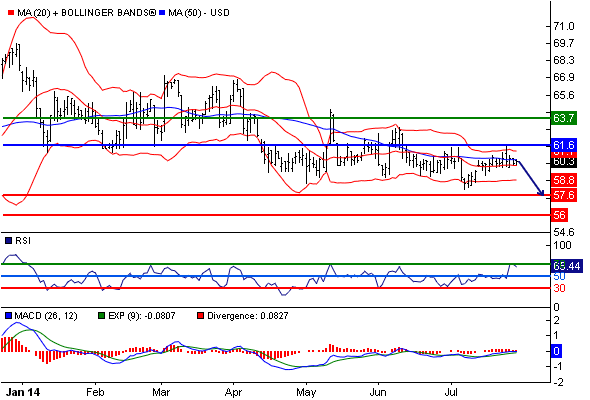
Deltic Timber Corp ST: short term technical rebound towards 61.6 before a new drop
Our pivot point stands at 61.6.
Our preference: short term technical rebound towards 61.6 before a new drop.
Alternative scenario: above 61.6, look for 62.9 and 63.7.
Comment: the RSI is above 50. The MACD is above its signal line and positive. The configuration is positive. Moreover, the stock is trading above its 20 day MA (59.97) but under its 50 day MA (60.43). Deltic Timber Corp is currently trading near its 52 week low at 58.05 reached on 08/07/14.
Supports and resistances:
63.7 **
62.9 *
61.6 **
61
60.3 last
58.4
57.6 **
56.8 *
56 **

mazen nafee
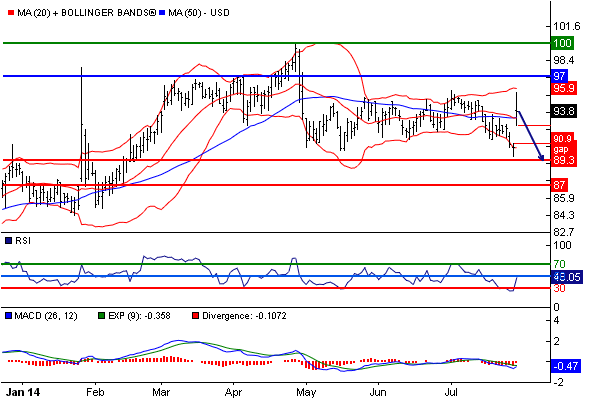
J&J Snack Foods Corp ST: gap
Our pivot point is at 97.
Our preference: eye 89.3.
Alternative scenario: above 97, look for 98.8 and 100.
Comment: the RSI is below 50. The MACD is negative and below its signal line. The configuration is negative. Moreover, the stock is trading above both its 20 and 50 day MA (respectively at 93.19 and 93.25).
Supports and resistances:
100 **
98.8 *
97 **
96.3
93.79 last
90.3
89.3 **
88.2 *
87 **

mazen nafee
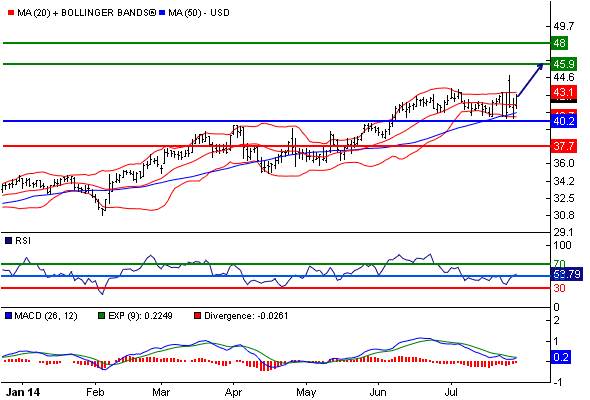
Monolithic Power Systems Inc ST: as long as 40.2 is support look for 45.9
40.2 is our pivot point.
Our preference: as long as 40.2 is support look for 45.9.
Alternative scenario: below 40.2, expect 38.6 and 37.7.
Comment: the RSI is above its neutrality area at 50. The MACD is positive and below its signal line. The stock could retrace in the short term. Moreover, the stock is above its 20 and 50 day MA (respectively at 41.9 and 41.09). Monolithic Power Systems Inc is currently trading near its 52 week high reached at 44.77 on 25/07/14.
Supports and resistances:
48 **
46.9 *
45.9 **
44.9
42.68 last
40.9
40.2 **
38.6 *
37.7 **

: