Oleg Rodin / Perfil
- Informações
|
12+ anos
experiência
|
51
produtos
|
546
versão demo
|
|
0
trabalhos
|
0
sinais
|
0
assinantes
|
Olá!
Sou trader e desenvolvedor de software comercial há 15 anos. Aqui eu faço o meu melhor para compartilhar minha experiência com outros comerciantes, fornecendo-lhes ferramentas de alta qualidade que podem ser usadas para negociar em diferentes mercados.
Meu objetivo é ajudar traders de todo o mundo a obter sucesso na negociação, independentemente do nível de experiência que eles tenham atualmente. É por isso que estou aqui.
Com meu suporte e ferramentas de alta qualidade, todo trader pode facilmente se tornar melhor na negociação.
Sou trader e desenvolvedor de software comercial há 15 anos. Aqui eu faço o meu melhor para compartilhar minha experiência com outros comerciantes, fornecendo-lhes ferramentas de alta qualidade que podem ser usadas para negociar em diferentes mercados.
Meu objetivo é ajudar traders de todo o mundo a obter sucesso na negociação, independentemente do nível de experiência que eles tenham atualmente. É por isso que estou aqui.
Com meu suporte e ferramentas de alta qualidade, todo trader pode facilmente se tornar melhor na negociação.
Oleg Rodin
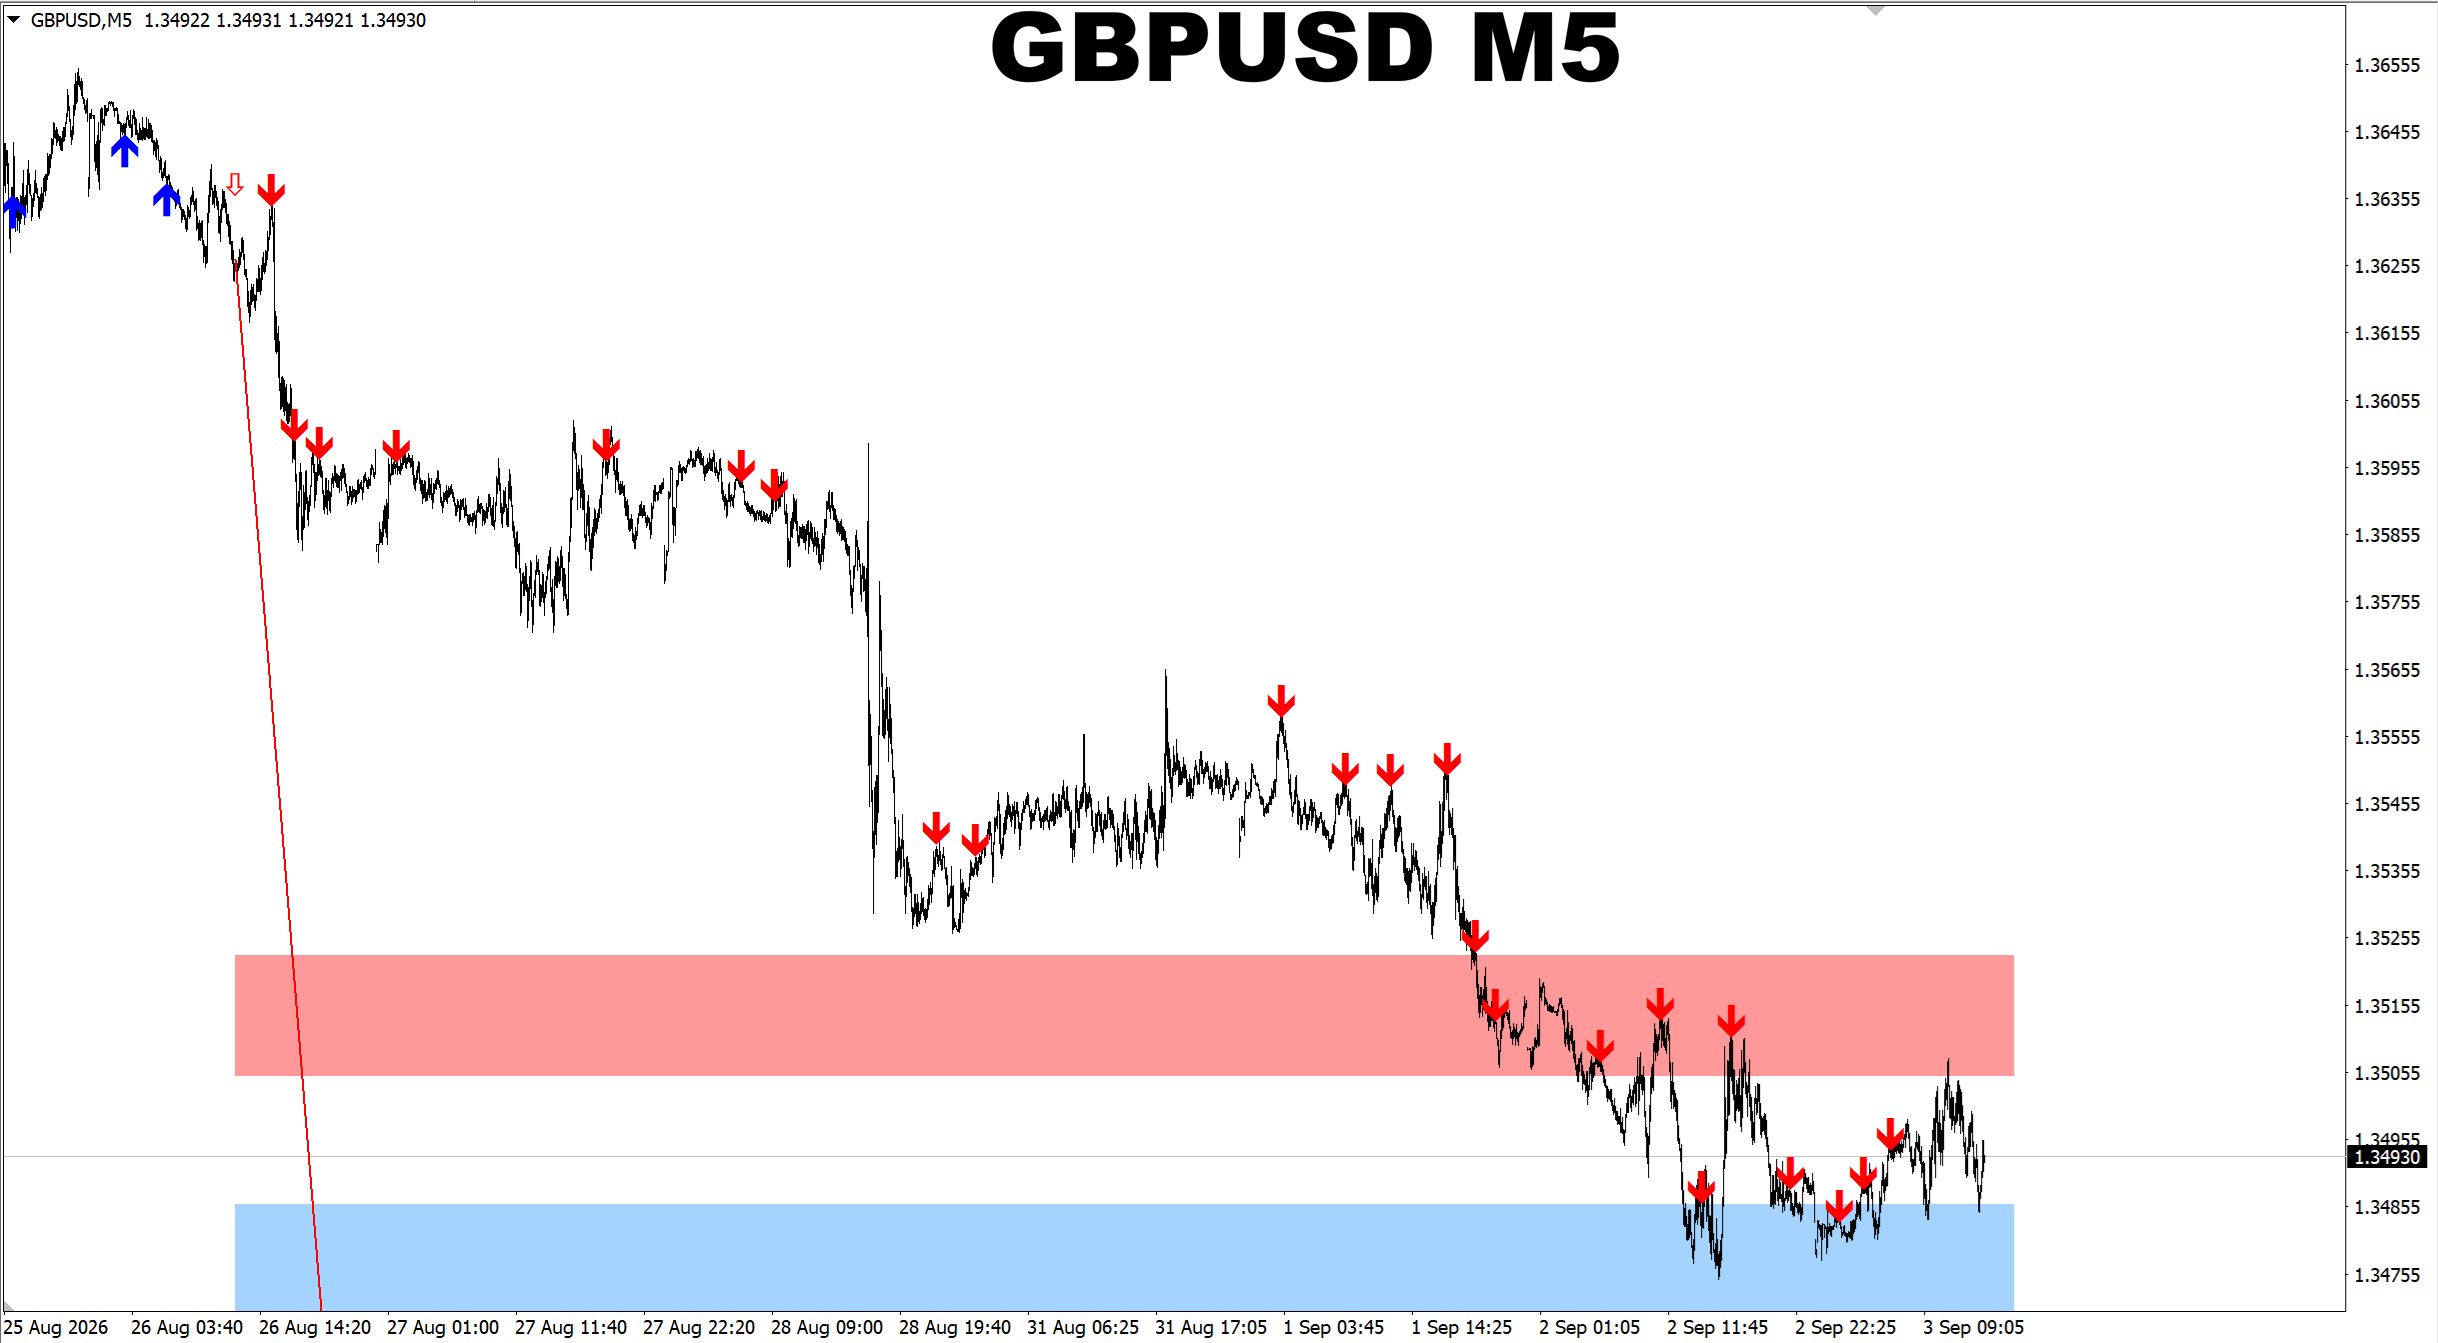
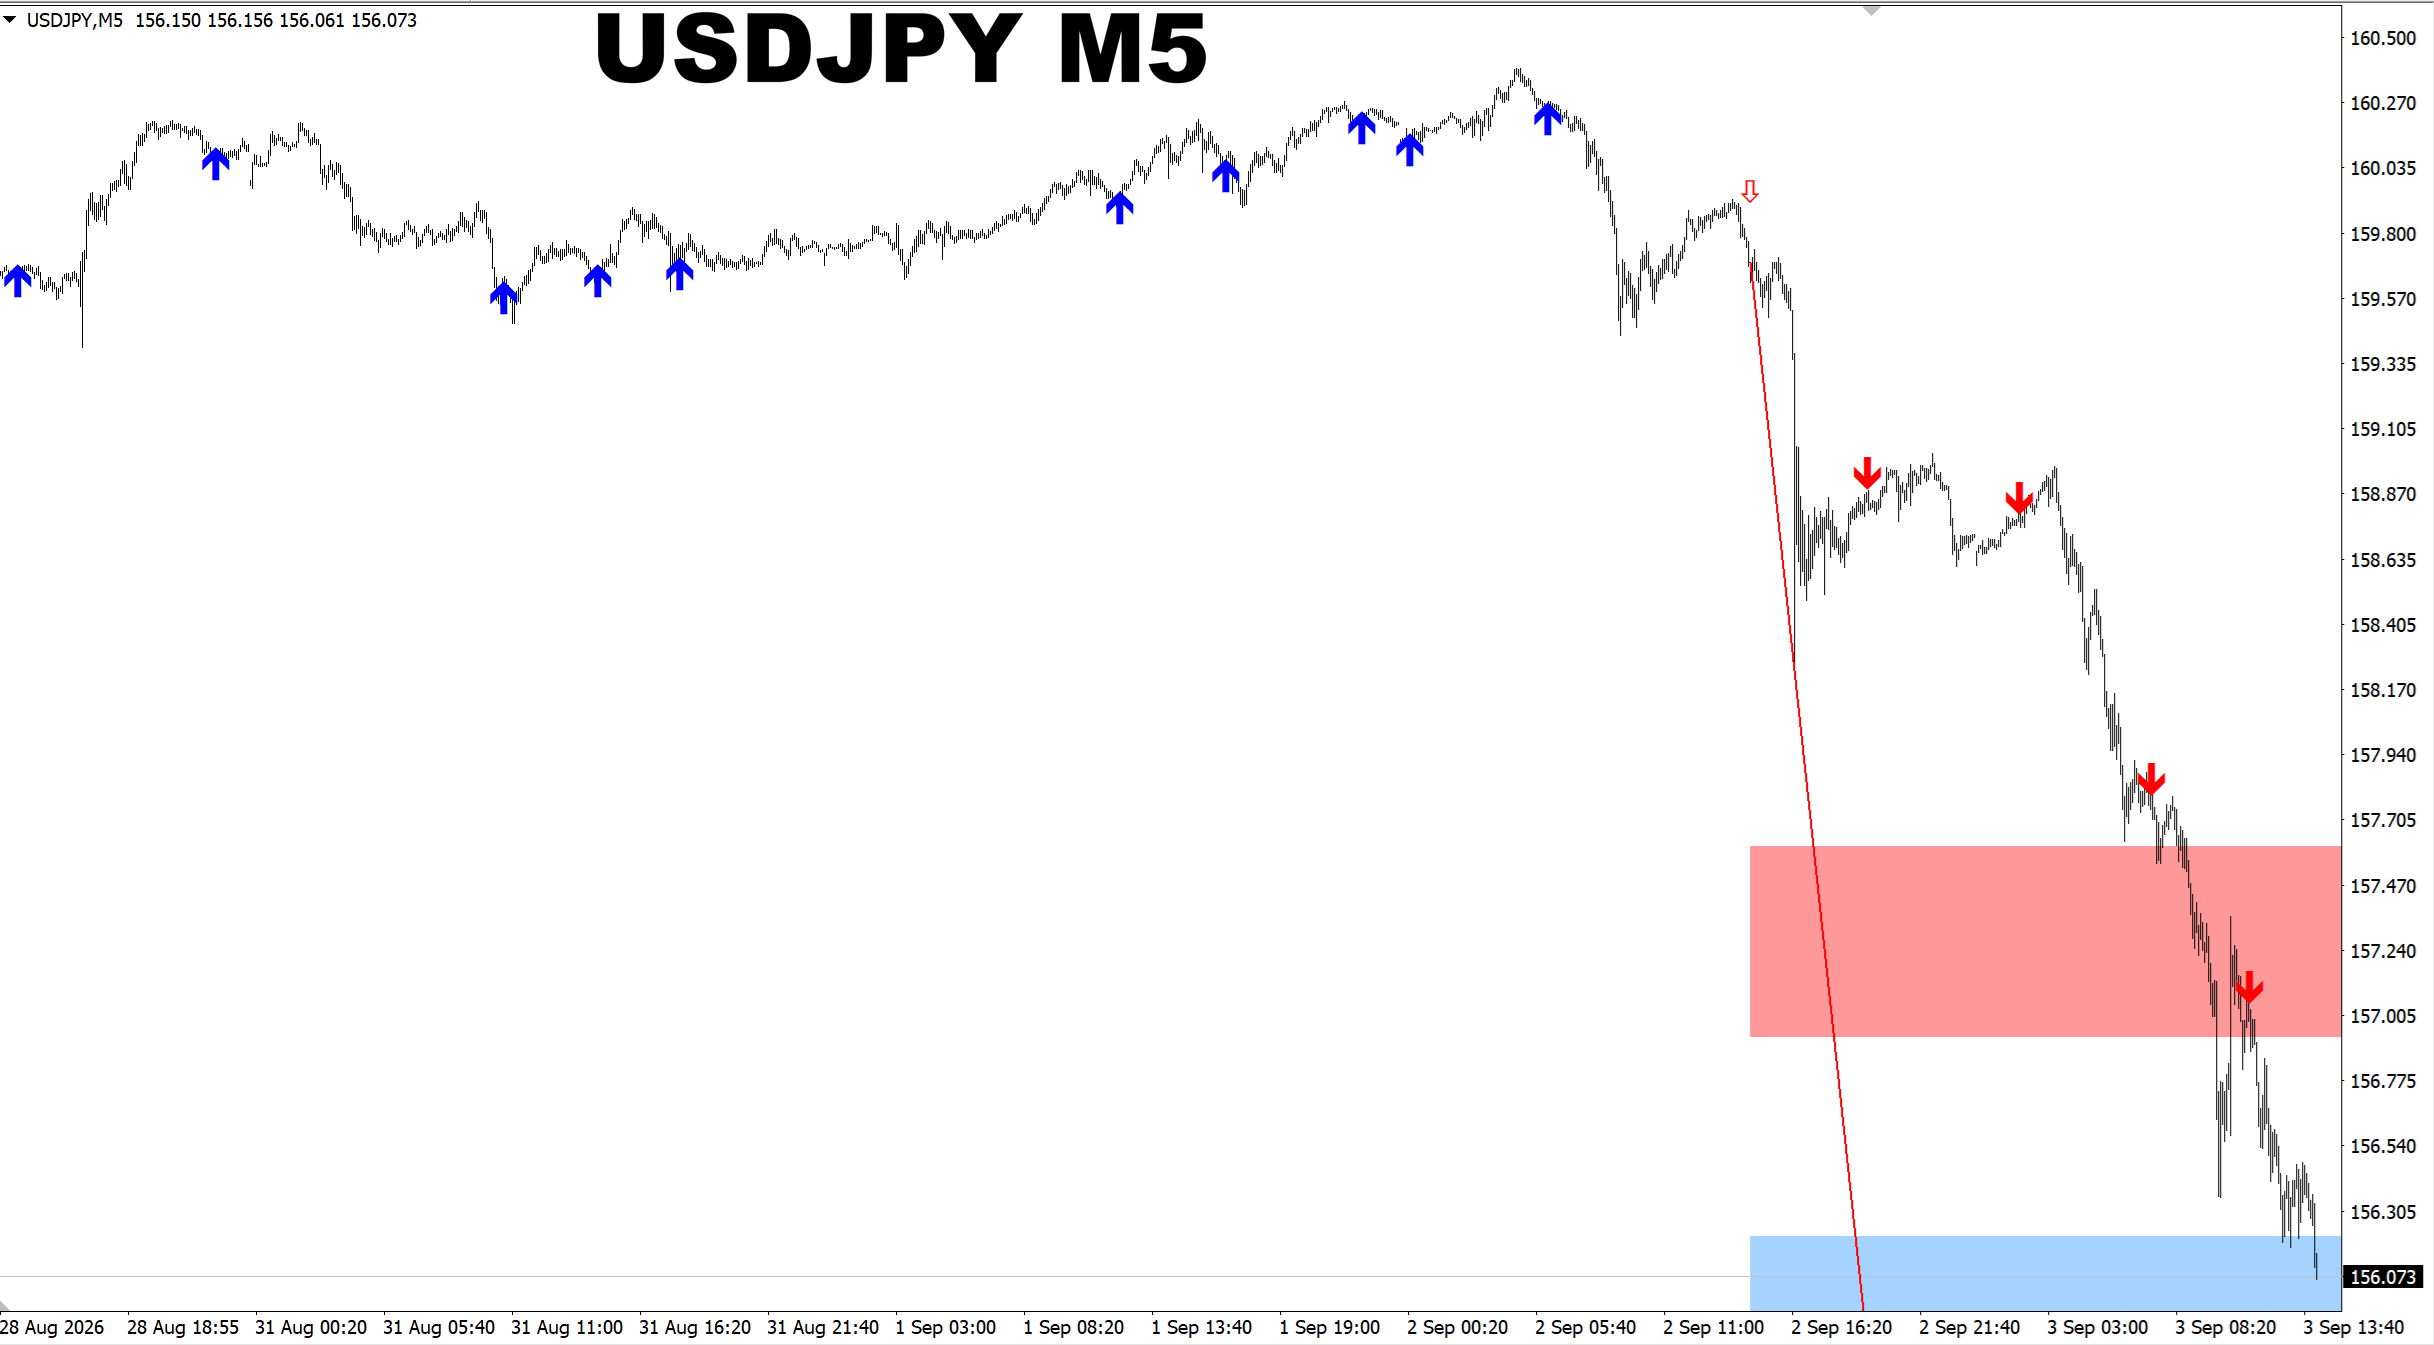
M1 Sniper. USDJPY M5. I noticed I've not posted USDJPY performance screenshots for a while. This is a good pair to trade using the M1 Sniper tool, by the way. So here is recent signals performance on M5. In the next screenshot I will show you how the signals look like on M1 based on the recent data. I use default settings here.
Oleg Rodin
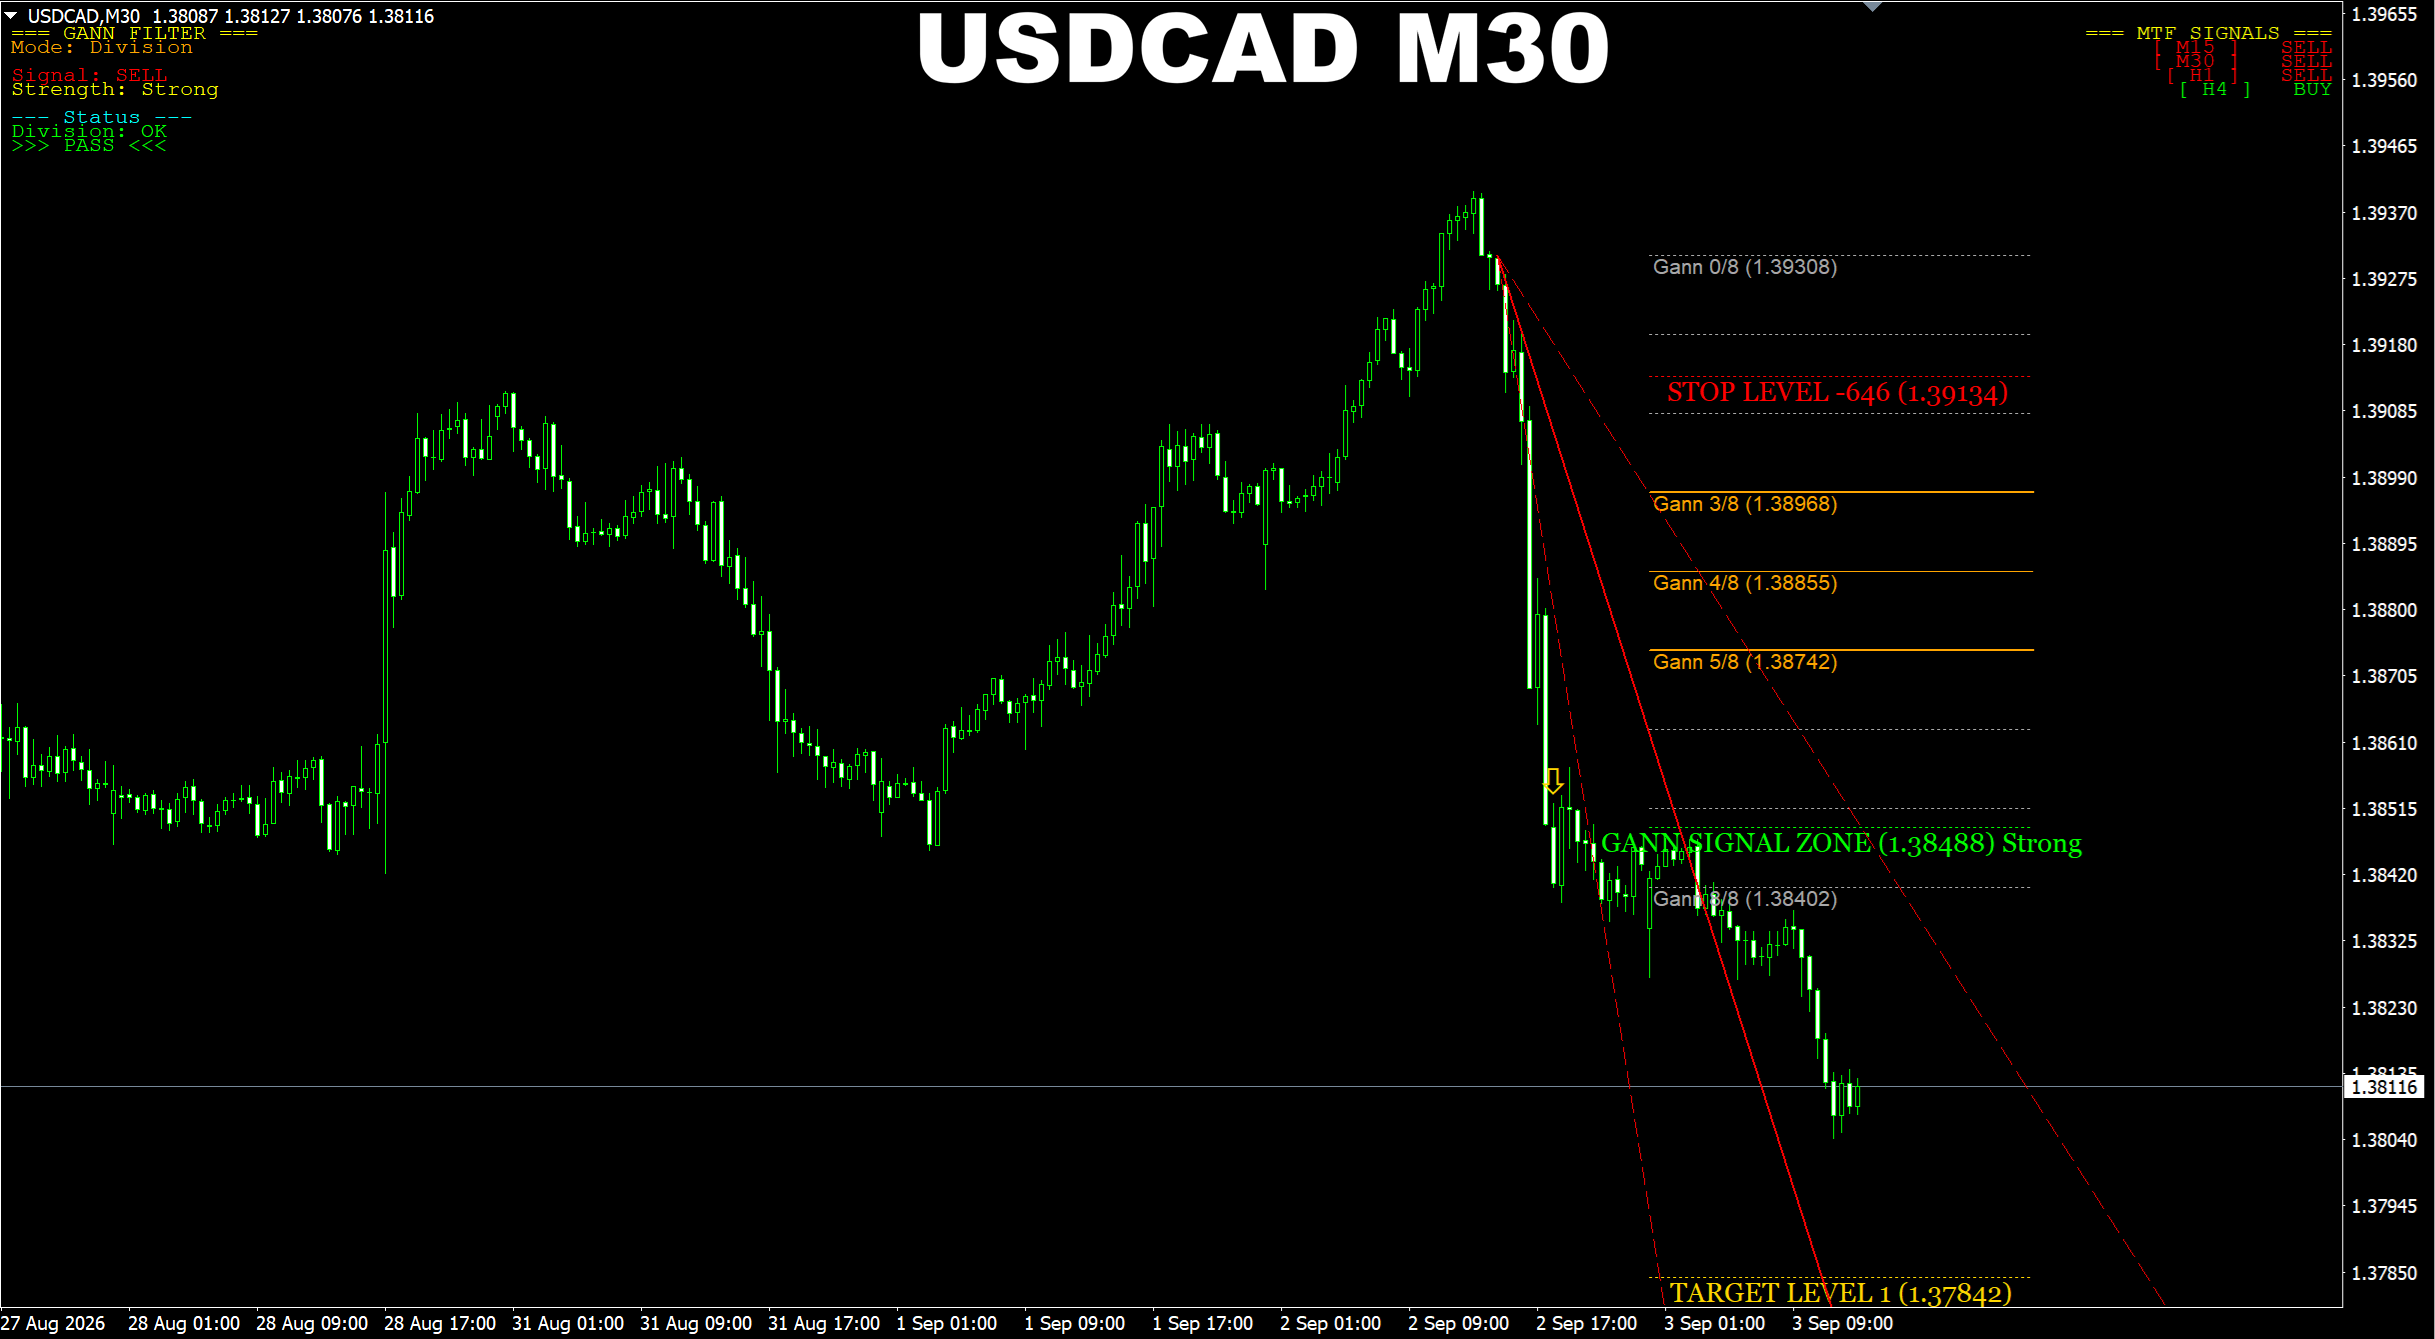
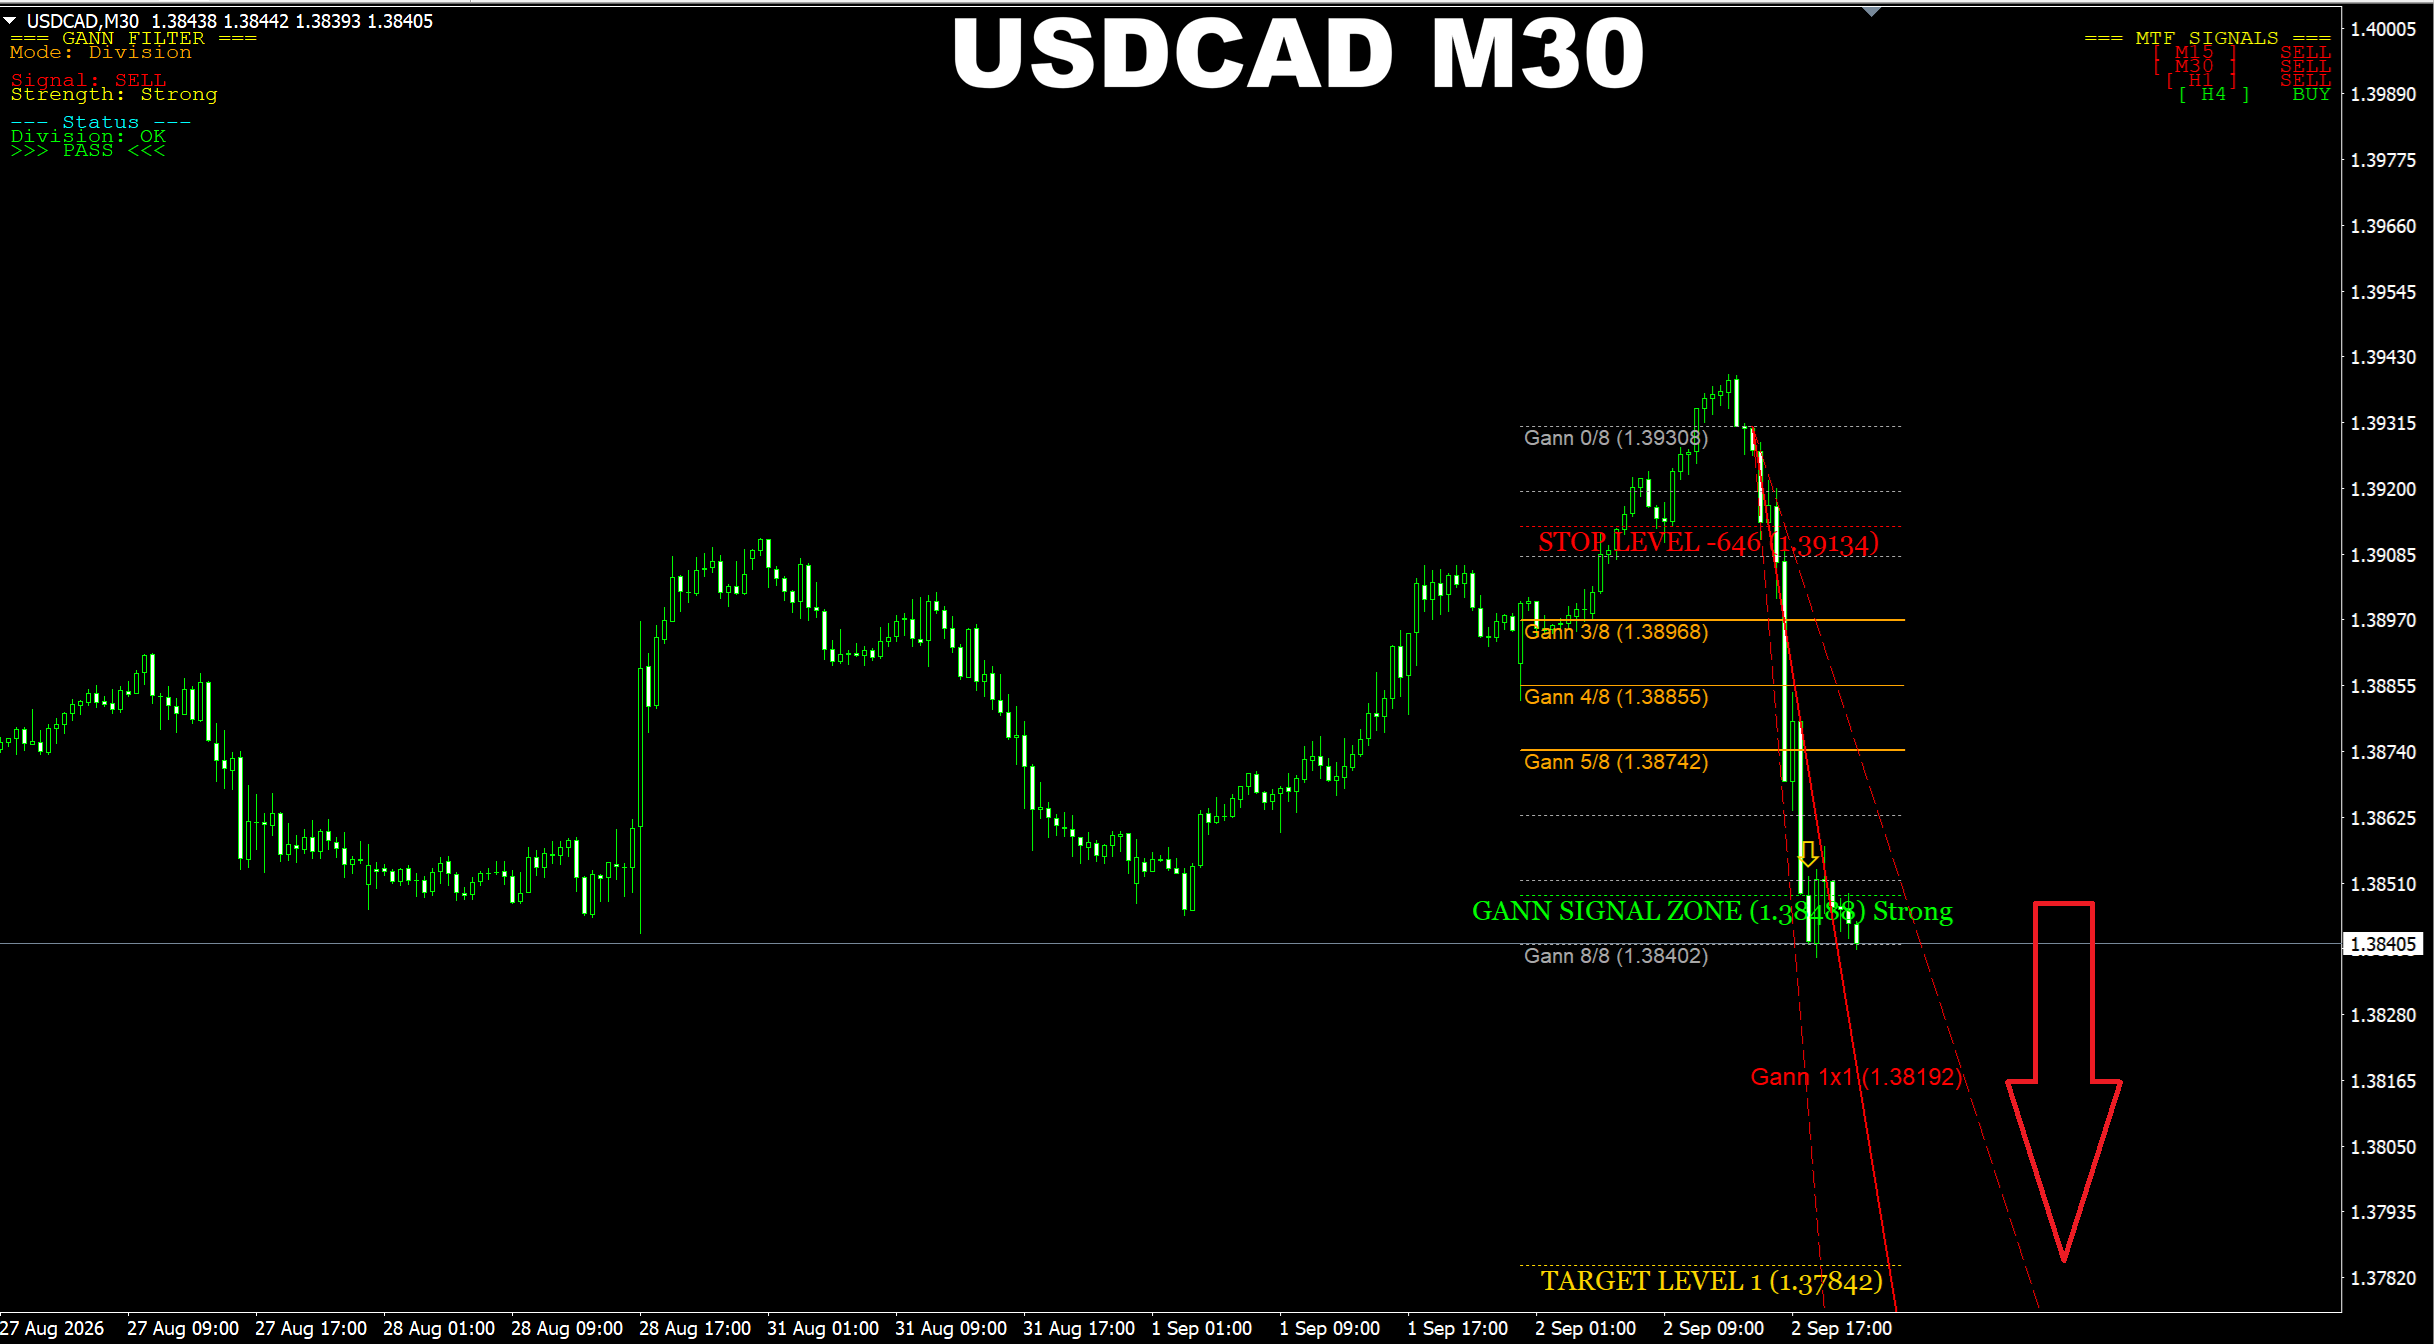
Gann Made Easy. USDCAD M30. Update on the SELL signal I provided earlier. Price is moving toward the predicted area as expected. The target is still valid.
Oleg Rodin
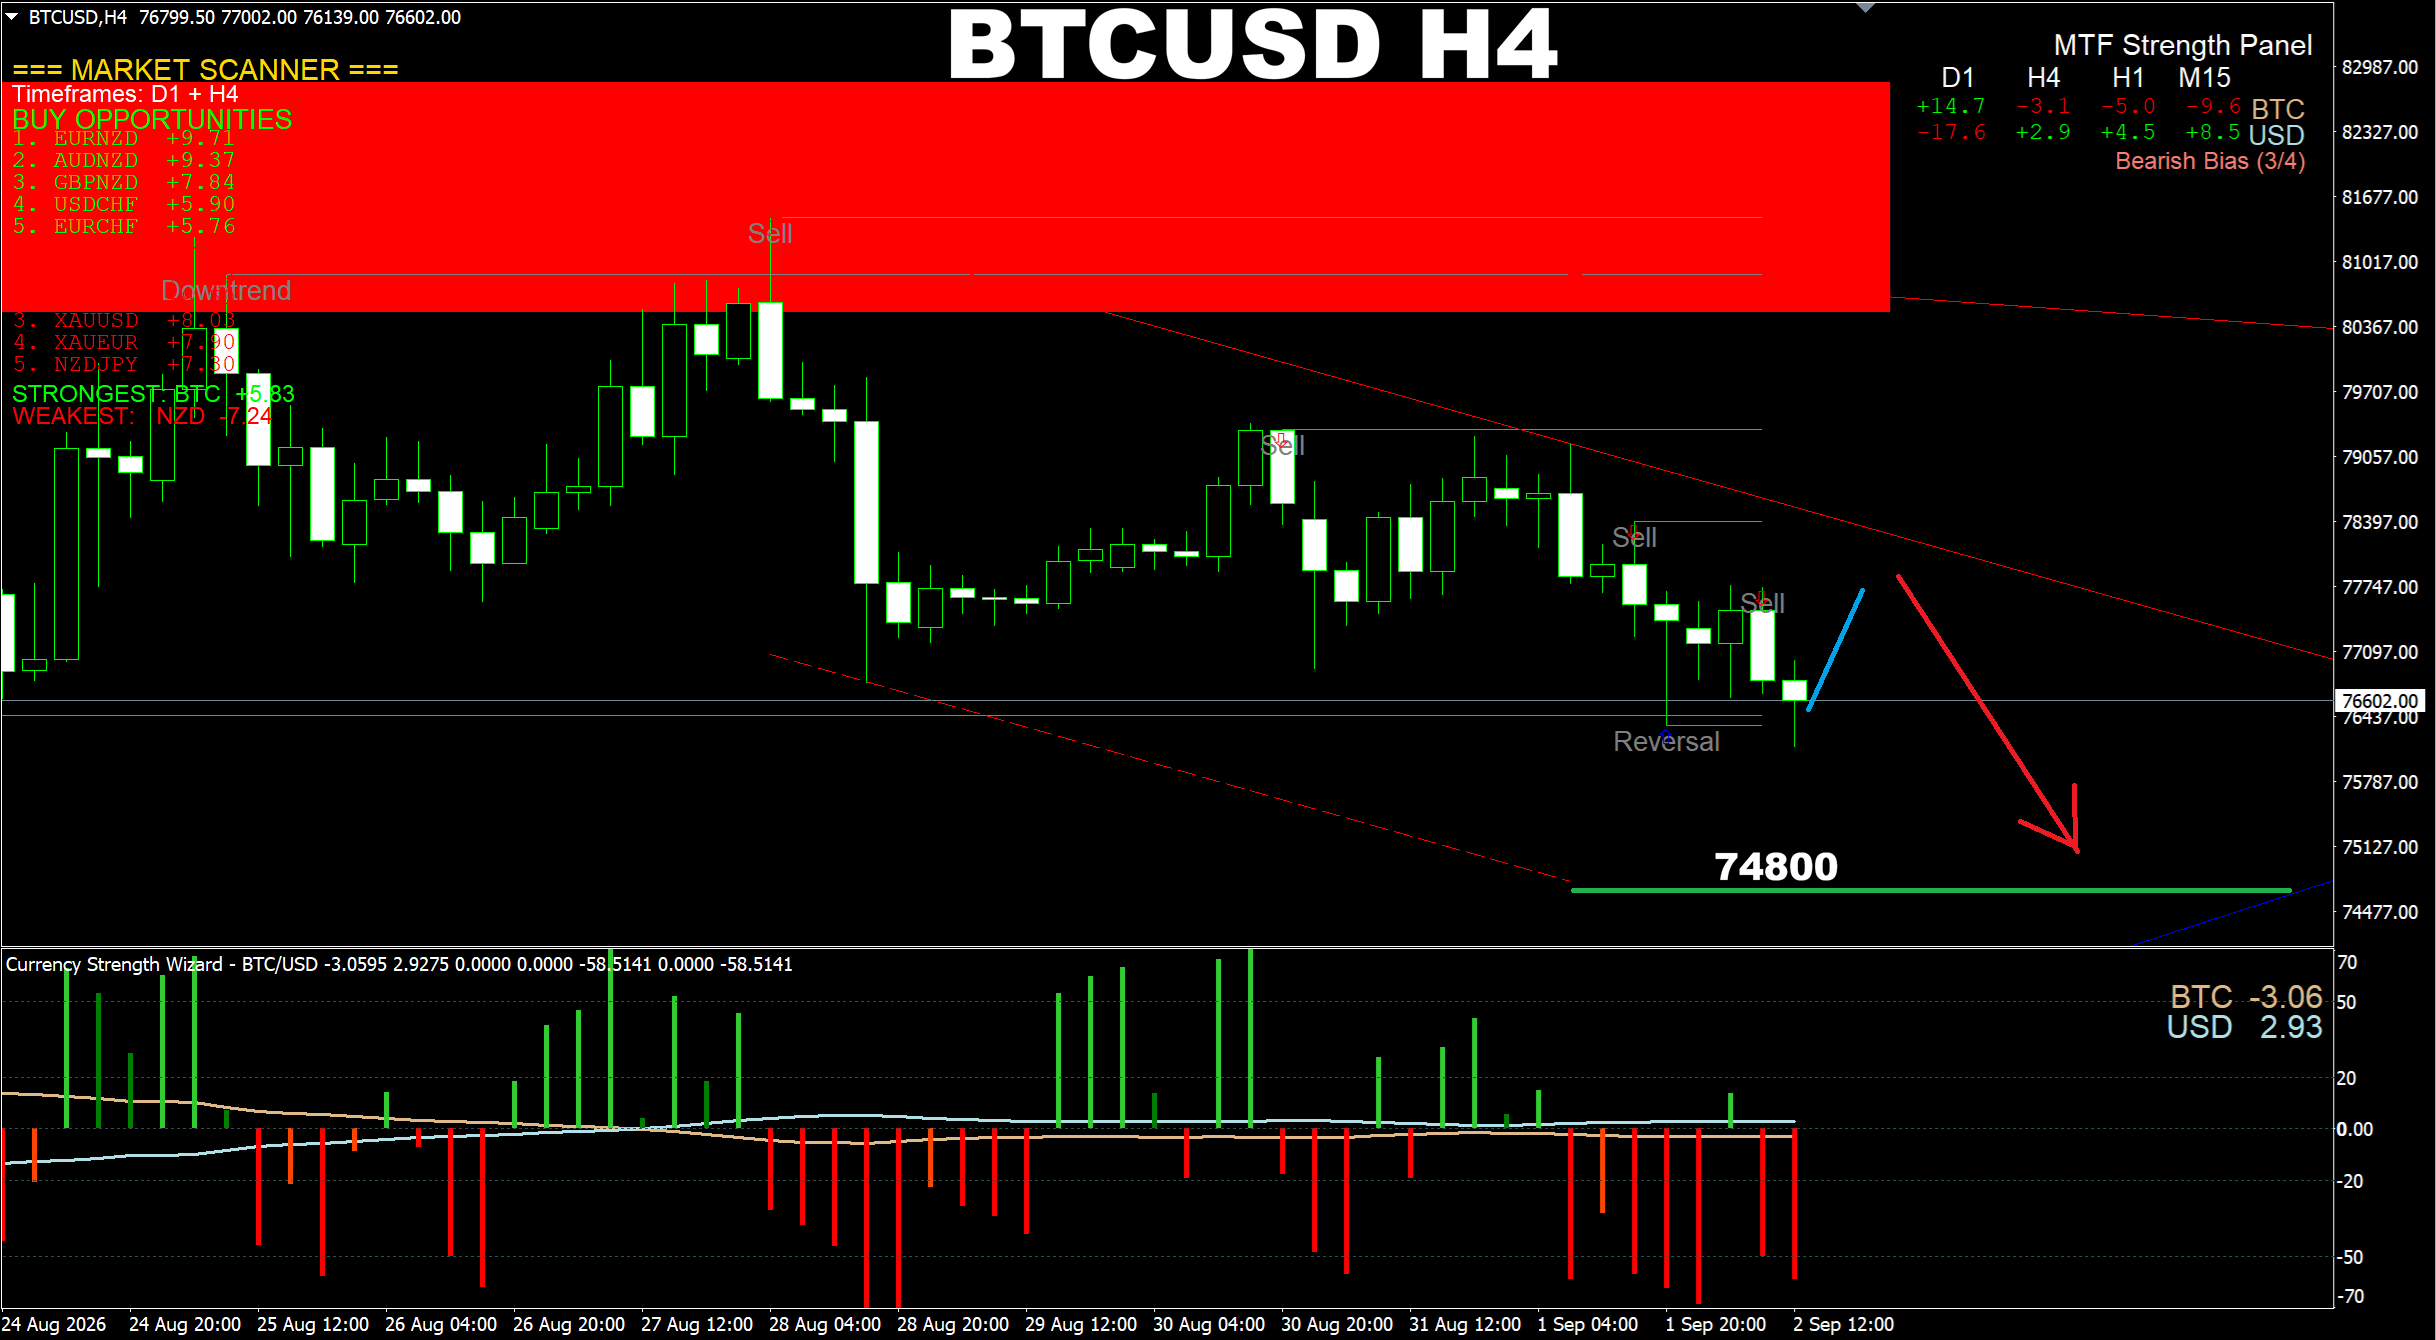
Currency Strength Wizard. BTCUSD H4. Upate on current market. Based on current market conditions, we will see the price eventually going lower toward 74800 area. But first we may see a pullback up as the price is at the Support area now.
Oleg Rodin
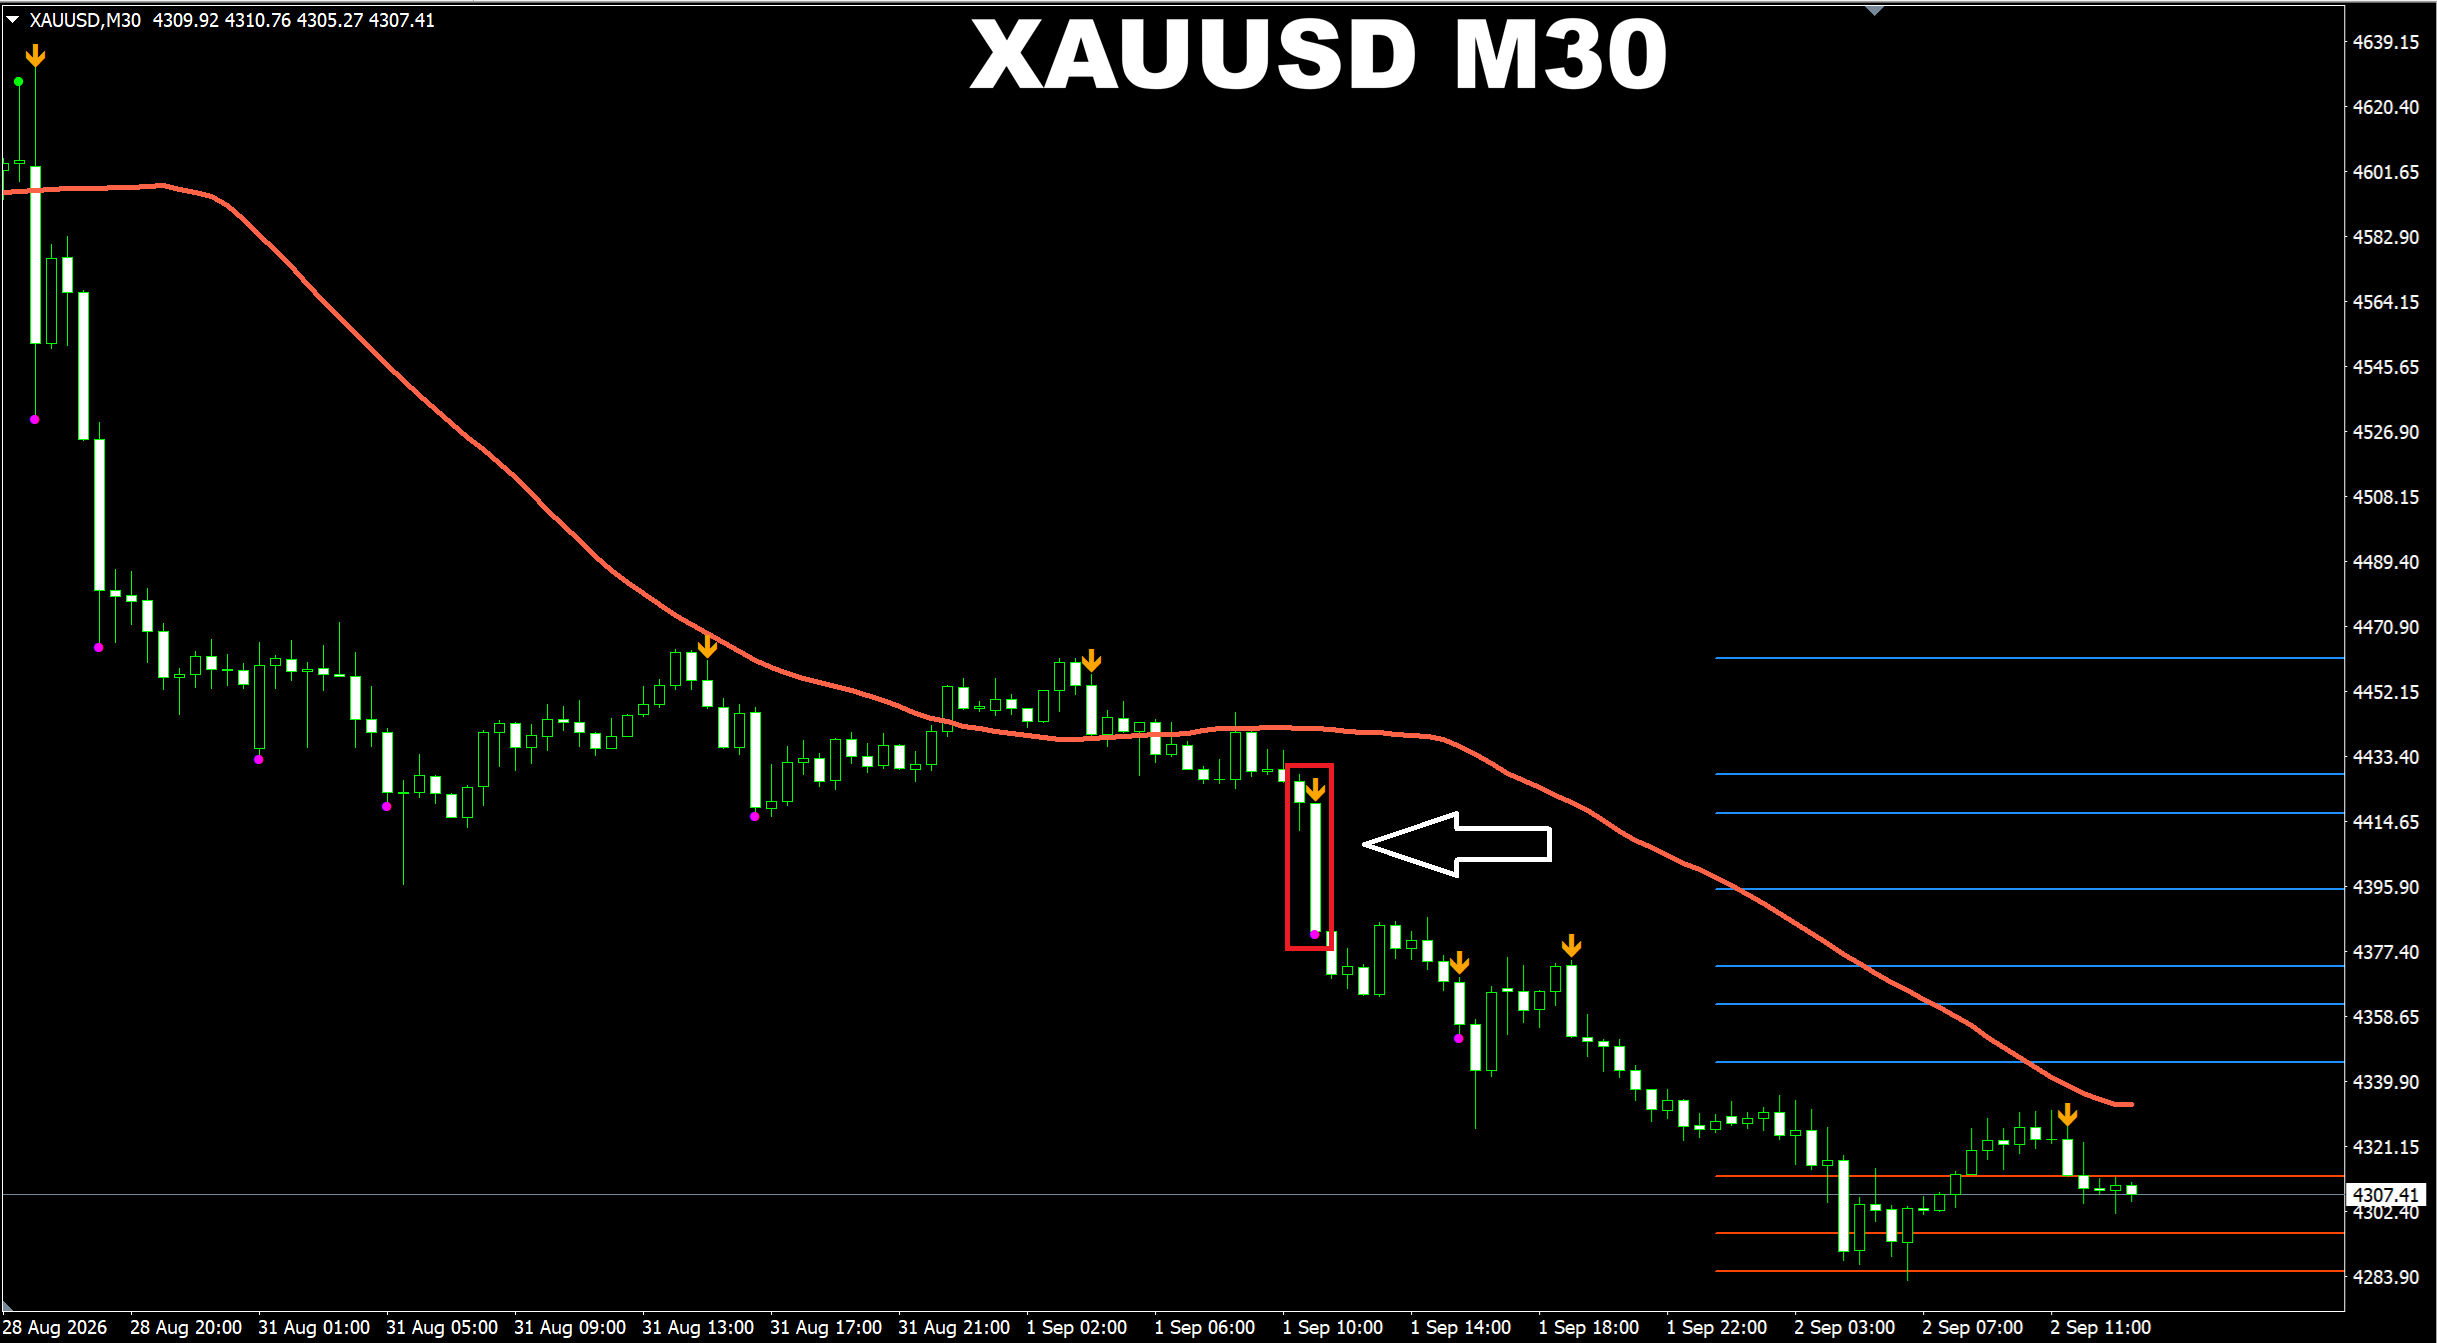
Scalper Vault. XAUUSD M30. Remember that SELL signal I provided yesterday? See how accurately it predicted the selling wave. If you look at the screenshot with attention, you will see that we have 3 similar signal patterns there. And all of them did their job well. In the latest version of the indicator I signifincatly improved how the dot type signals work and I made them work such a way so we can now use them in combo with the arrow signals. Based on these combinations we may have several types of signal patterns. So the pattern I provided earlier is actually a strong breakout pattern. Such patterns work great practically all the time.
Oleg Rodin
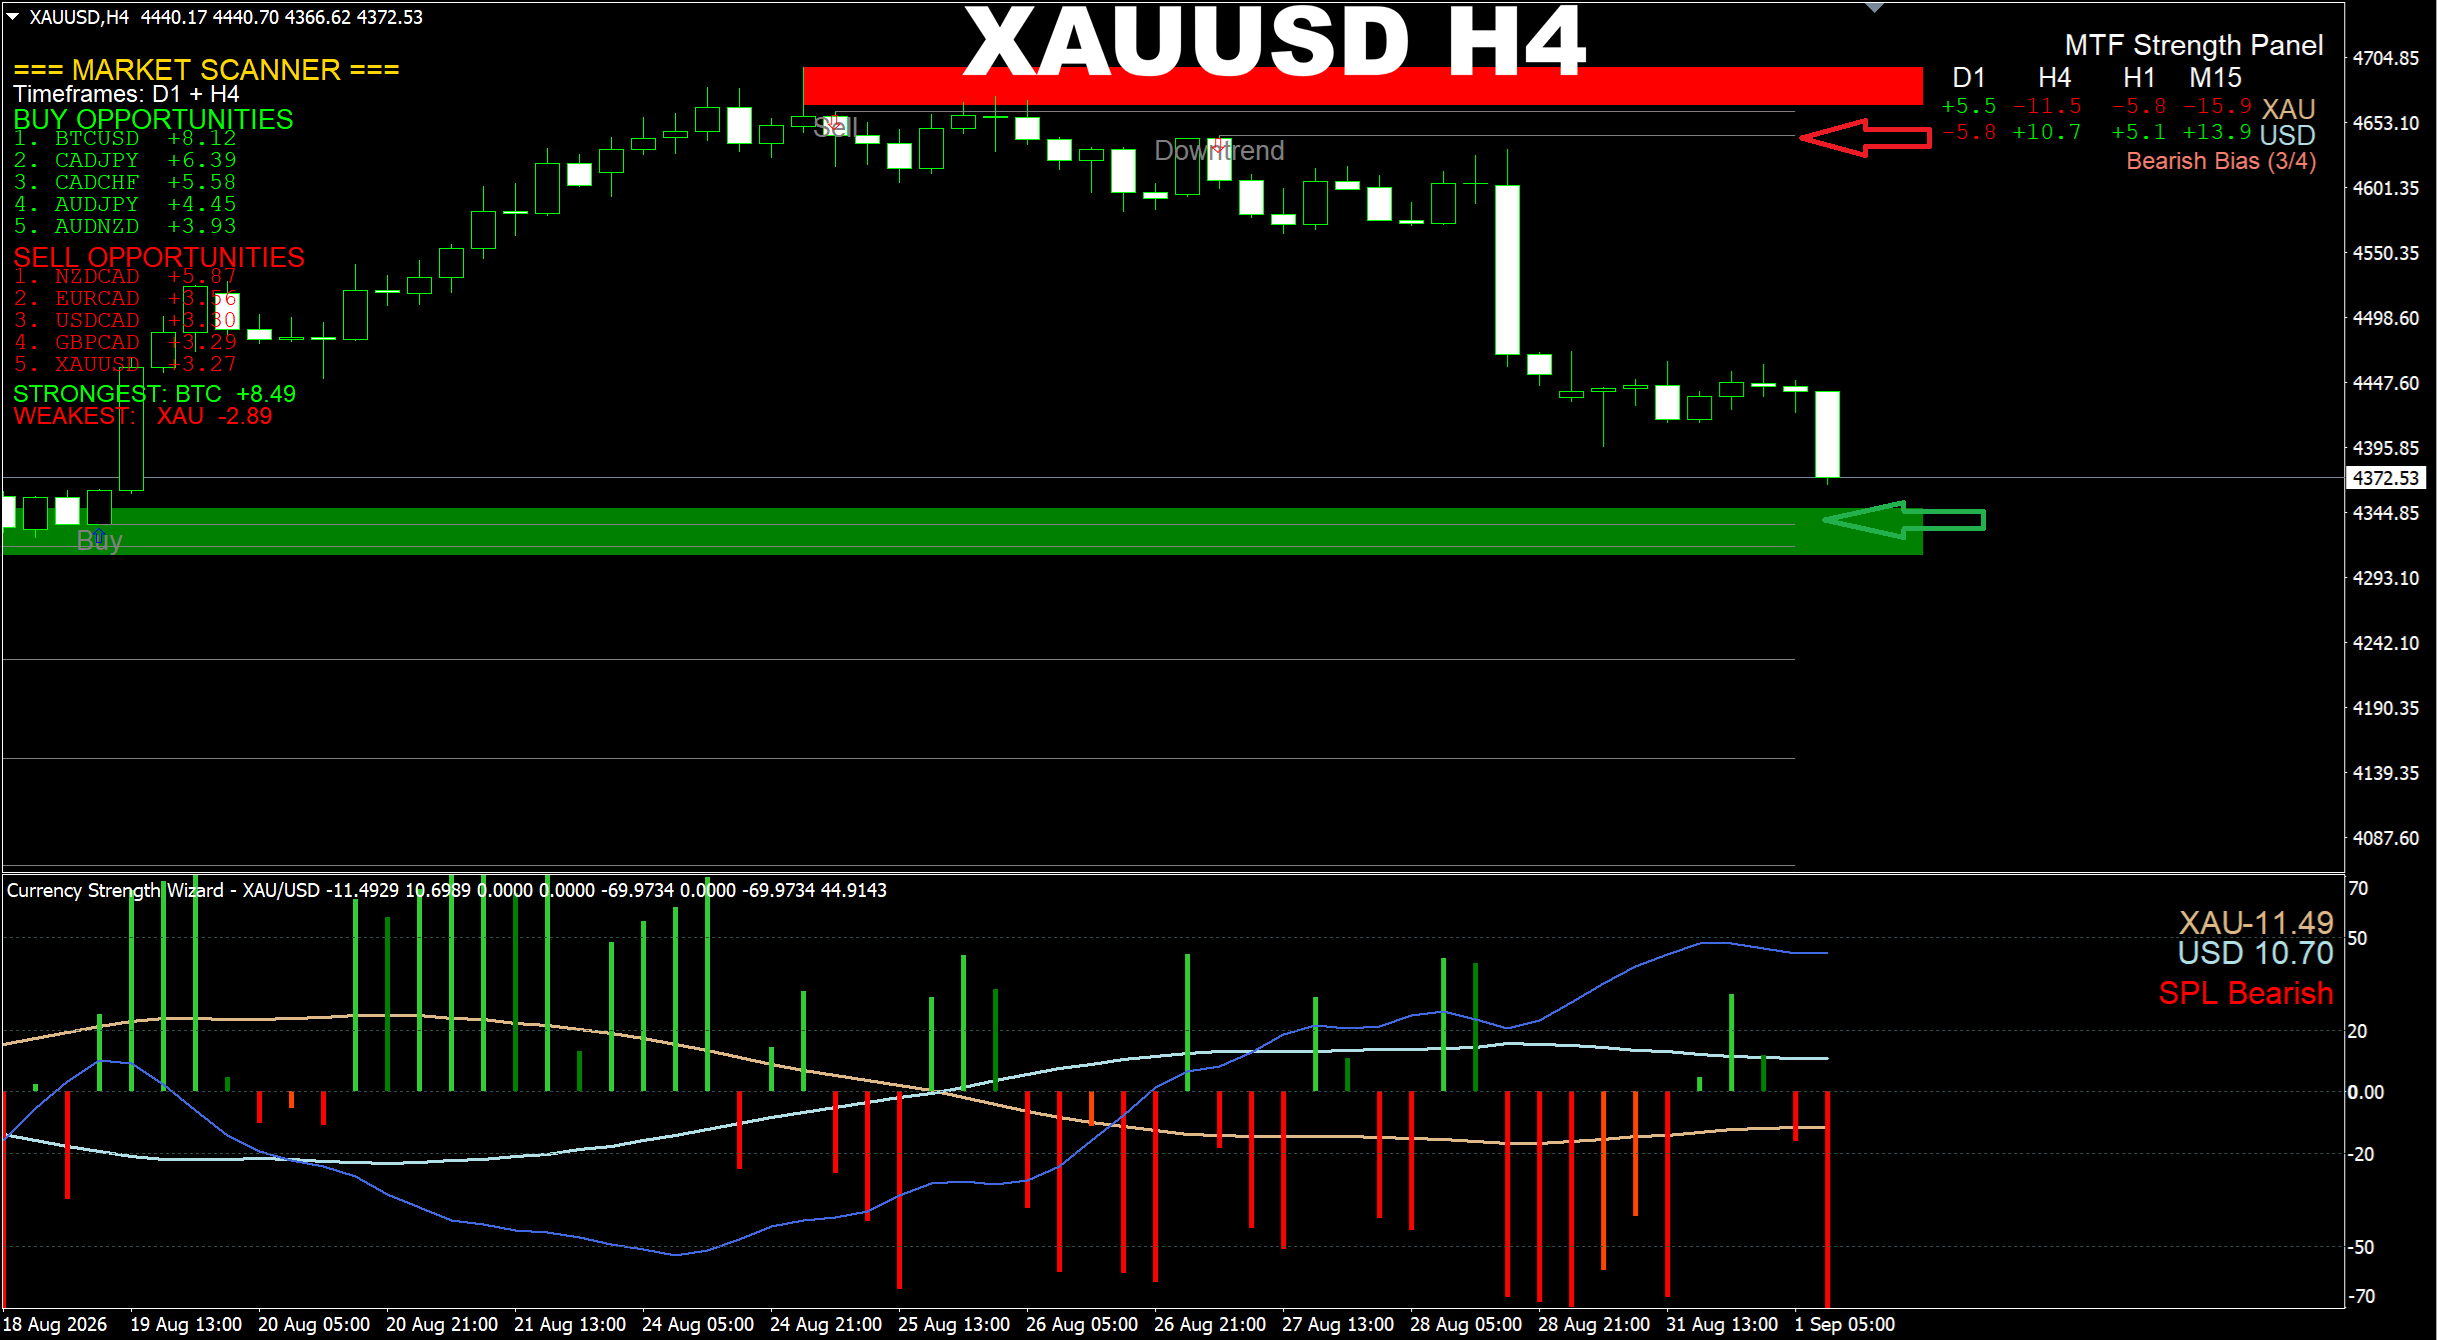
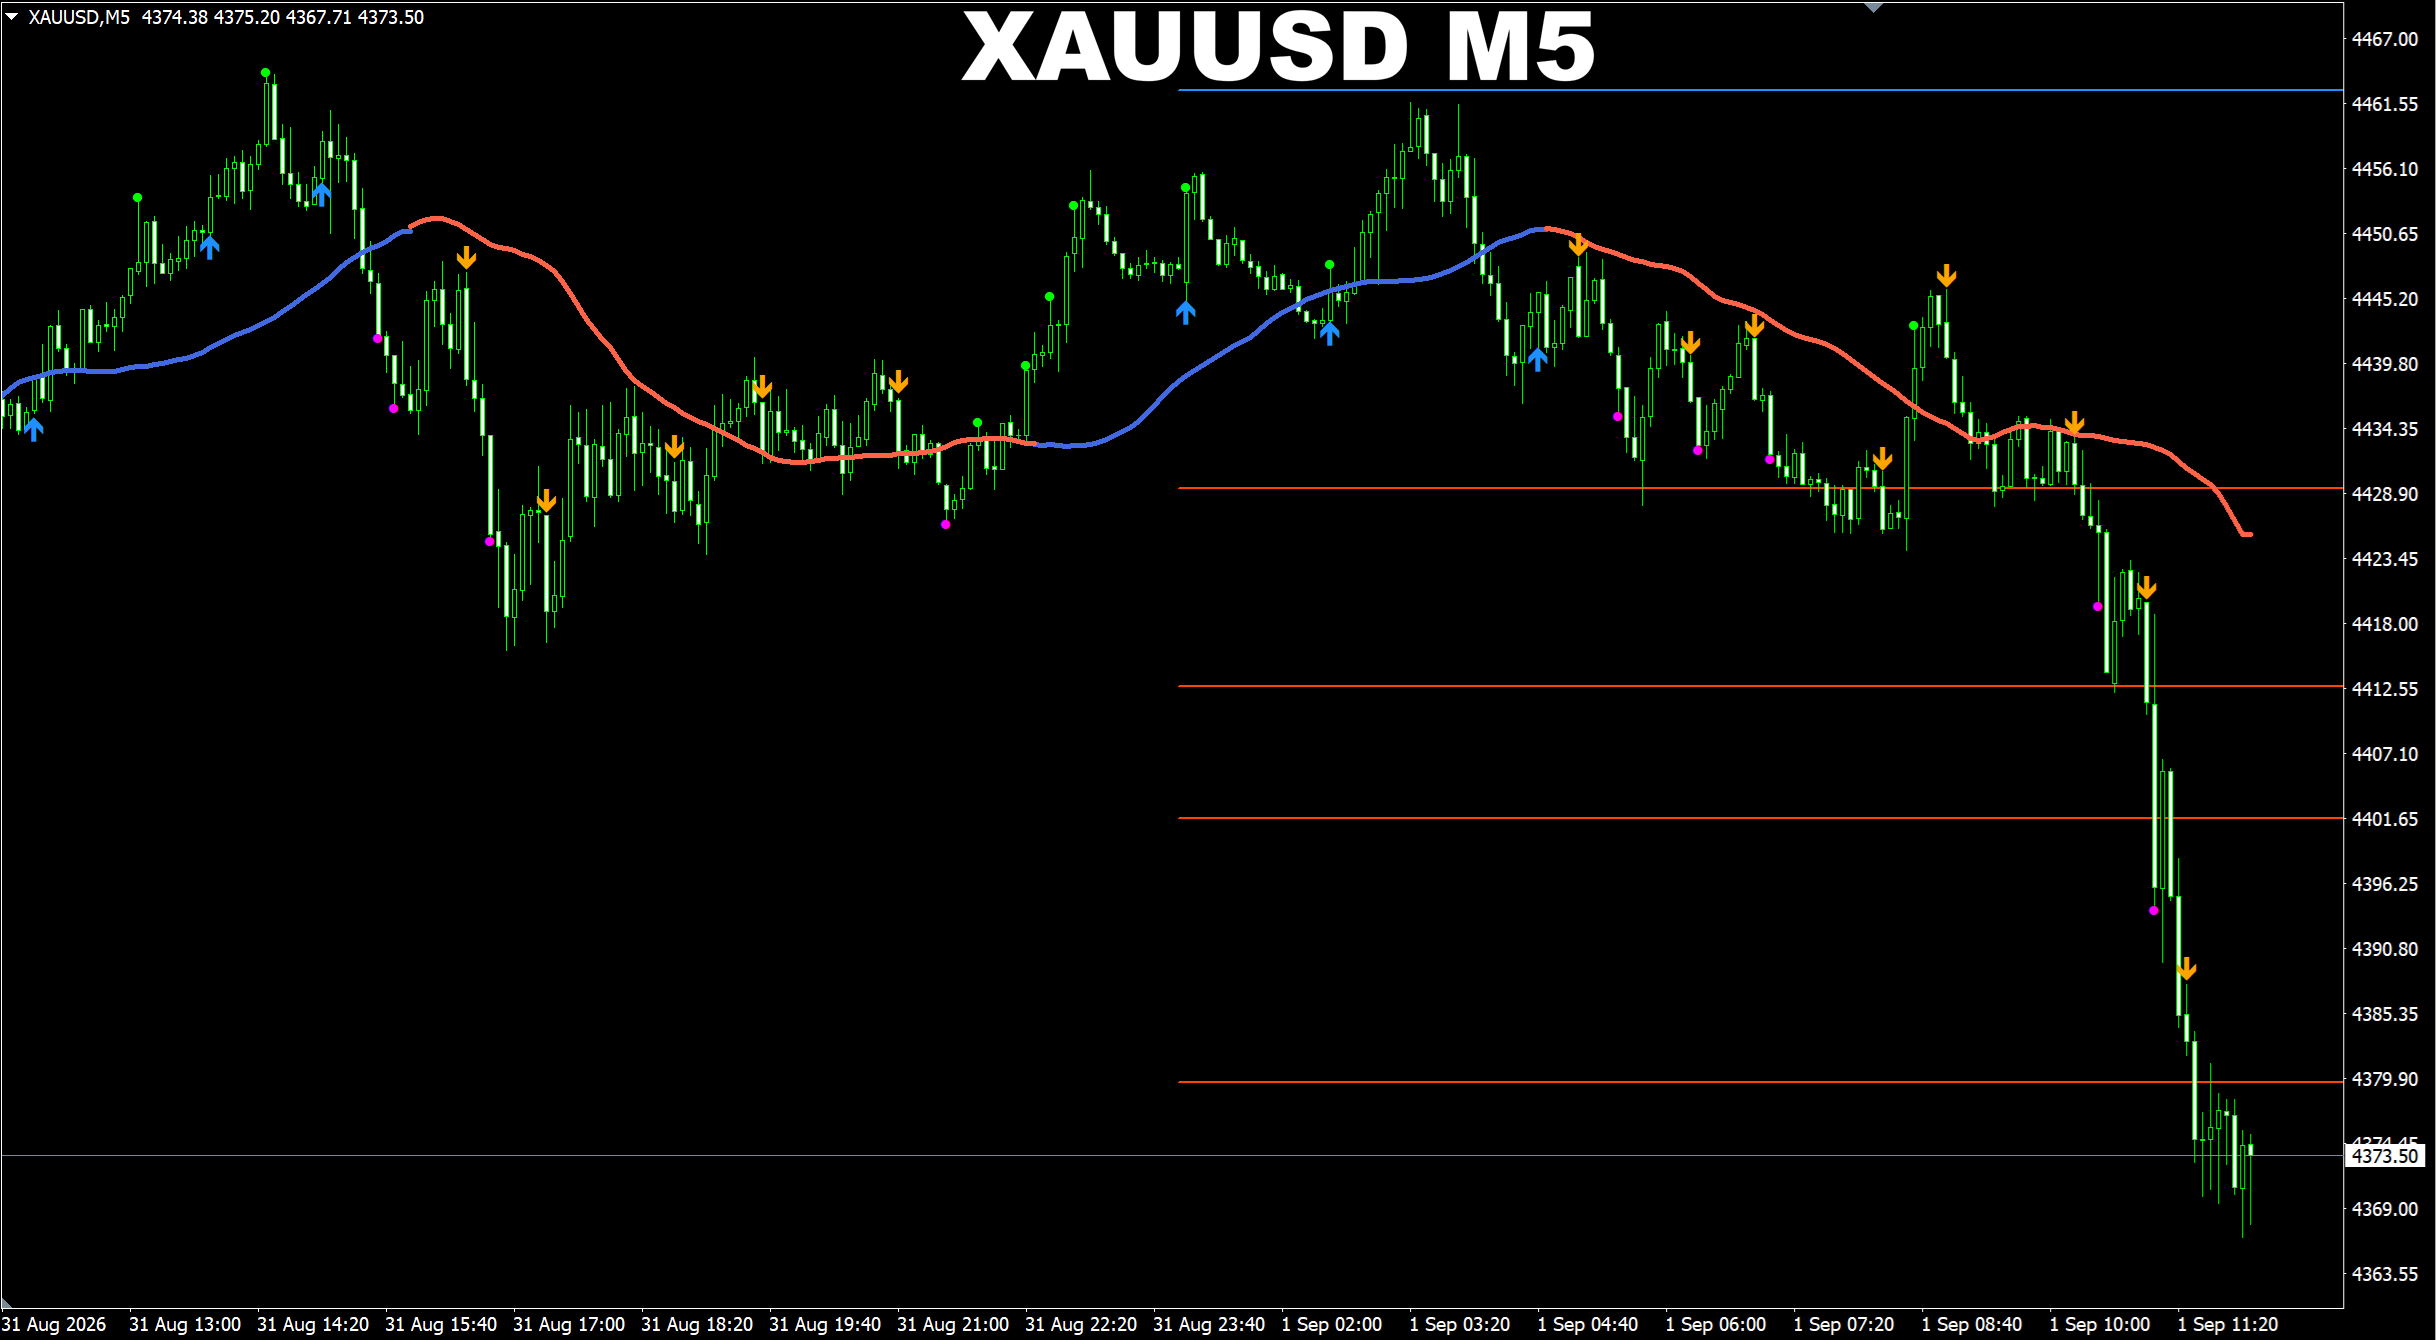
Currency Strength Wizard. XAUUSD H4. Another update on current market. Ok, price has reached the predicted area. Now selling is not recommended as the price is not going to break that Support right away. Maybe possible but I am just being realistic. This is why we can expect the short-term UP wave instead. This wave should bring the price up to 4395+ area. Then the price should turn down again after the pullback. But when it does this, we still should not expect it to break the Support as it may require more time for this to happen. Anyways I will try to keep you updated.
Oleg Rodin
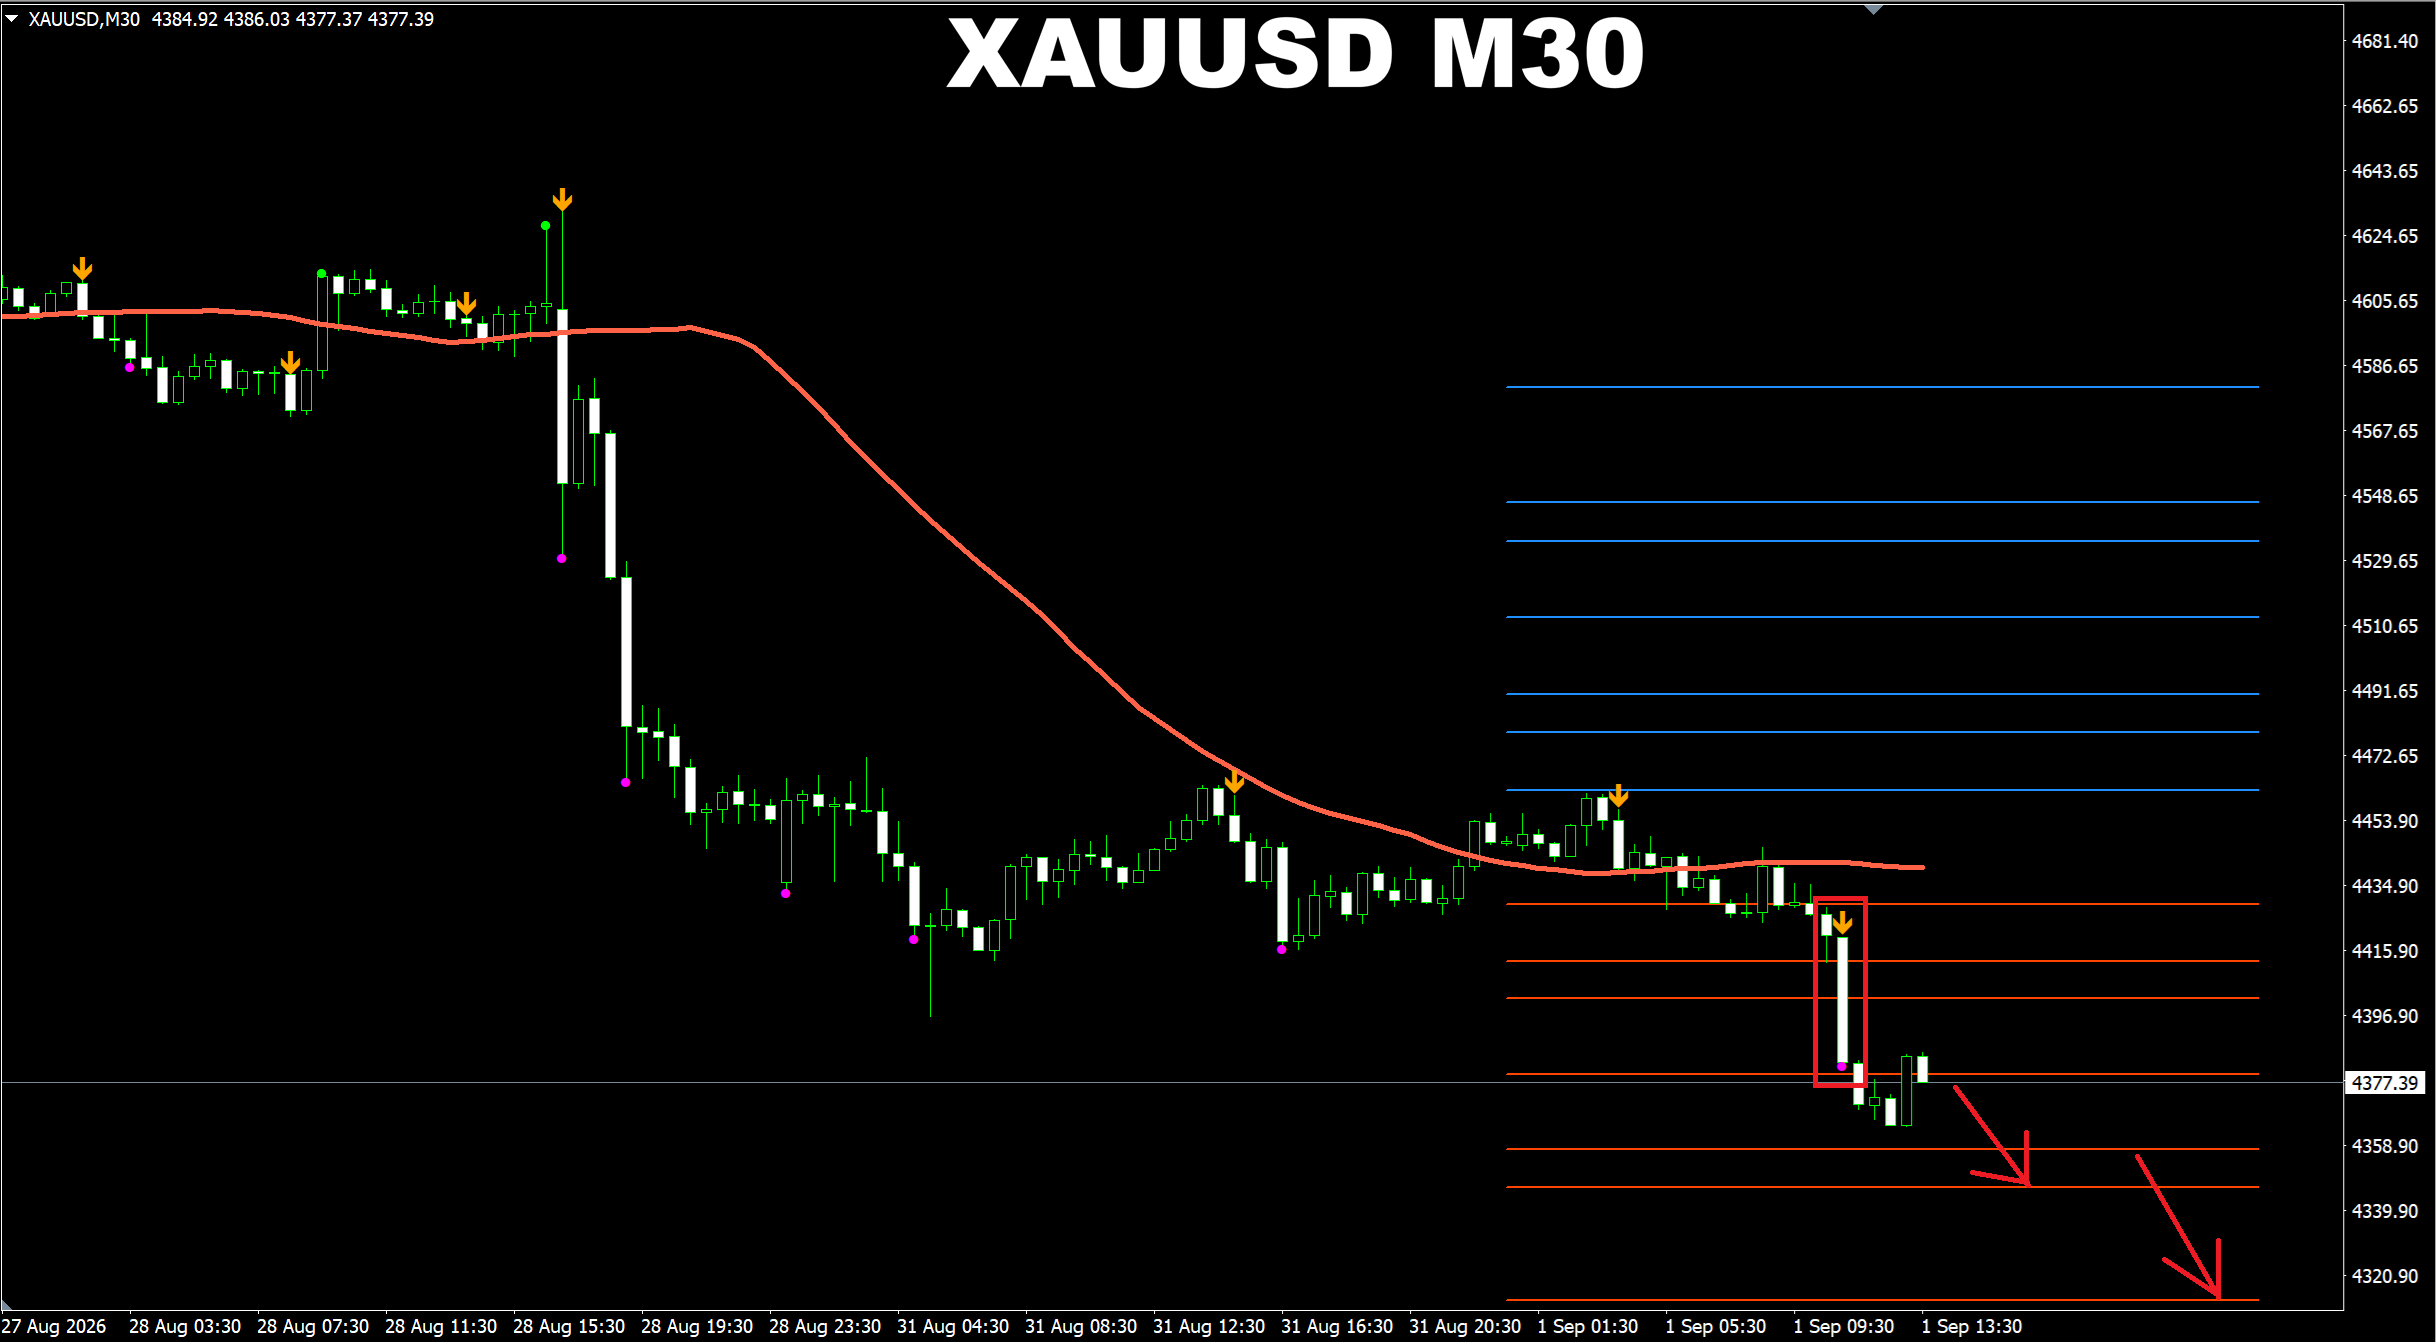
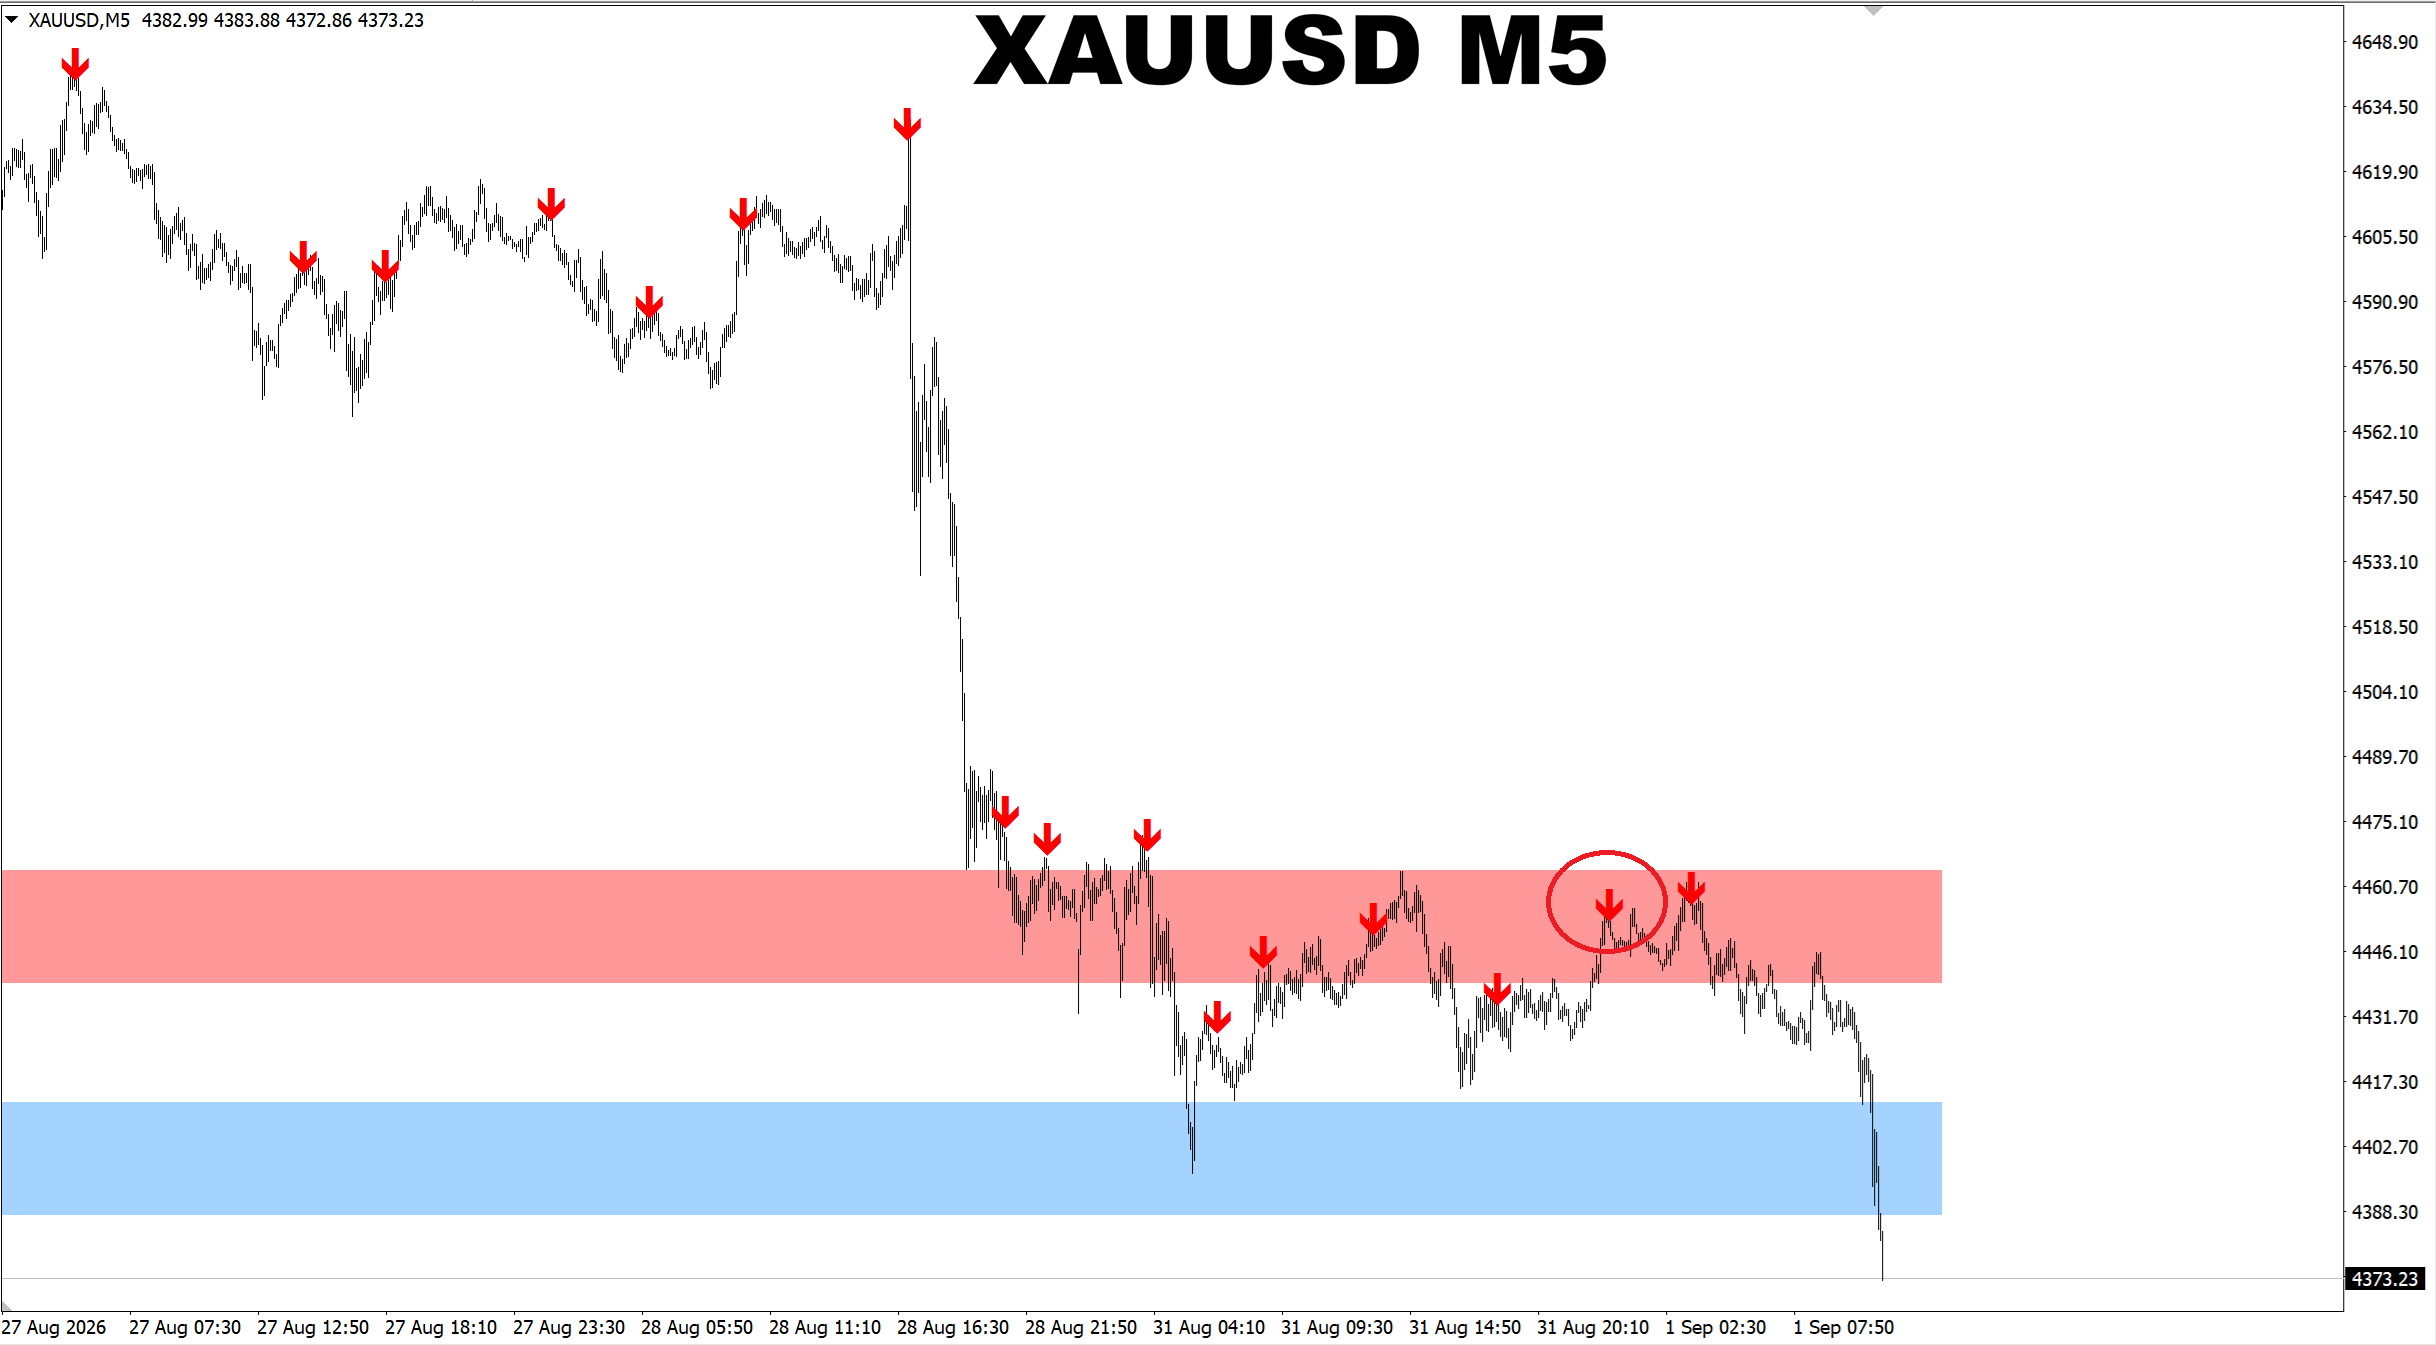
Scalper Vault. XAUUSD M30. Remember this signal pattern I show from time to time? Yes, this is the arrow with the dot on the same candle. It is a breakout pattern. So this means that the price will eventually reach the area where I put the first arrow, even with a chance to reach the area where I put the second arrow.
Oleg Rodin
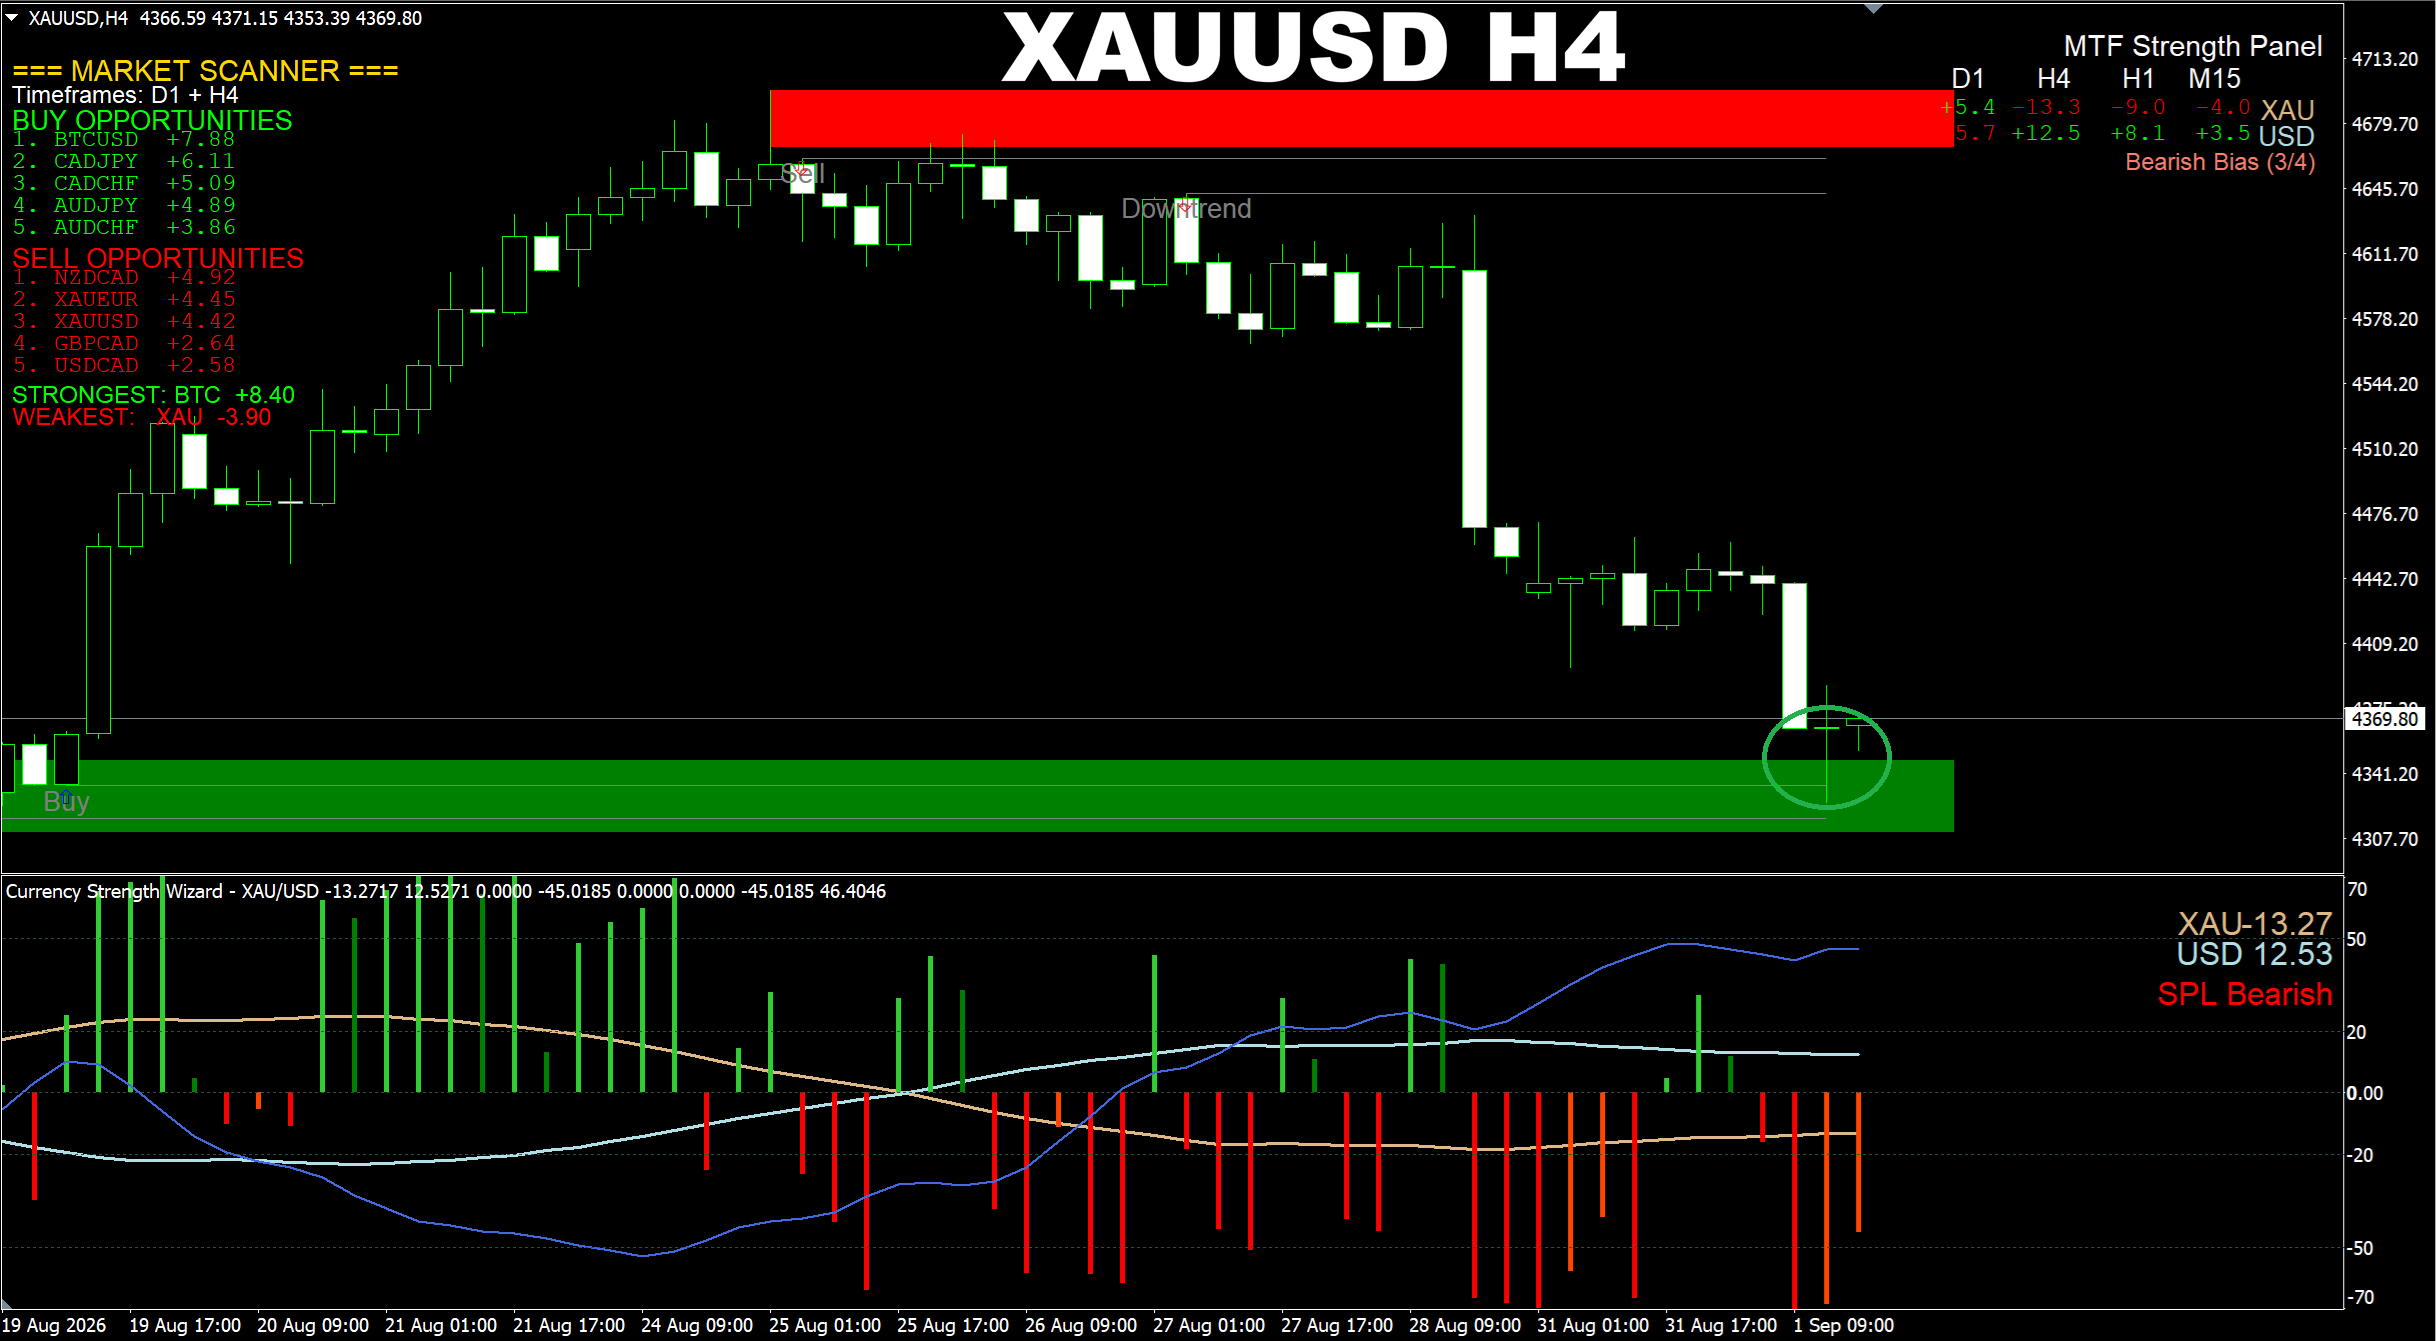
Currency Strength Wizard. XAUUSD H4. Remember this SELL signal I provided several days ago? Now the price is approaching the actual strong Support area which is the 4335-4340 area. This is the true first strong Support area since the time the price started falling. As a result we may see some reaction from this area. It means if you're still selling, it is possible to close the trade when the price reaches that level. And it will be possible to have some short-term UP trade I believe. So this is what I see. The price reaches this area and we see UP short-term wave and then again down. And when it reaches that area again, we will have another chance for another UP trade. Then it will go down again and this will be the moment when it breaches that area and goes lower. In other words we will see some range movements up and down before the price continues going lower. Moreover the chance to go lower eventually is higher than going UP again. At least this is what I see now. Anyways I will keep you updated as always.
Oleg Rodin
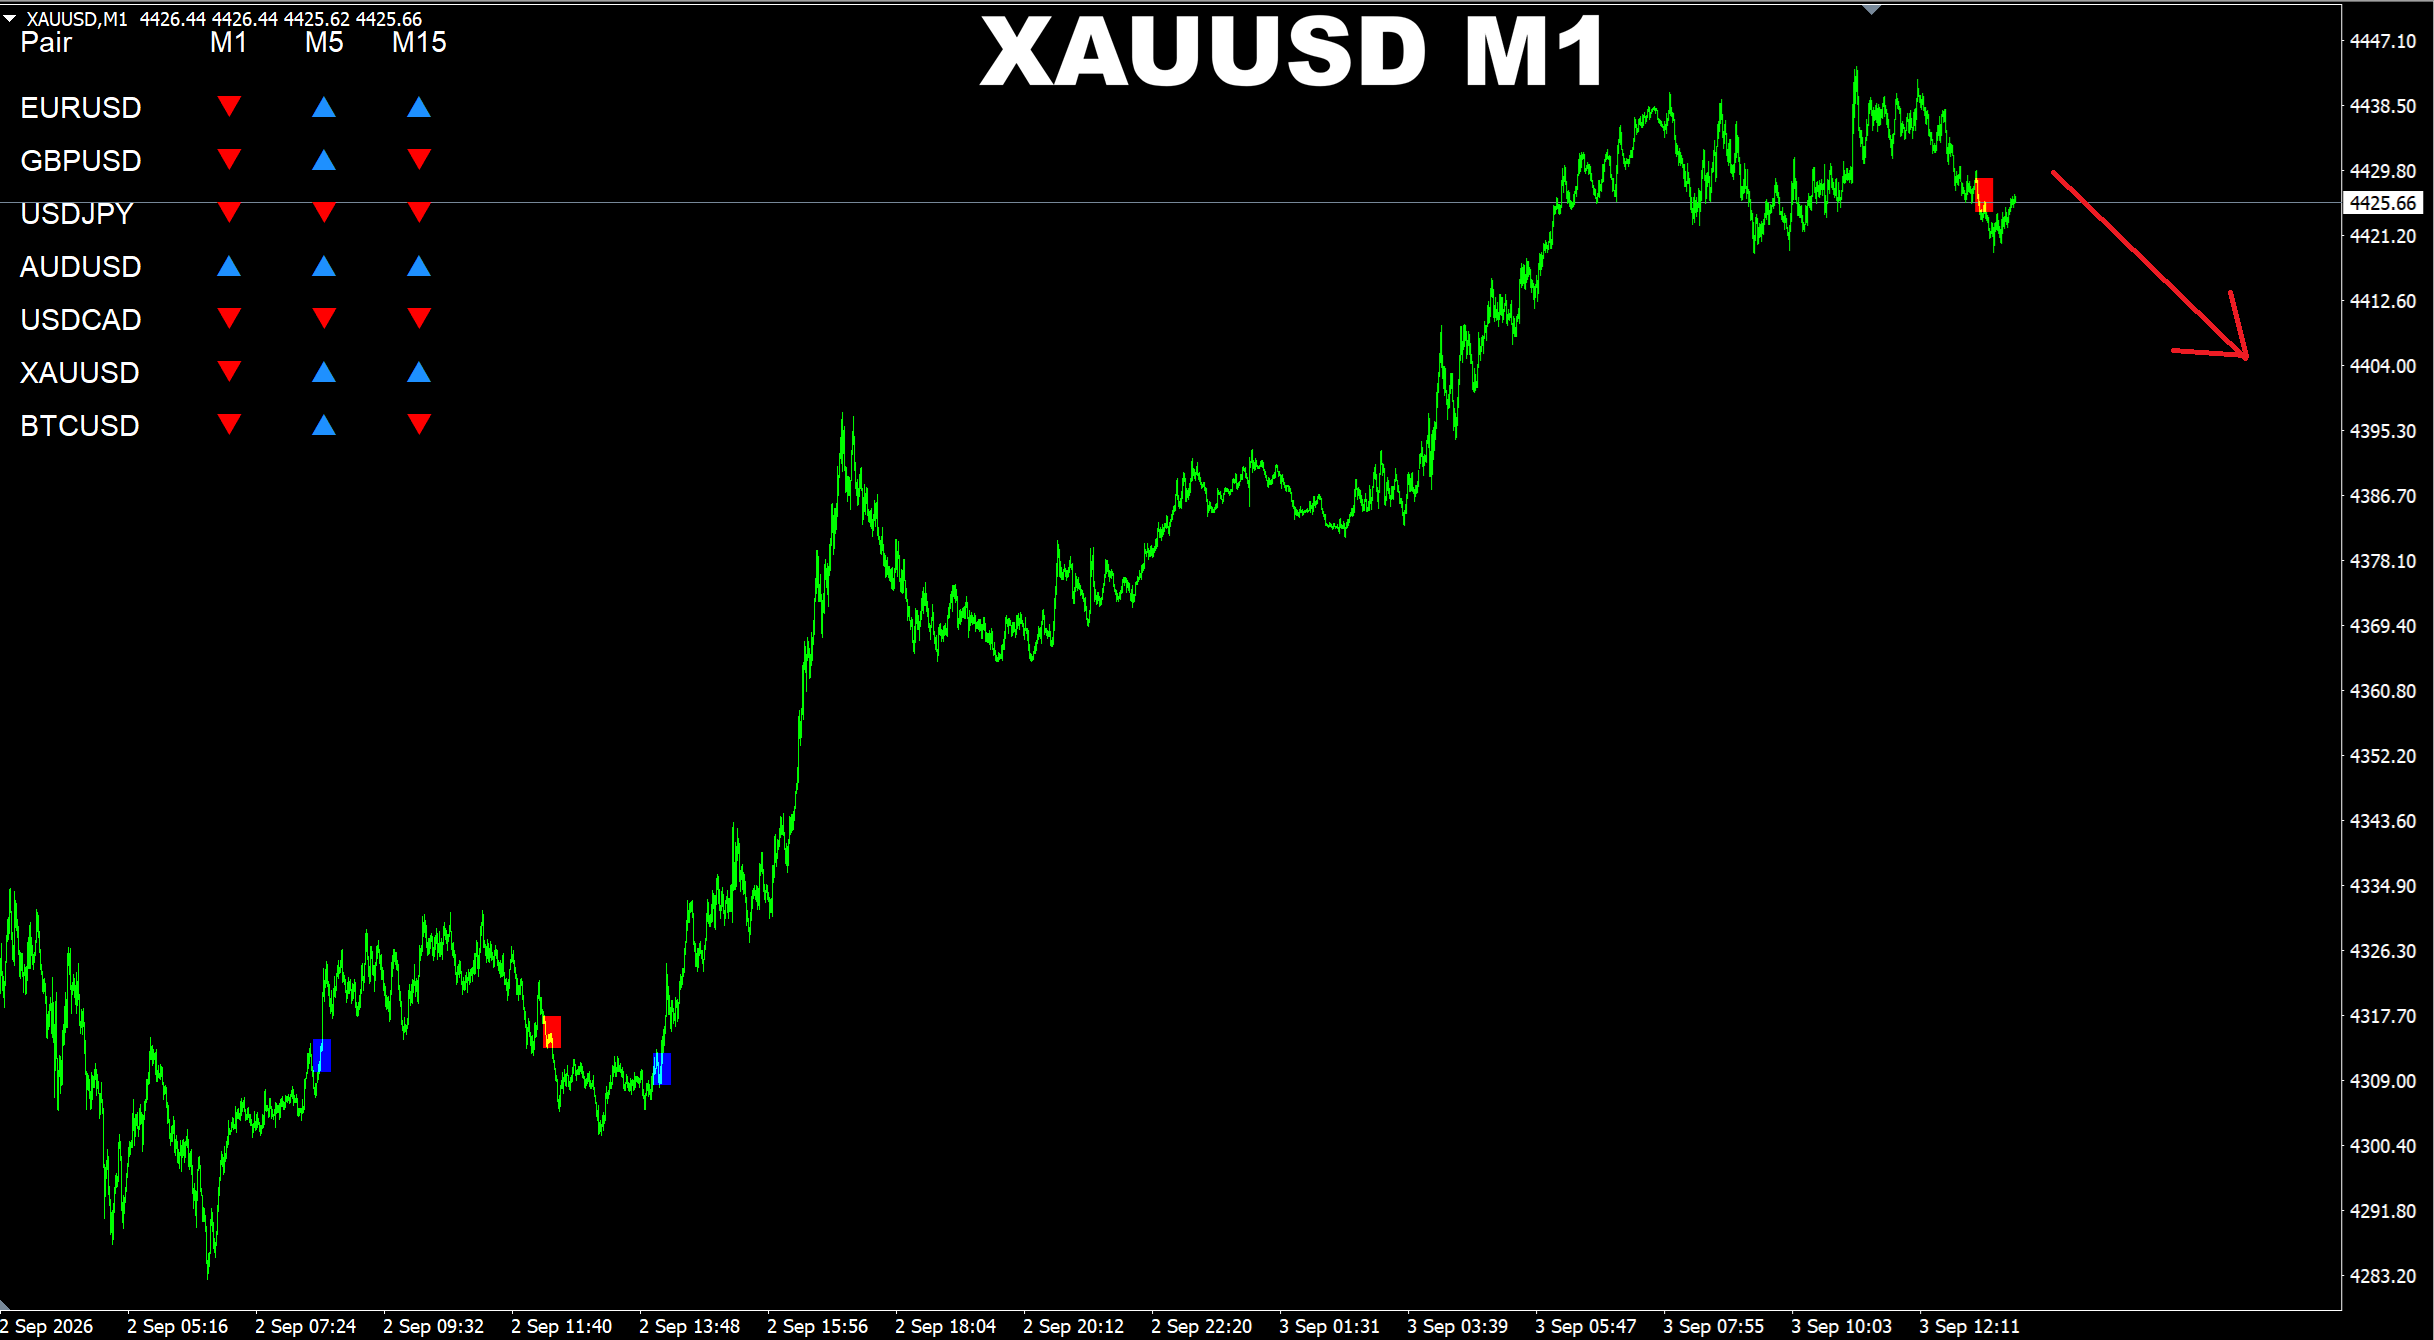
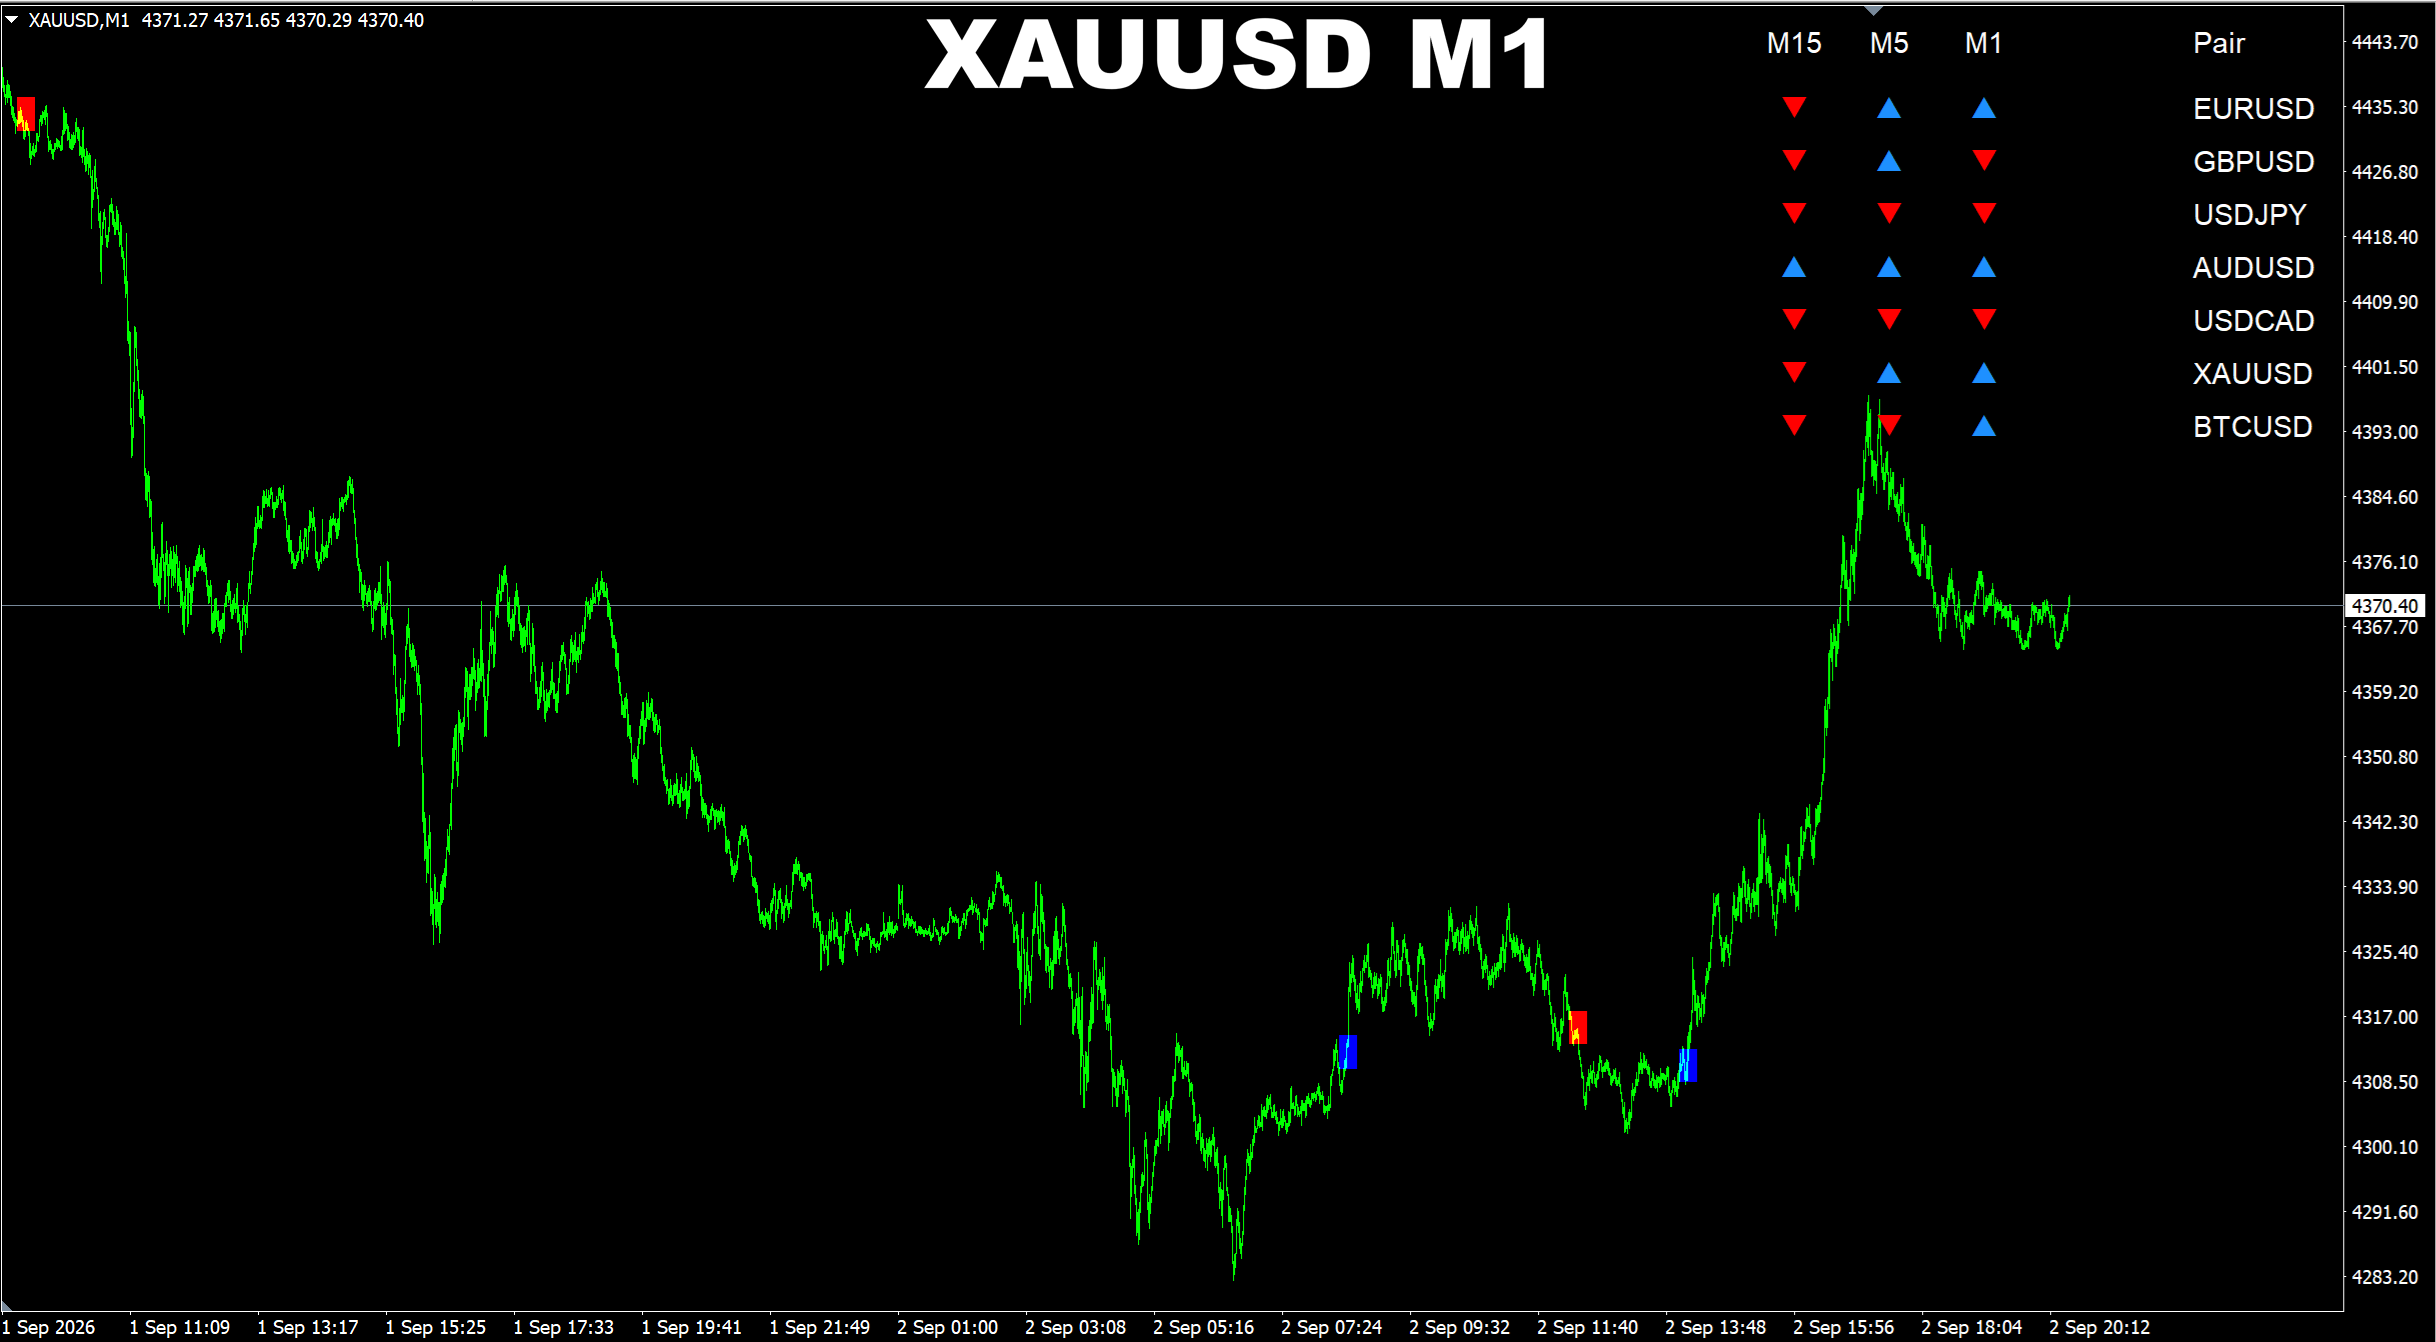
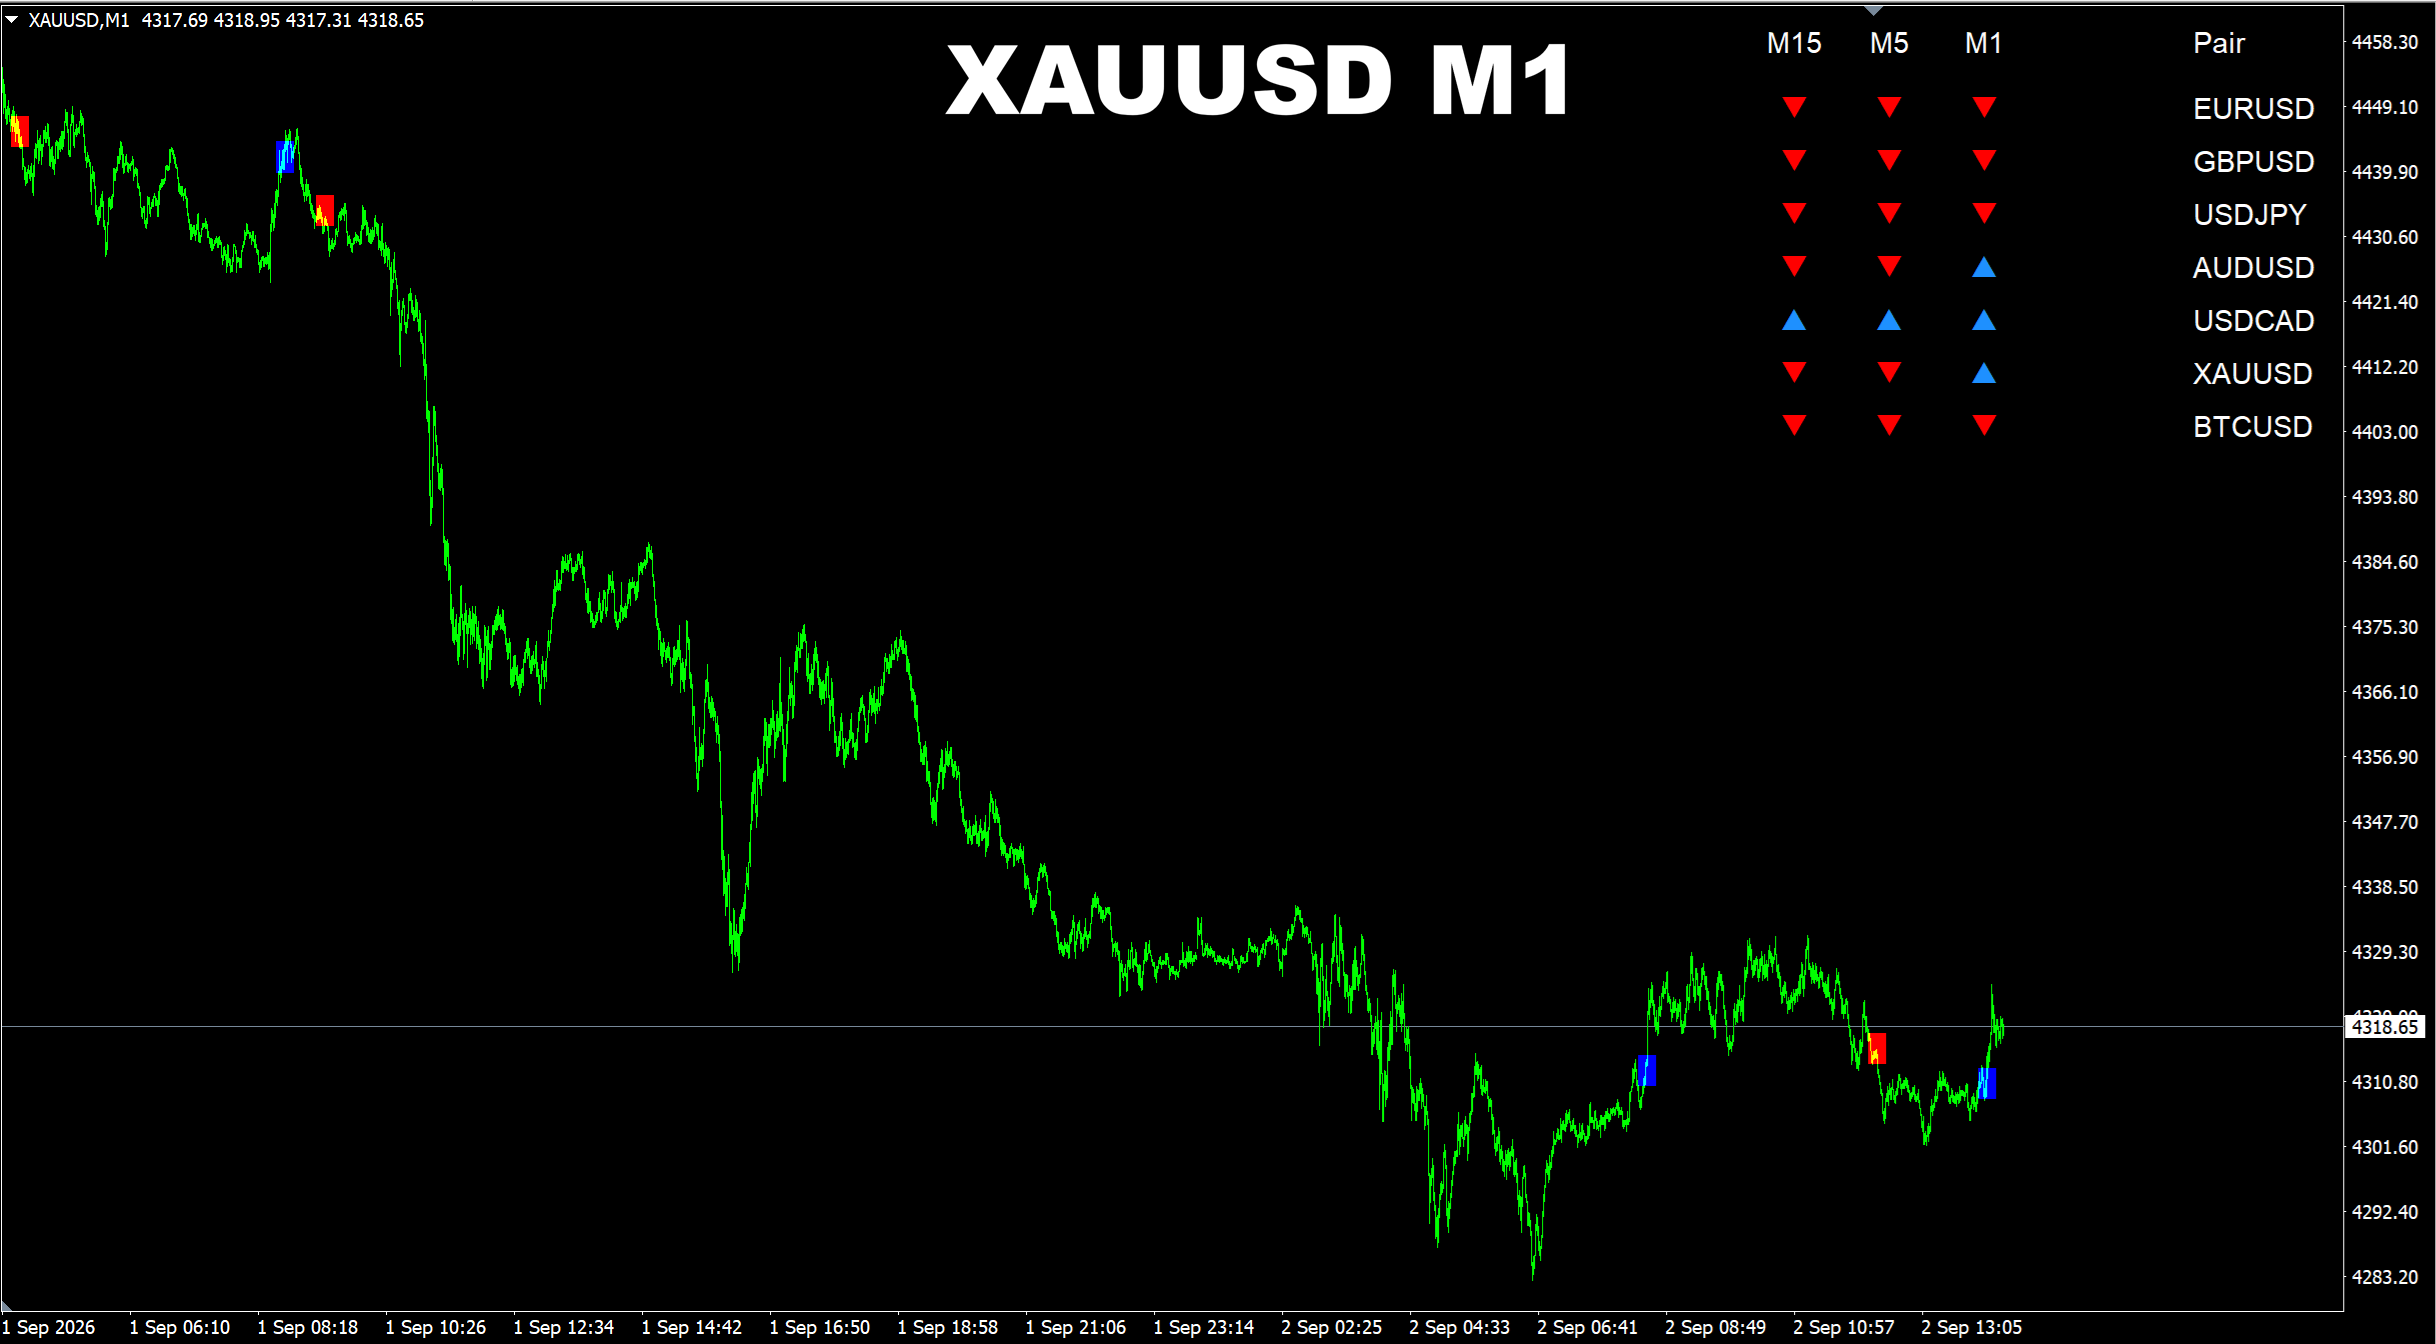
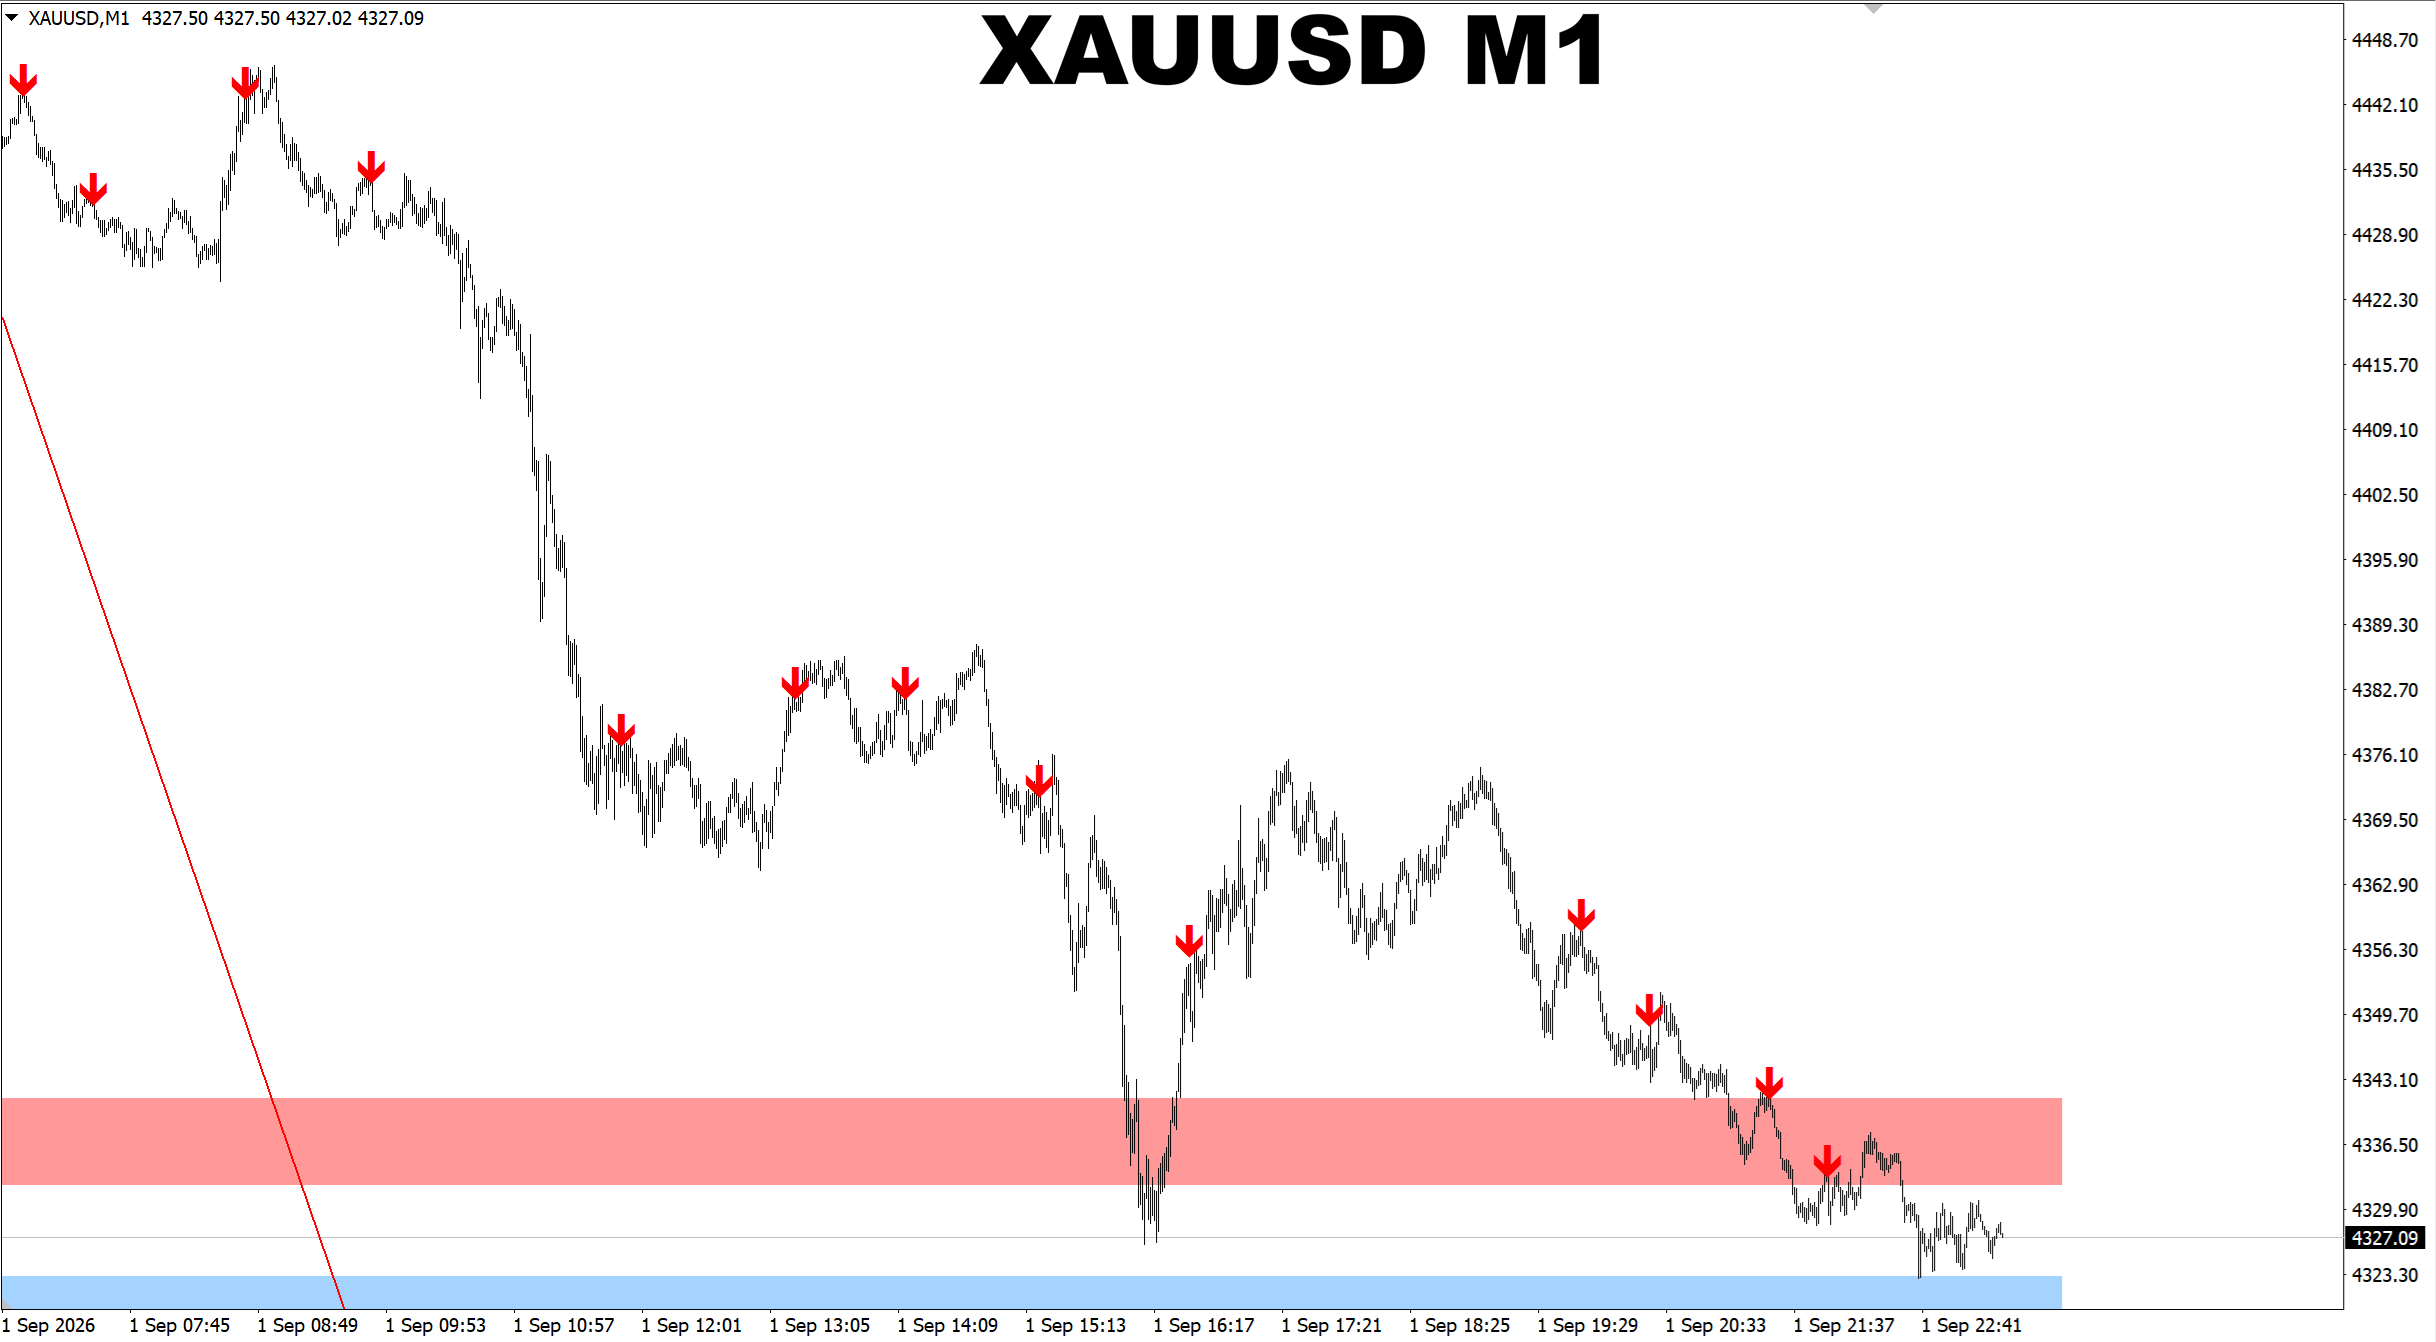
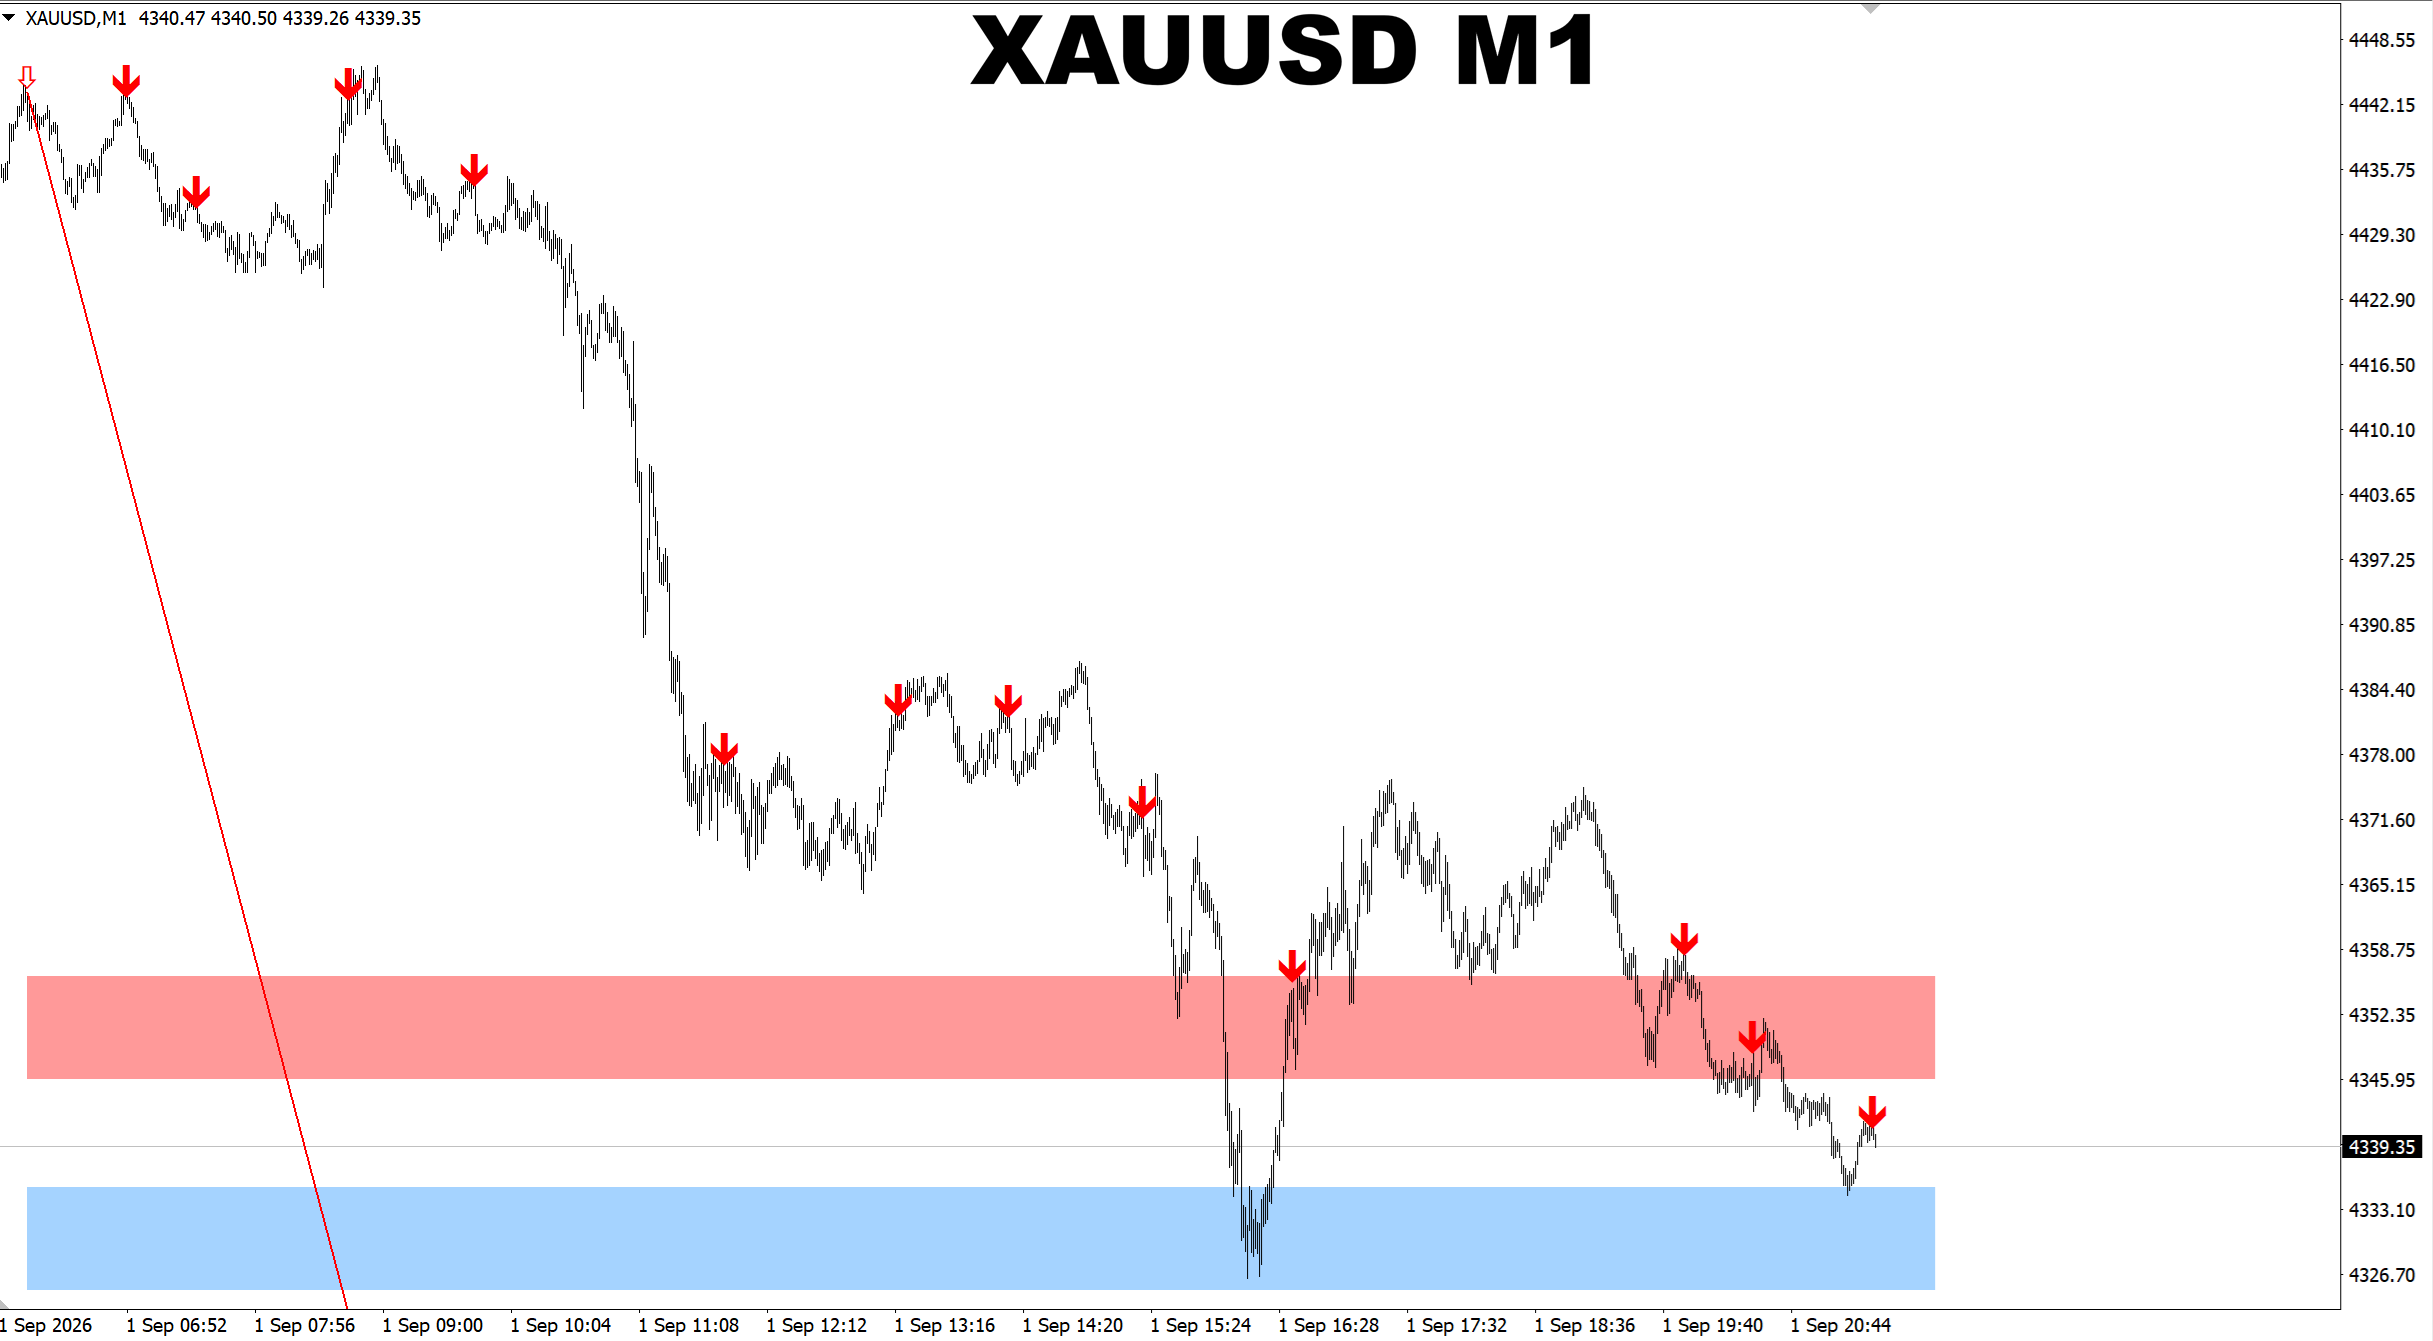
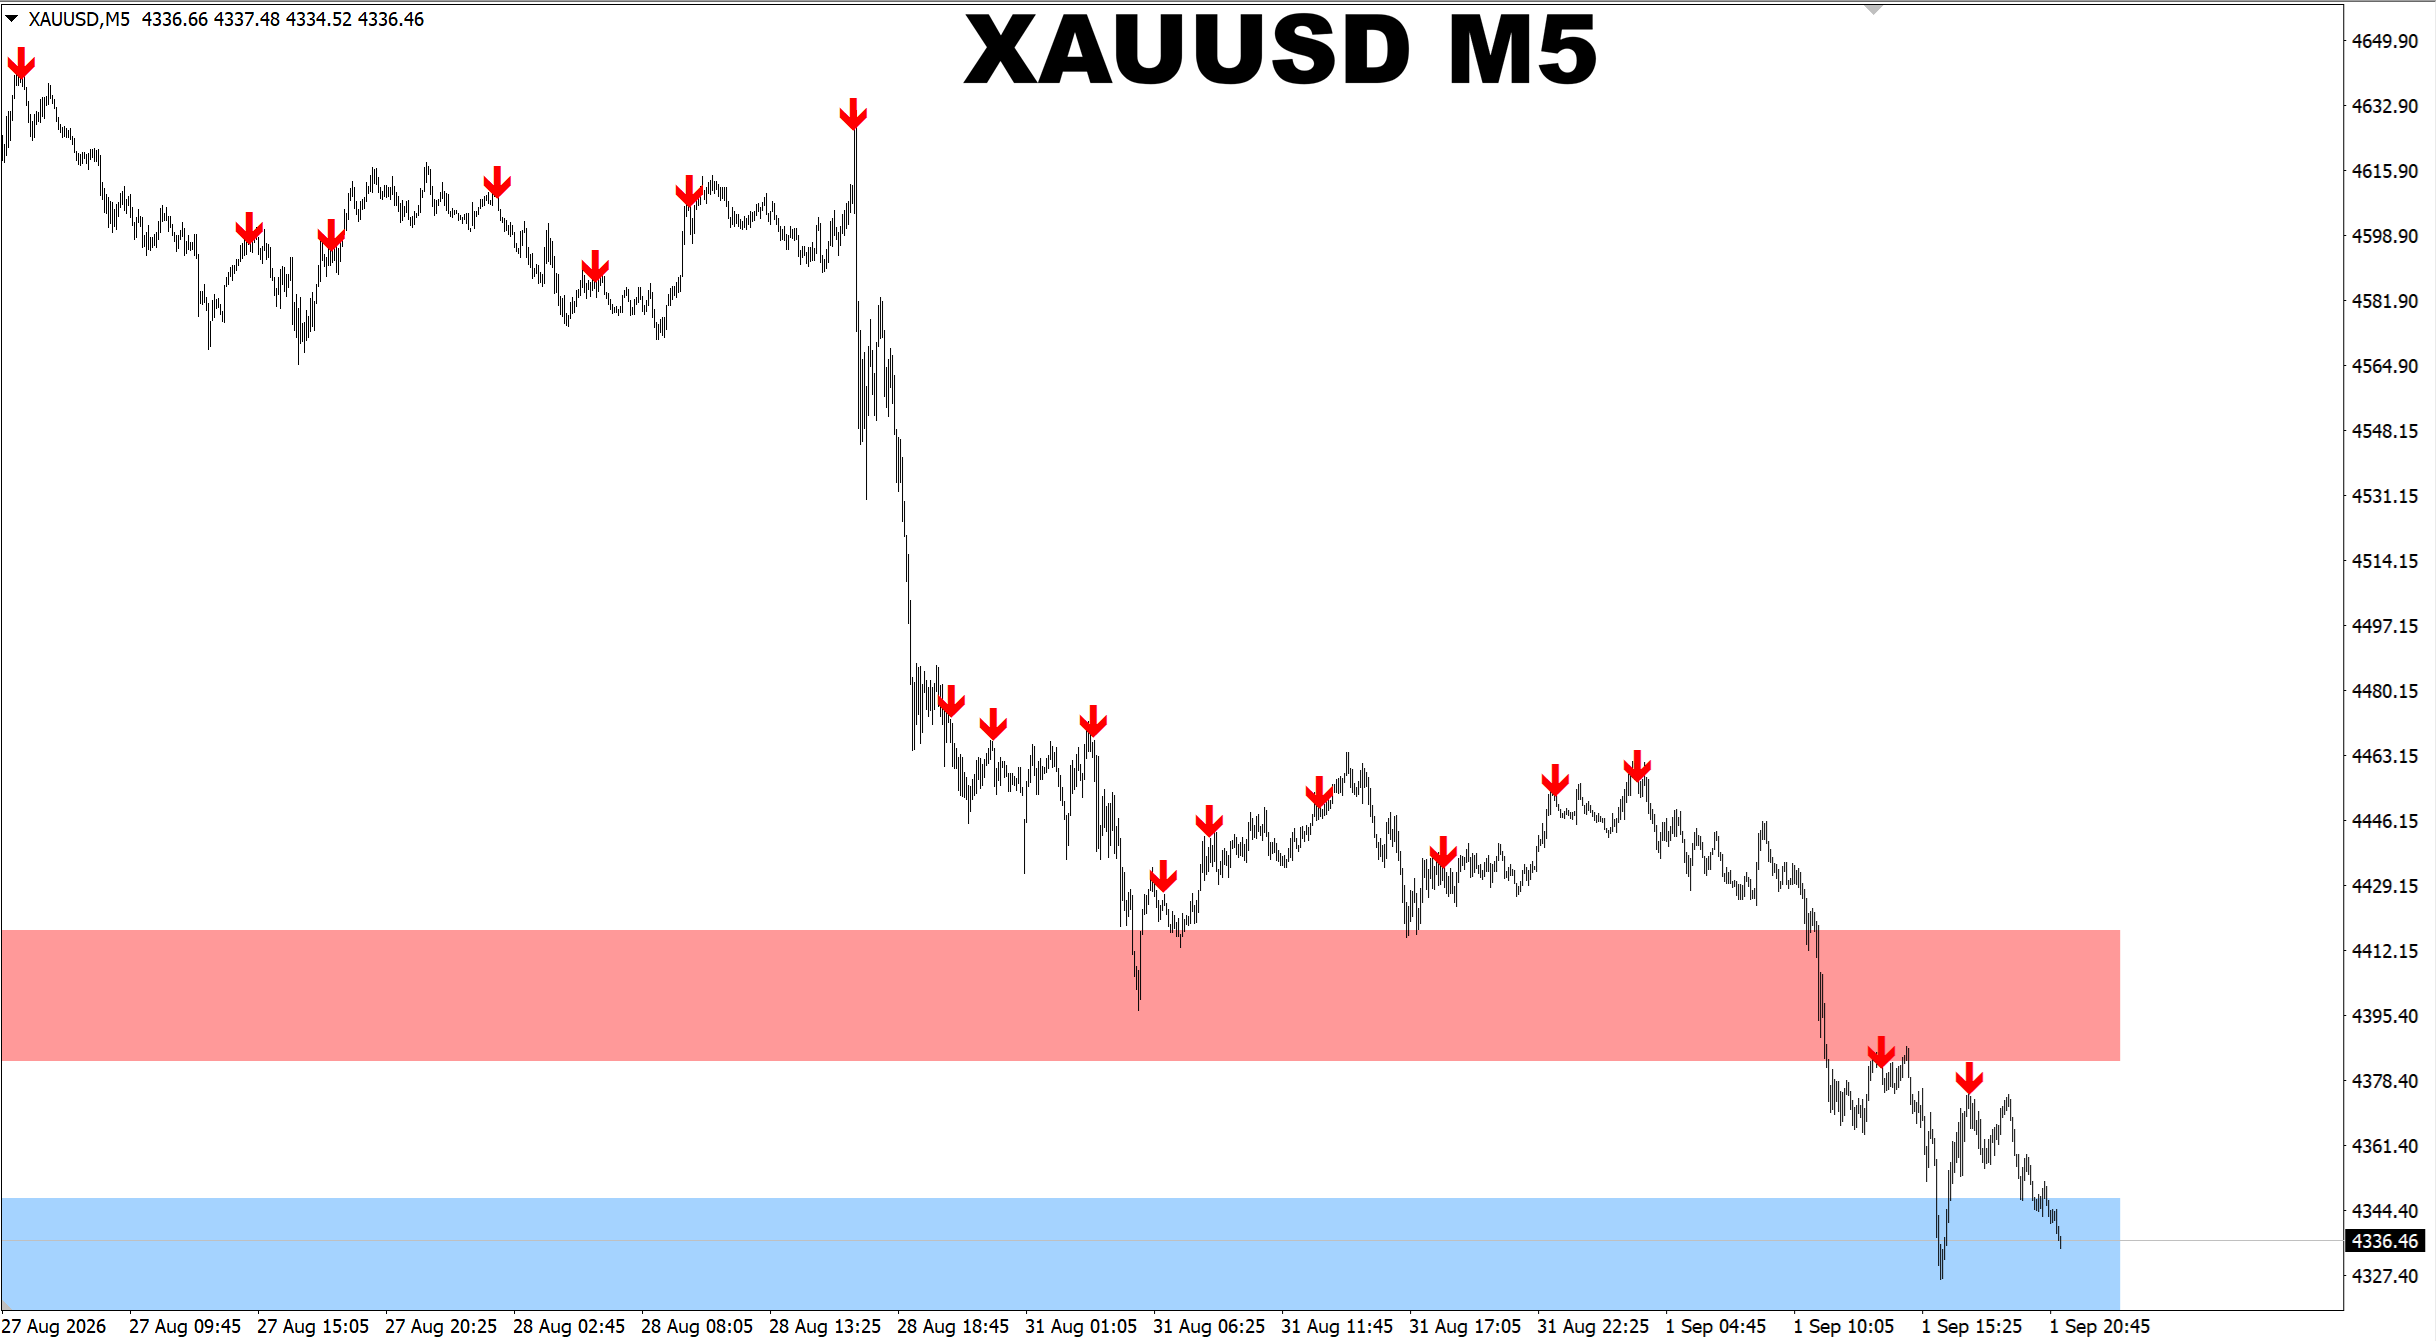
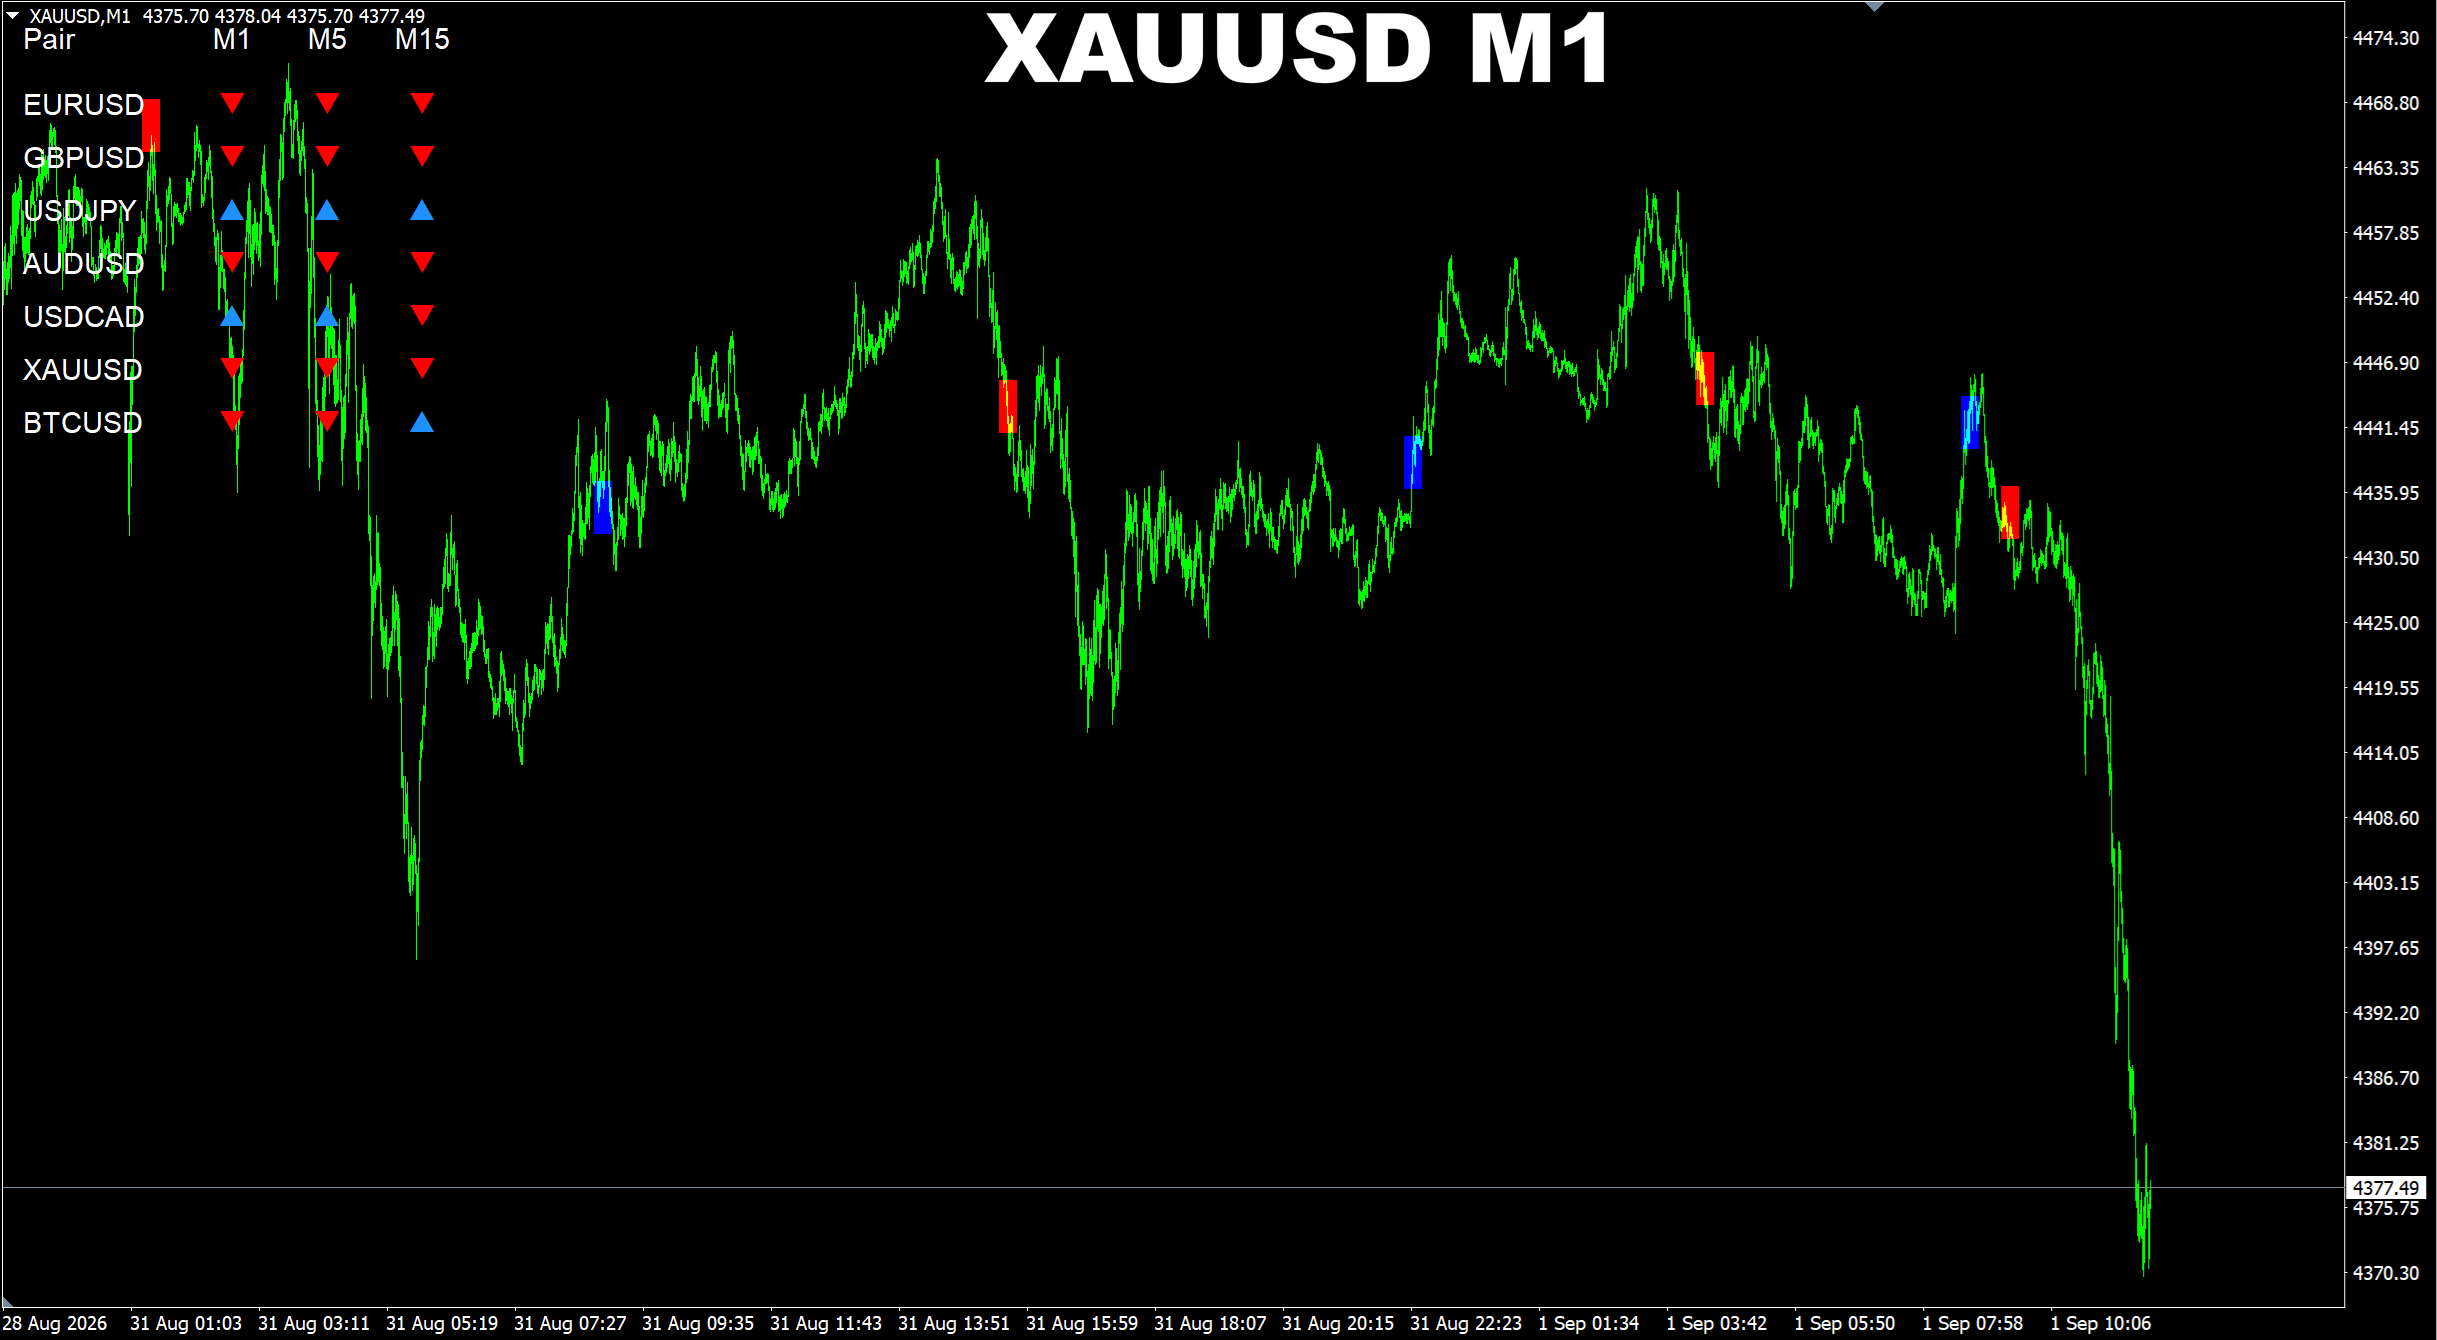
SR Liquidity. XAUUSD M1. Default settings. Recent signals performance. By the way, recently I've added a special multi-pair scanner which can scan any pair and time frame you wish. In this case you can see what signals you have on this or that pair without any need to have a separate chart for this purpose.
: