Trading the News: Canada Consumer Price Index (CPI) (based on dailyfx article ) Signs of softer-than-expected inflation may push the BoC to the sidelines as ‘very strong growth of the first quarter
S&P 500 - intra-day bullish breakout; 2,476 is the key (based on the article ) H4 intra-day price was bounced from Senlou Span line of Ichimoku indicator to above for the bullish area of the chart
Intra-Day Fundamentals - EUR/USD, USD/JPY, Dollar Index and Bitcoin/USD: Philadelphia Fed Business Outlook Survey 2017-07-20 13:30 GMT | [USD - Philly Fed Manufacturing Index ] past data is 27.6
EUR/USD Intra-Day Fundamentals : ECB Minimum Bid Rate and range price movement 2017-07-20 12:45 GMT | [EUR - Minimum Bid Rate ] past data is 0.00%, forecast data is 0.00%, actual data is n/a
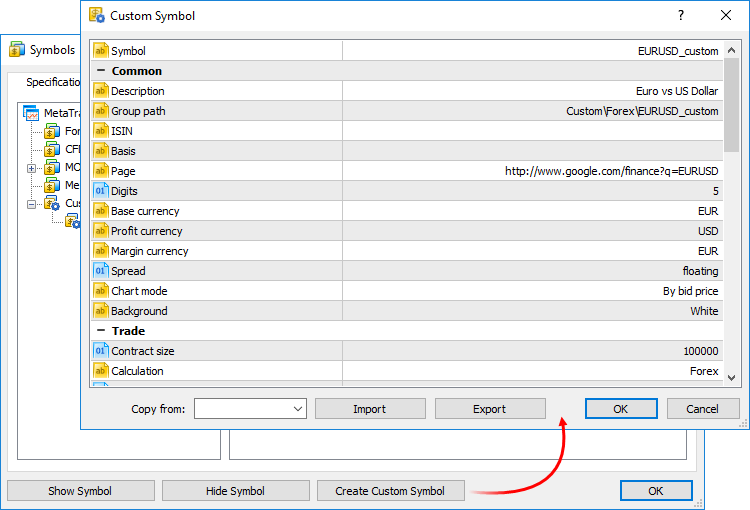
New MetaTrader 5 Platform Build 1640: Creating and testing custom symbols MetaTrader 5 platform update is to be released on July 21, 2017. The update will feature the following changes: Terminal: Now it is possible to create custom financial
Dollar Index - long term breakdown to correction (based on the article ) The price on monthly chart is located above Ichimoku cloud in the bullish area of the chart. The price is on secondary
Weekly Fundamental Forecast for S&P 500 (based on the article ) S&P 500 - "The market moved to a new record close on Friday. How do we trade a market which just broke out to new all-time highs
Weekly Outlook: 2017, July 16 - July 23 (based on the article ) The US dollar was on the back foot on political and mostly monetary issues. Is this just a setback or can we expect further falls? The
Intra-Day Fundamentals - AUD/USD, USD/CNH and GOLD (XAU/USD): Retail Sales 2017-07-14 13:30 GMT | [USD - Retail Sales ] past data is 0.1%, forecast data is 0.1%, actual data is -0.2% according to the
USD/JPY - weekly bullish reversal; 114.17 is the key (based on the article ) Weekly price was bounced from 108.81 support level to above to be reversed to the primary bullish market condition: the
Intra-Day Fundamentals - EUR/USD, GBP/USD and Dollar Index: Producer Price Index 2017-07-13 13:30 GMT | [USD - PPI ] past data is 0.0%, forecast data is 0.0%, actual data is 0.1% according to the
NZD/USD - daily ranging bullish; 0.7344 is the key (based on the article ) Daily price is above 100 SMA/200 SMA levels located in the bullish area of the chart: the price is testing 0.7309 resistance
USD/CAD Intra-Day Fundamentals: Bank of Canada Overnight Rate and range price movement 2017-07-12 15:00 GMT | [CAD - Overnight Rate] past data is 0.50%, forecast data is 0.75%, actual data is 0.75%
Cross-Platform Expert Advisor: Money Management Table of Contents Introduction , Objectives , Base Class , Money Management Classes and Types , Container for Money Management Objects , Example
Crude Oil - daily rally; 49.15 is the key (based on the article ) Brent Crude Oil price on daily chart is on the local uptrend as the secondary rally to be started by 48.28 resistance level breaking
Good article - related to the Digital Filters: Forecasting market movements using the Bayesian classification and indicators based on Singular Spectrum Analysis One promising way to achieve this is
This is very interesting indicator: price crossing Kijun-sen. Indicator is on this post to download, or you can find it attached to this post. All kinds of alert are available: Kijun-sen is one of