Guad Bibar
Guad Bibar
5 (1)
  • 정보
1 년도
경험
8
제품
18
데모 버전
0
작업
0
거래 신호
0
구독자
Founder & MQL4/MQL5 Developer 에 Quantum Labs
Quantum Labs | MetaTrader tools with clear rules

I develop MQL4/MQL5 indicators, Expert Advisors and utilities, with a focus on chart analysis, configurable trading logic and practical dashboards.

Choosing a product
Start with the task you need to solve: visual chart context, signal analysis or automated execution. Check the platform, inputs, limitations and screenshots on each product page. For paid products, evaluate the Market demo in the Strategy Tester before purchasing.

Setup and support
Use the product Comments tab or contact JojoBar through MQL5 messages. Include the product name and version, MetaTrader build, symbol, timeframe, settings and steps to reproduce the issue. Remove account numbers and other private information from screenshots.

Custom development
For a custom MT4/MT5 project, define the entry and exit rules, risk limits and acceptance checks in an MQL5 Freelance specification. Scope and testing requirements are agreed before work begins.

Trading involves risk. Indicators and automated strategies do not guarantee profits; historical examples are not promises of future results.
Guad Bibar 출시돈 제품

Northstar Flow Arrow Trader MT5 is an Expert Advisor for traders who want to evaluate automated entries and position management based on the Northstar Flow approach. This is an automated trading tool. Review the direction, fixed volume, filters and exit settings in the Strategy Tester before allowing it to trade a demo account. Configuration areas Flow signal settings: EMA, ATR, ADX, candle-body, breakout and signal-spacing inputs. Optional range/choppiness, higher-timeframe Ichimoku and

Guad Bibar
Guad Bibar
Northstar Fair Value Gap Signals MT5 is now available in the MQL5 Market.

A visual, rule-based indicator for traders who want a more structured way to review Fair Value Gap retests:

• confirmed three-candle FVG zones
• buy and sell arrows only after an enabled reversal pattern confirms the retest
• optional Ichimoku context for directional alignment
• closed-bar calculations, with no automated trade execution

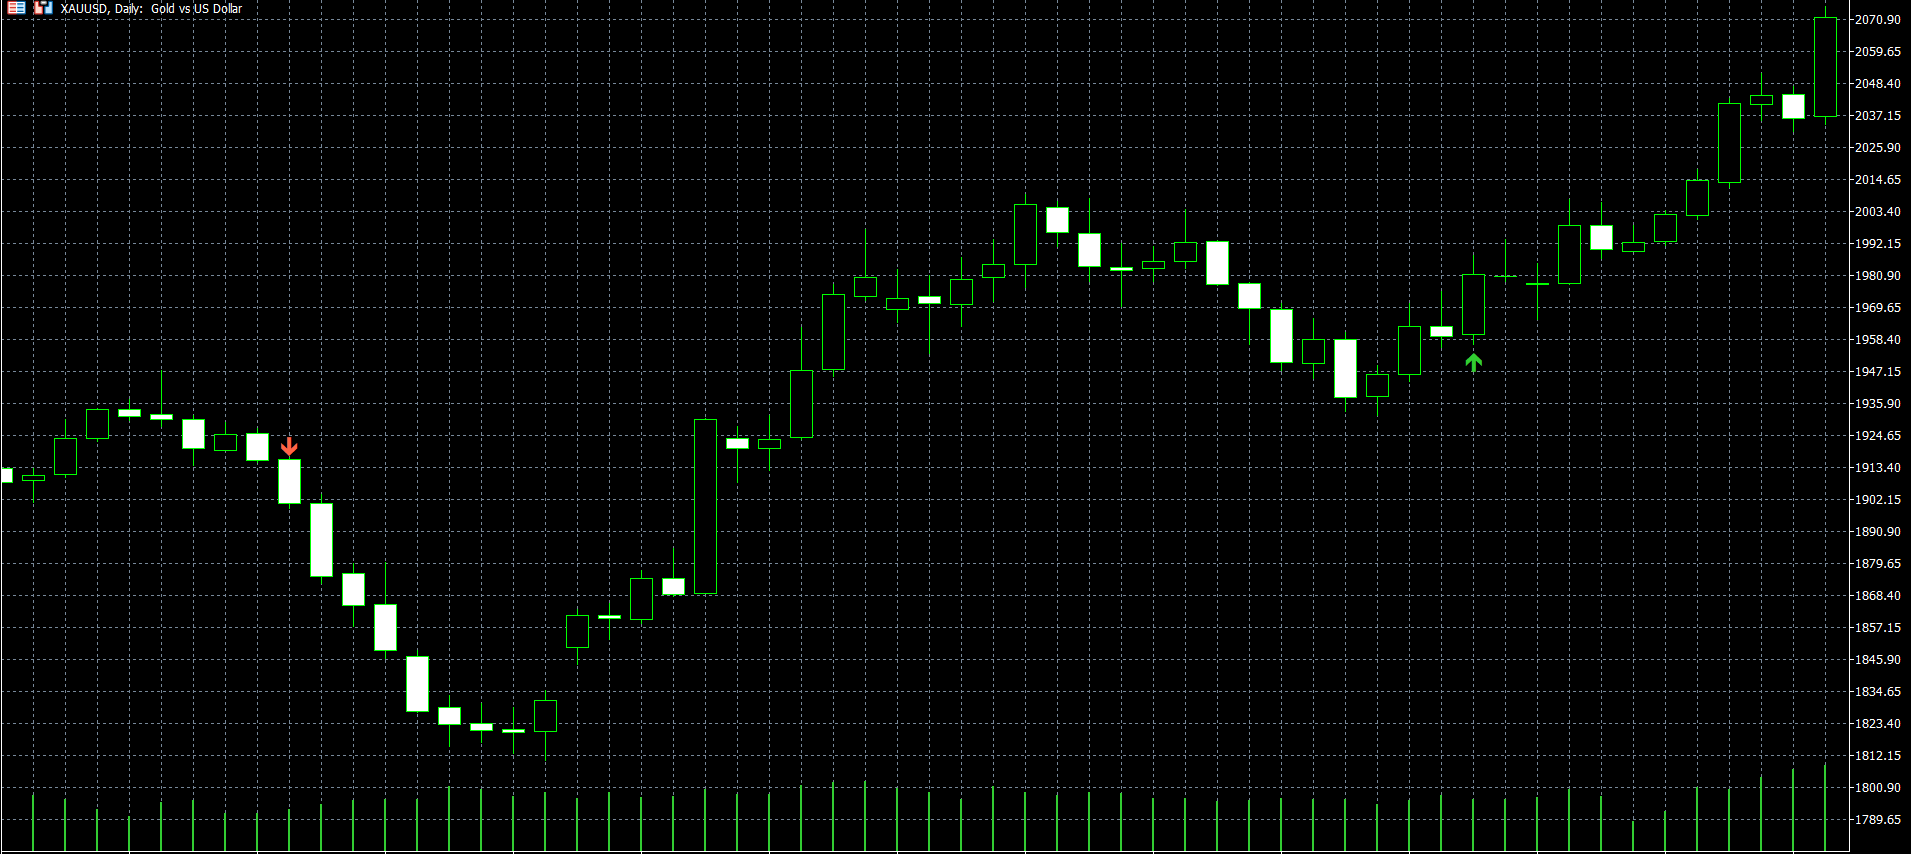
The attached XAUUSD Daily chart is an example of a completed bullish marker. It is provided for chart-analysis illustration only—not as a trade recommendation or a promise of results.

View the product:
https://www.mql5.com/en/market/product/192033?source=Site+Profile
Guad Bibar 출시돈 제품

Northstar Flow Candles MT5 is a free chart indicator for traders who use Heikin Ashi candles to review trend context. Its purpose is visual analysis, with candle states and optional markers on the MetaTrader 5 chart. This is a visual tool. It does not place trades or provide popup, push or email notifications. Chart context Five candle states: strong bullish, bullish, balanced, bearish and strong bearish. Context settings based on fast and slow exponential moving averages, ADX and

Guad Bibar
Guad Bibar
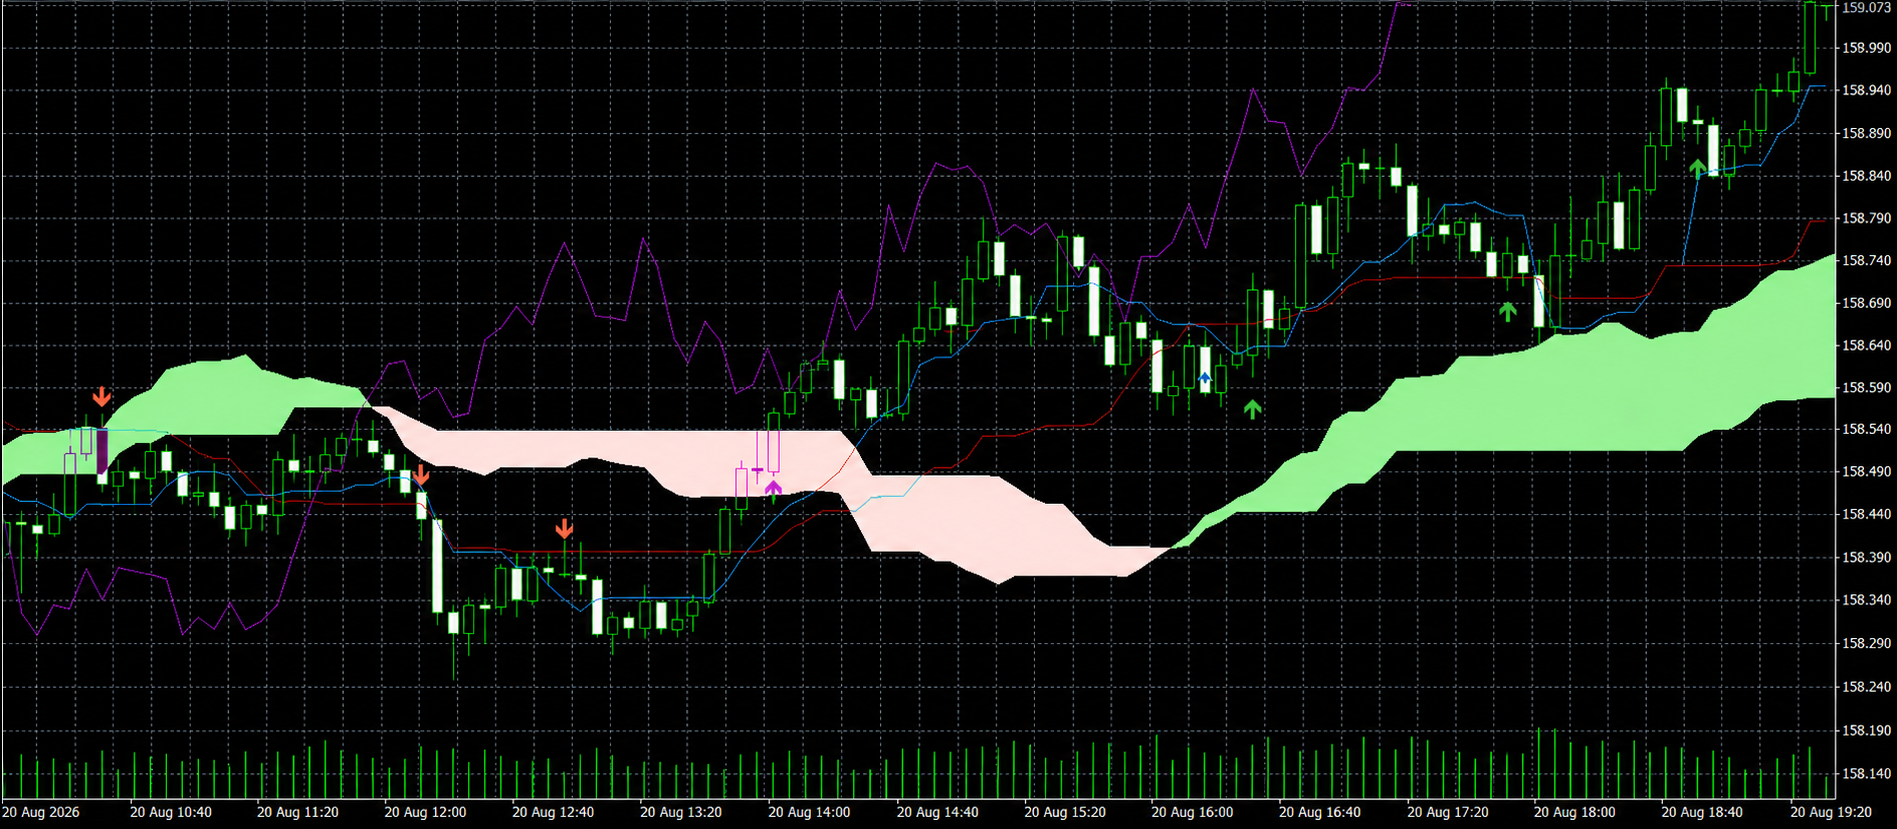
Kumo Confluence Signals MT5 is now available on the MQL5 Market.

It is a chart-window Ichimoku indicator that displays BUY and SELL arrows after a candle has closed. Signals use Tenkan/Kijun alignment, Kumo structure, Chikou clearance and configurable confluence filters.

Choose Balanced, Elite or Active quality settings, and select the entry events to evaluate: Tenkan/Kijun crosses, Kijun retests, Kumo breakouts or all events.

The indicator is for chart analysis only. It does not open, close or manage trades. Trade selection, stop placement, position size and risk management remain the trader's responsibility.

https://www.mql5.com/en/market/product/191624
Guad Bibar
Guad Bibar
**Regime Structure Pro MT5 | Live XAUUSD Trade Example**

A real **XAUUSD M5 trade** from my own trading account while using Regime Structure Pro 3.0 for market analysis.

At the time shown, the dashboard was identifying:

• **UPTREND / CONFIRMED** market regime
• **M15 BULLISH / ALIGNED** higher-timeframe context
• Bullish price action with a confirmed **BULL BOS**
• **CONTINUATION / POST-BREAK** reaction state
• Liquidity, order blocks, FVGs and structural levels mapped directly on the chart
• Primary and alternative scenarios based on similar historical conditions

What I like about this example is that the indicator is not simply displaying an entry arrow.

It is showing the **market environment behind the trade** — regime, direction, structure, higher-timeframe context, liquidity and the current interaction with important levels.

The position shown was entered and managed manually. Regime Structure Pro is an analytical indicator and does not automatically open or manage trades.

Displayed percentages are conditional estimates from similar historical conditions and are not profit probabilities or guarantees of future performance.

**Regime Structure Pro MT5 — Version 3.0**

https://www.mql5.com/en/market/product/188559
Guad Bibar
Guad Bibar
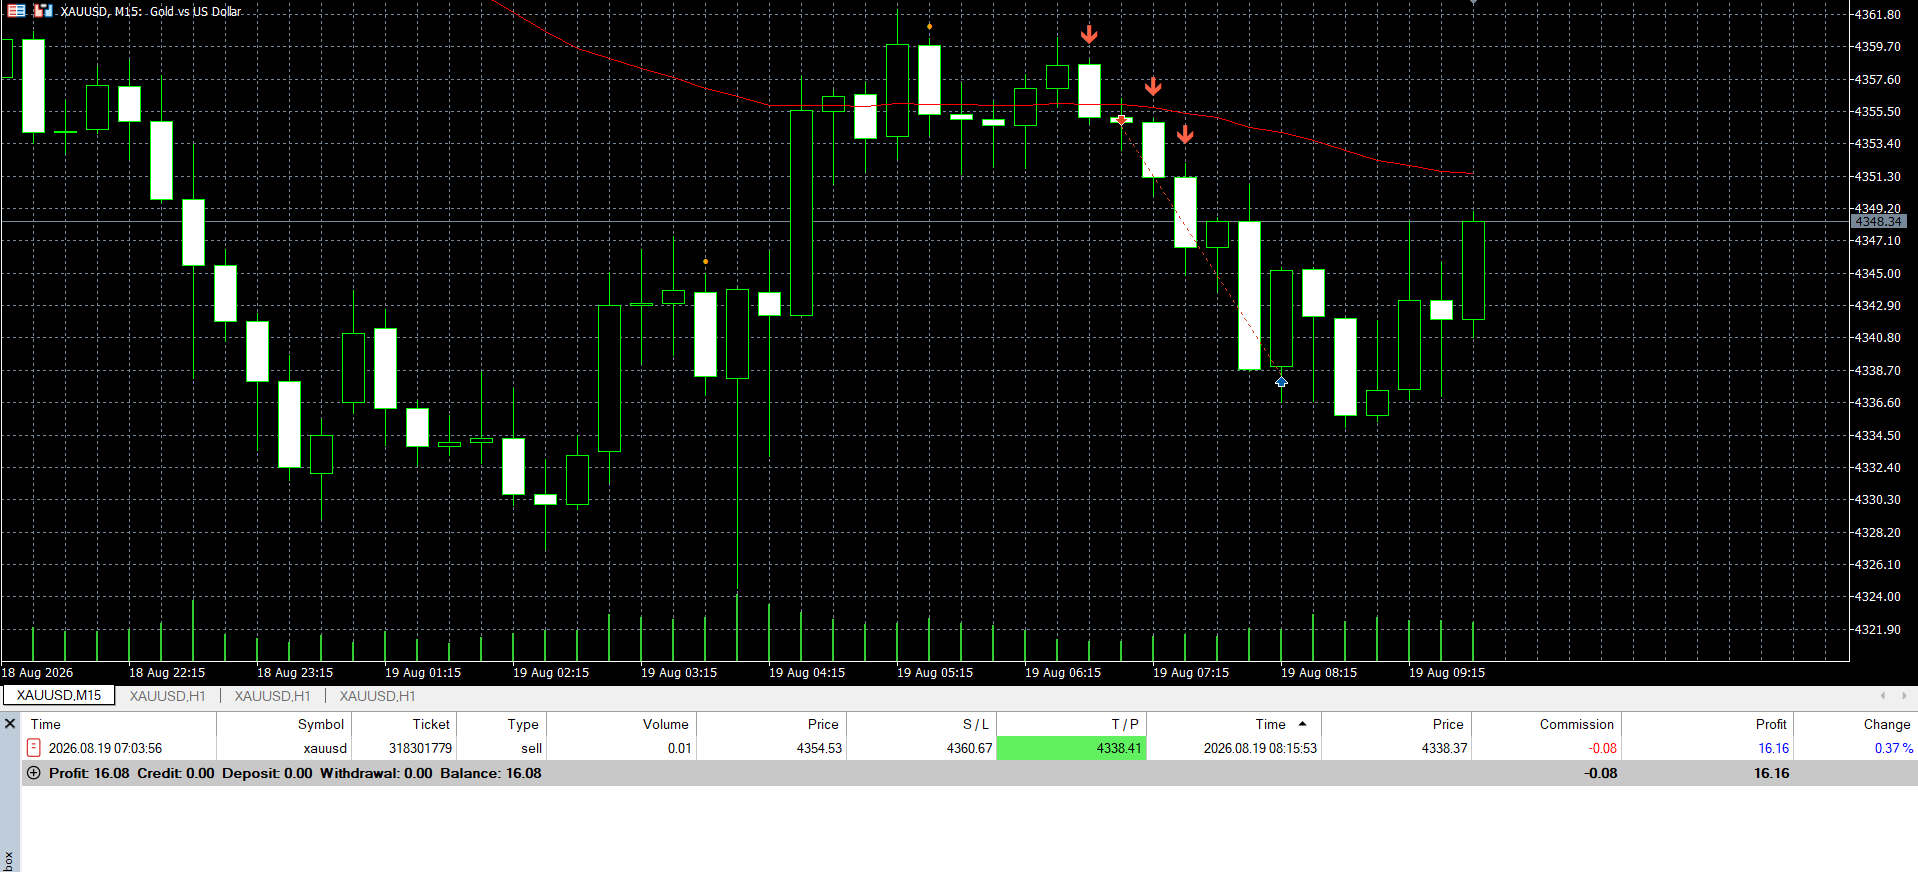
**Real XAUUSD Trade — Multiple Signal Confluence**

A real **XAUUSD M15 trade** from my own trading account.

For this setup, I wasn't relying on a single signal. I used confirmation from multiple indicators in my trading toolkit, including:

**Trend Candle Confirmation MT5**
Trend + pullback + closed-candle confirmation
https://www.mql5.com/en/market/product/190678

**Tethys Pullback Compass**
Selective trend-continuation signals after a confirmed pullback
https://www.mql5.com/en/market/product/190730

The idea is simple: **look for confluence instead of blindly following one arrow.**

The trade was entered and managed manually. The indicators are analytical tools and do not open or manage trades automatically.

The screenshot shows the actual closed trade in MT5 History. One trade is not evidence of future performance, and results are never guaranteed.
Guad Bibar
Guad Bibar
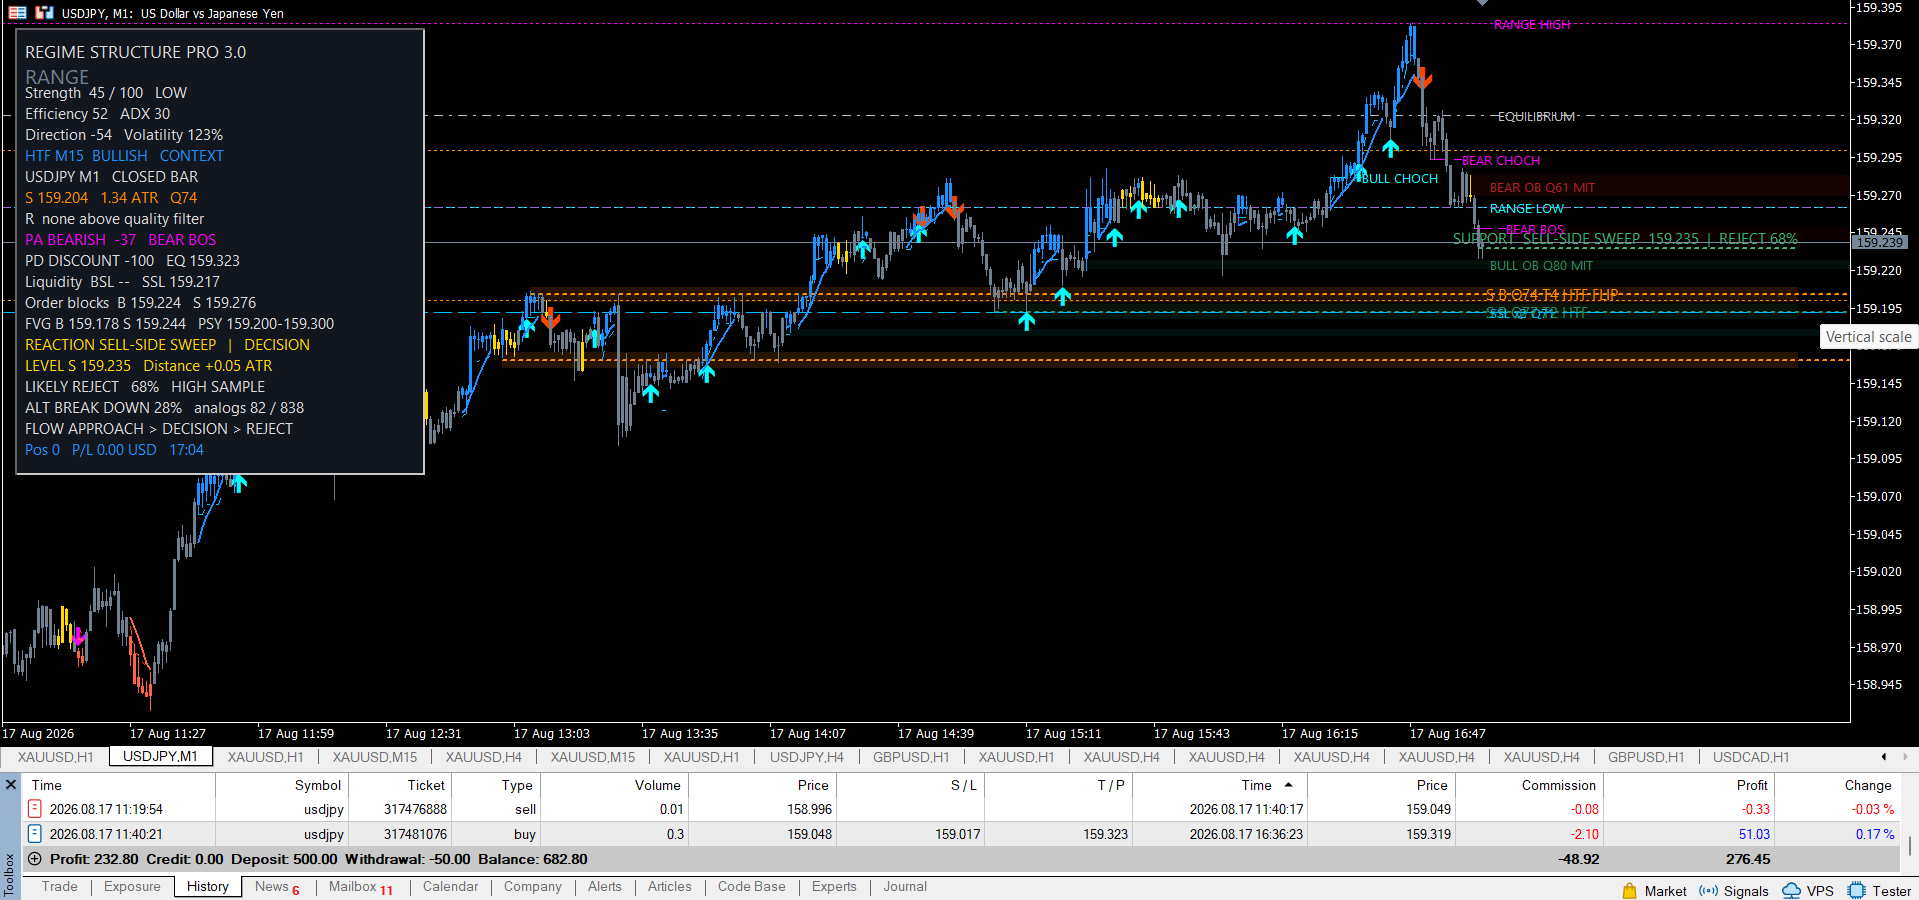
**The market changed. The analysis changed with it.**

Here is Regime Structure Pro 3.0 running on **USDJPY M1** in live market conditions.

After the earlier bullish expansion, the dashboard is now detecting a **RANGE** environment while keeping the broader M15 bullish context visible.

Current structure on the chart:

• RANGE regime detected
• M15 bullish higher-timeframe context
• Bearish short-term price action + Bear BOS
• Sell-side liquidity sweep identified
• Order blocks, FVGs and liquidity mapped automatically
• Reaction state: **SELL-SIDE SWEEP | DECISION**
• Conditional rejection scenario based on historical analogs

The purpose of Regime Structure Pro is not to force a signal on every candle.

It is designed to show **what type of market you are actually trading** — trend, transition, range, structure breaks, liquidity reactions and decision zones — all from one dashboard.

Live-market example for demonstration only. Historical/conditional statistics are not guarantees of future results.

**Regime Structure Pro MT5 — Version 3.0**

https://www.mql5.com/en/market/product/188559
Guad Bibar
Guad Bibar
**Regime Structure Pro MT5 — Live USDJPY Market Analysis**

A real-time example of **Regime Structure Pro 3.0** analyzing USDJPY M5.

The indicator identified the developing bullish regime and mapped the transition directly on the chart:

• **UPTREND / EARLY** regime
• M15 higher-timeframe **bullish alignment**
• Bullish **CHOCH → BOS → continuation**
• Dynamic support and resistance zones
• Liquidity, order blocks and FVG context
• Reaction state: **CONTINUATION / POST-BREAK**
• Alternative scenario and market-structure invalidation levels

Instead of relying on one arrow or signal, Regime Structure Pro brings multiple layers of market context together into one structured dashboard.

This screenshot is from live market conditions and is shown for demonstration purposes only. It does not guarantee future performance or profitability.

**Regime Structure Pro MT5 — Version 3.0**

https://www.mql5.com/en/market/product/188559
Guad Bibar
Guad Bibar
🧭 **ONE MARKET. TWO DIRECTIONS. ONE SYSTEMATIC APPROACH.**

Look at this historical **XAUUSD Daily chart**.

On the left:

🔴 **Bearish continuation setup**

Price subsequently continued significantly lower.

Later, market conditions changed.

On the right:

🟢 **Bullish continuation setup**

Price then developed into a strong upward move.

This is exactly why I built **Tethys Pullback Compass for MT5**.

The indicator isn't permanently bullish.

It isn't permanently bearish.

It evaluates the market conditions in front of it and looks for trend-aligned pullbacks followed by confirmation.

### 🧭 THE PROCESS

**TREND → PULLBACK → CONFIRMATION → SIGNAL**

🔴 Bearish conditions + qualifying pullback + confirmation
→ Potential bearish continuation setup

🟢 Bullish conditions + qualifying pullback + confirmation
→ Potential bullish continuation setup

No qualifying setup?

**No signal.**

━━━━━━━━━━━━━━━━━━━━

### ⚡ WHY TETHYS?

✅ Bullish & bearish continuation signals
✅ Pullback-focused entry analysis
✅ Completed-candle confirmation
✅ Trend-health filtering
✅ Anti-range filtering
✅ Historical signals visible directly on the chart
✅ Adjustable parameters
✅ Optional MT5 alerts
✅ Designed for multiple symbols and timeframes

The objective isn't to predict every market turn.

It's to help answer a much more practical question:

**“The market is trending — has a pullback now produced a setup worth paying attention to?”**

━━━━━━━━━━━━━━━━━━━━

📊 Screenshot: **XAUUSD — Daily timeframe**

This is a historical chart example provided to demonstrate how the indicator displays its signals.

🧭 **TETHYS PULLBACK COMPASS — MT5**

👇 **VIEW / TRY DEMO / BUY ON MQL5:**

https://www.mql5.com/en/market/product/190730?source=Site+Profile

**Don't marry a direction.
Read the trend.
Wait for the pullback.
Let confirmation do the filtering. 🧭**

Try the demo on the symbols and timeframes you actually trade and evaluate the signals for yourself.

*Technical analysis tool only. Historical examples do not guarantee future results. Signals are analytical prompts and should be combined with appropriate risk management.*
Guad Bibar
Guad Bibar
📉 **GOOD TREND TRADING ISN'T ABOUT MORE SIGNALS. IT'S ABOUT BETTER LOCATIONS.**

Look closely at this **XAUUSD Daily chart**.

Gold moved into a significant bearish phase — but **Tethys Pullback Compass** didn't cover the chart with sell arrows.

It waited.

🔴 Pullback.
🔴 Confirmation.
🔴 Bearish continuation setup.

Then it waited again.

That's exactly what **Tethys Pullback Compass for MT5** was built to do.

Most traders see a strong move and feel pressure to chase it.

Tethys follows a different process:

**TREND → PULLBACK → CONFIRMATION → CONTINUATION**

Instead of producing an arrow just because price is moving, the indicator evaluates several conditions before highlighting a potential continuation setup.

🧭 **WHAT TETHYS LOOKS FOR**

✅ Directional trend context
✅ Pullback / retracement conditions
✅ Completed-candle confirmation
✅ Trend health
✅ Market directionality
✅ Anti-range filtering
✅ Controlled signal frequency

### 🔴 LOOK AT THE SCREENSHOT

This is **XAUUSD on the Daily timeframe**.

Only **two bearish signals** appear during this section of the move.

And that's important.

Tethys isn't designed to cover your chart with arrows just to make it look active.

**No qualifying setup = no signal.**

Sometimes the best signal is the one your indicator refuses to print.

━━━━━━━━━━━━━━━━━━━━

⚡ **TETHYS PULLBACK COMPASS — MT5**

✔ Closed-candle signals
✔ Bullish & bearish continuation setups
✔ Historical signals directly on the chart
✔ Adjustable pullback parameters
✔ Trend-health filtering
✔ Anti-range filtering
✔ Optional MT5 alerts
✔ Multiple symbols & timeframes
✔ Fully configurable

💰 **Available now on the MQL5 Market**

👇 **VIEW / BUY / TRY THE DEMO HERE:**

https://www.mql5.com/en/market/product/190730?source=Site+Profile

**Don't chase the trend.
Wait for the pullback.
Let confirmation do the filtering. 🧭**

Try it on the symbols and timeframes YOU trade and judge the historical signals for yourself.

*Tethys Pullback Compass is a technical analysis tool. Signals are analytical prompts and do not guarantee future trading results. Always use appropriate risk management.*
Guad Bibar
Guad Bibar
📉 **NOT EVERY PULLBACK IS A TRADE.**

The real challenge isn't seeing that a market is trending.

It's knowing **which retracement is worth paying attention to.**

This XAUUSD H4 example shows **Tethys Pullback Compass** identifying potential bearish continuation setups after price pulled back inside a declining market.

🔴 **Red Arrow = Potential Bearish Continuation Setup**
🟢 **Green Arrow = Potential Bullish Continuation Setup**

But Tethys isn't designed to throw an arrow on every small retracement.

Before displaying a signal, its multi-factor model evaluates:

✅ Directional market context
✅ Pullback quality
✅ Retracement-zone conditions
✅ Completed-candle confirmation
✅ Trend health
✅ Market directionality
✅ Filters designed to reduce signals during choppy conditions

The concept:

**TREND → PULLBACK → CONFIRMATION → SIGNAL**

Look at the two bearish signals on the XAUUSD H4 chart above.

Instead of trying to predict the exact top, Tethys waits for the pullback conditions and confirmation process before marking a potential continuation setup.

That's exactly what I built it for:

**Stop chasing extended moves.
Wait for the market to retrace.
Then evaluate the continuation.**

⚡ Closed-candle signal logic
📊 Any MT5 symbol or timeframe
🔔 Optional popup alerts
⚙️ Adjustable pullback and confirmation controls
🚫 Anti-range / trend-health filtering
📈 Historical signals visible directly on the chart

**Tethys Pullback Compass for MetaTrader 5**

💰 Available now for **$79** on the MQL5 Market.

👉 **Try the demo first. Test it on the exact symbols and timeframes YOU trade, review the historical signals, and decide for yourself whether it belongs in your trading process.**

Search:

**Tethys Pullback Compass**

on the MQL5 Market.

Don't chase the move.

**Let the pullback come to you. 🧭**

*Technical analysis tool only. Signals are analytical prompts, not guaranteed trade outcomes. Always apply your own risk management.*
Alex Amuyunzu Raymond
Alex Amuyunzu Raymond 2026.08.15
exactly
Guad Bibar
Guad Bibar
🔥 **STOP CHASING THE TREND — WAIT FOR THE PULLBACK TO CONFIRM**

One of the hardest parts of trend trading isn't identifying the direction.

It's knowing **WHEN to enter.**

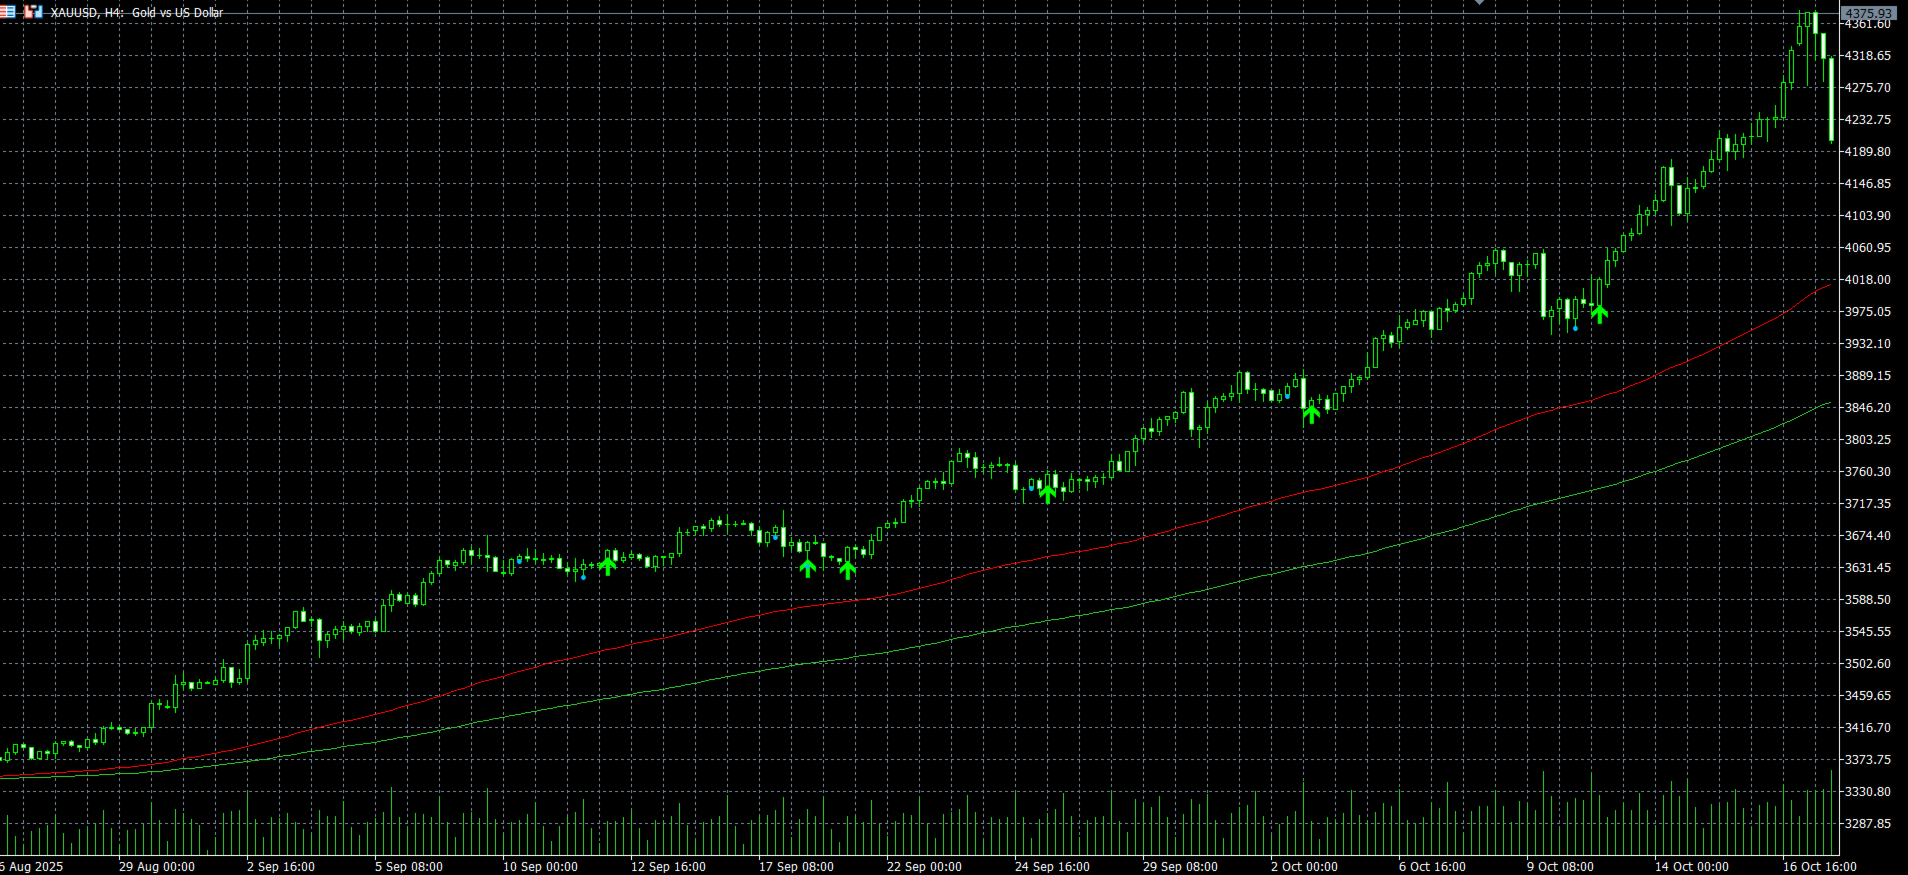
This XAUUSD H4 chart shows **Trend Candle Confirmation MT5** working inside a strong bullish trend.

Instead of producing an arrow simply because price is moving up, the indicator looks for:

✅ Trend alignment
✅ A valid pullback
✅ Closed-candle confirmation
✅ The first confirmed entry after the setup
✅ Optional filtering for choppy/ranging conditions

**Green Arrow = Confirmed Bullish Entry**
**Red Arrow = Confirmed Bearish Entry**

The idea is simple:

**Trend → Pullback → Confirmation → Signal**

No need to chase every candle.

Wait for the market to come back to you and let the indicator highlight when the selected conditions align.

📊 Works directly on MetaTrader 5
🔔 Optional alerts
⚙️ Adjustable confirmation settings
🕯️ Signals are based on completed candles
📈 Designed for trend-following and pullback traders

The screenshot above is an **XAUUSD H4 historical chart example** showing several bullish confirmation signals during the broader uptrend.

**Trend Candle Confirmation MT5 — available now on the MQL5 Market for $79.**

👉 **Try the demo first in the MT5 Strategy Tester and see how the signals behave on the symbols and timeframes you trade.**

Search the MQL5 Market for:

**Trend Candle Confirmation MT5**

Trade the trend.
Wait for the pullback.
Let confirmation decide the timing.

*Technical analysis tool only. No trading result is guaranteed.*
Guad Bibar
게재된 코드 Trend Execution Planner - Regime and Risk Panel
현재 추세 상황을 평가하고 브로커별 표준화된 매수 및 매도 리스크 계획을 수립해 주는 무료 오픈소스 MT5 읽기 전용 차트 유틸리티입니다. 이 유틸리티는 이동평균의 방향과 기울기, ADX, 효율성 지수, ATR, 스프레드, 계좌 통화 및 종목 정보를 활용합니다. 이 유틸리티는 절대로 포지션을 개설, 수정 또는 청산하지 않습니다.
Guad Bibar
게재된 코드 Trend Regime Inspector for MetaTrader 5
Open-source indicator combining moving-average direction, ADX and Kaufman's Efficiency Ratio into a transparent trend-condition score. Informational only; no trade execution.