Abdalla Mohamed Mahmoud Taha
- Professional Accounts Manger 에 FOREIGN EXCHANGE MARKET
- 이집트
- 776
|
8+ 년도
경험
|
0
제품
|
0
데몬 버전
|
|
0
작업
|
0
거래 신호
|
0
구독자
|
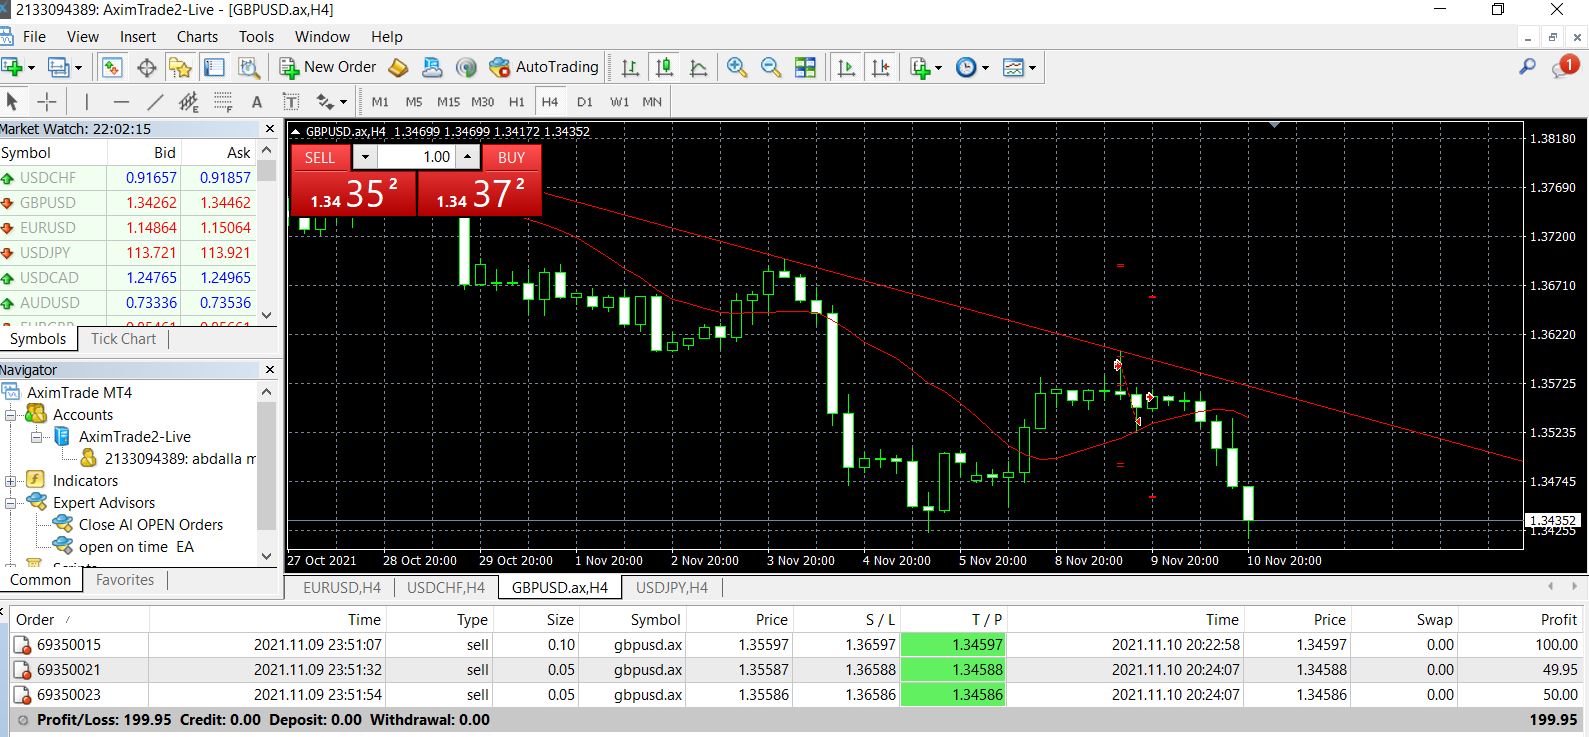
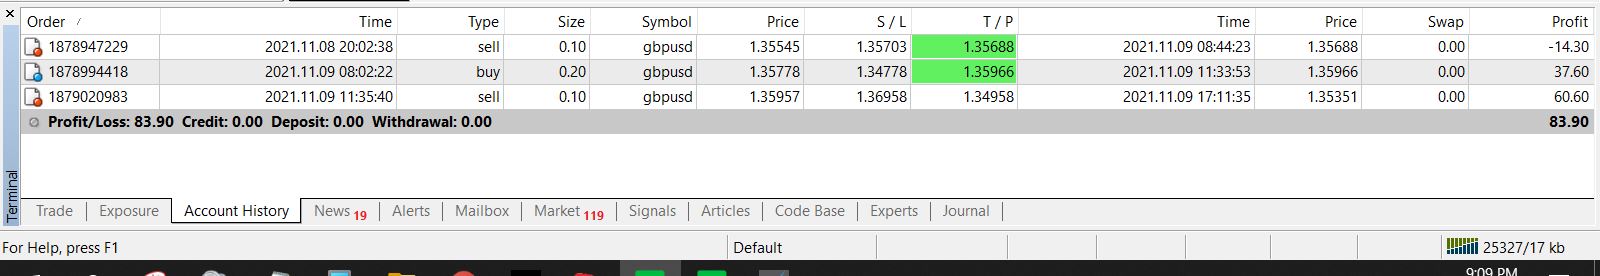
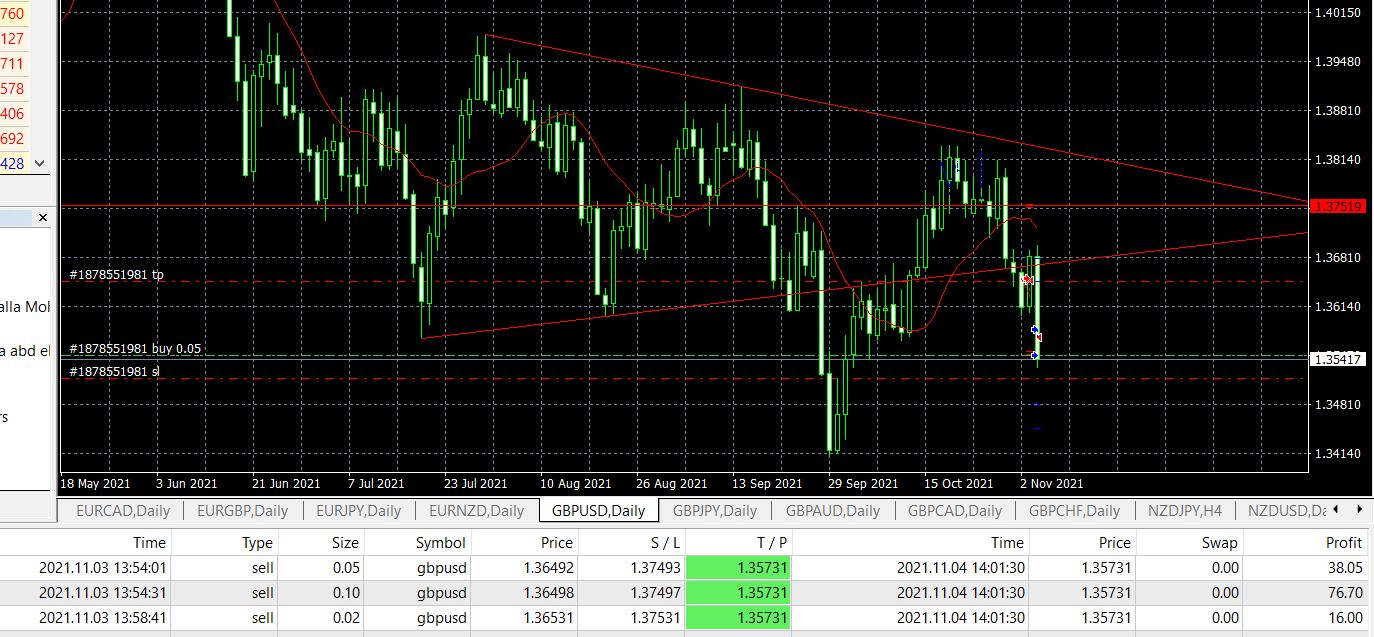
my name Abdalla Mohamed, I have more than 11 years experience in forex market .
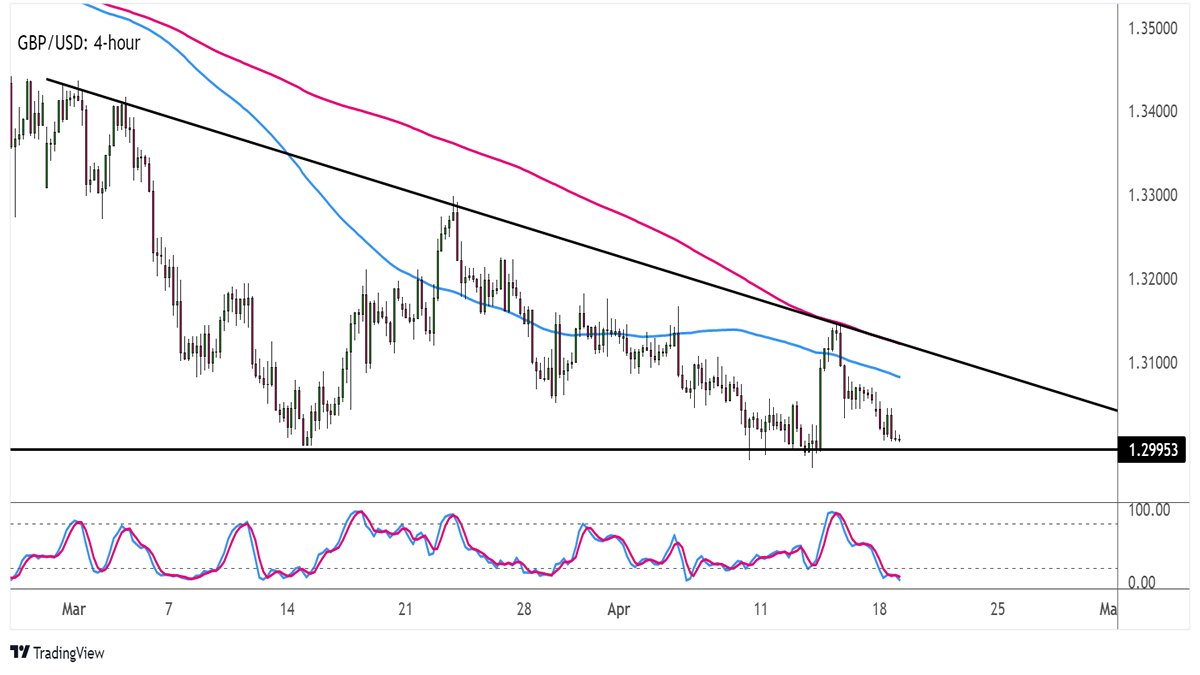
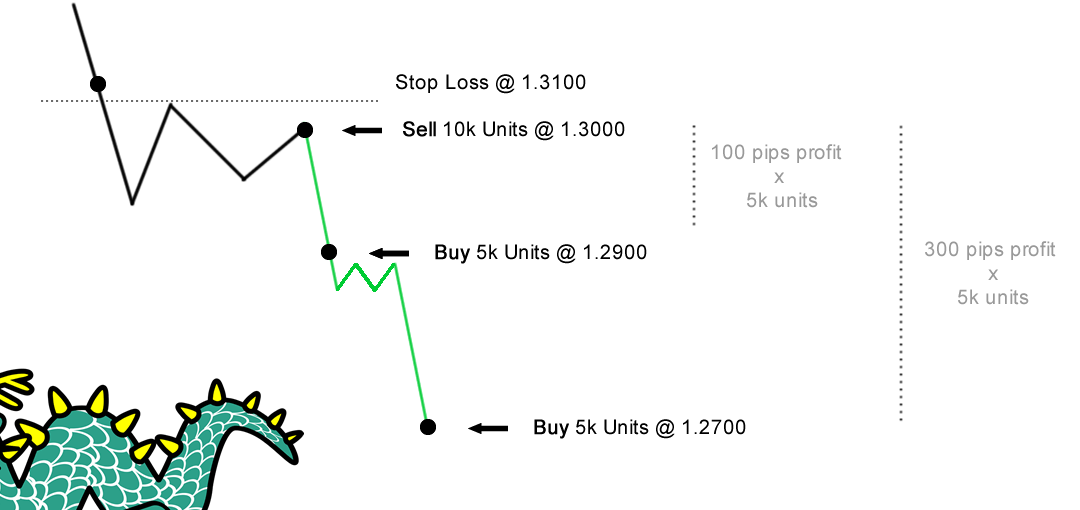
I am very professional scalping trader and I own research and studies on the pairs of the British pound
, i have signals providers at MT4 / MT5 , available through the MQL5.com Market.
I am very professional scalping trader and I own research and studies on the pairs of the British pound
, i have signals providers at MT4 / MT5 , available through the MQL5.com Market.