• 미리보기
  • 리뷰 (1)
  • 코멘트
  • 새 소식

Rigorous Market Sessions SubWindow

1. What is this.

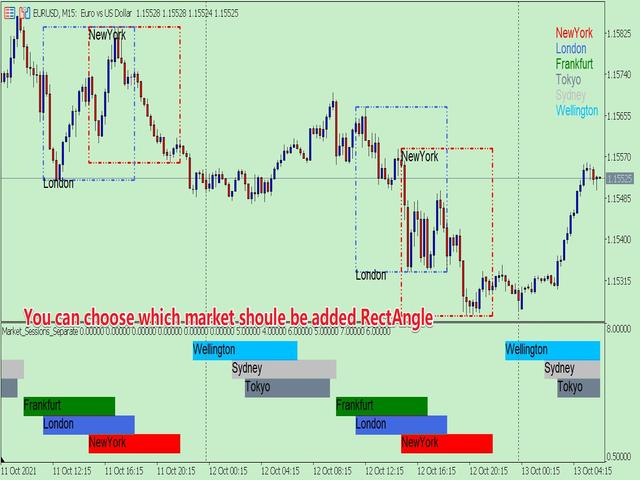
         This is a very rigorous indicator to show different market trading sessions. It shows the main markets: NewYork, London, Frankfurt, Sydney, Wellington, Tokyo.

         Very important:

Different markets have different start and end dates for daylight saving time, and the trading session of a market can vary depending on daylight saving time and winter time.

Also, the daylight saving time system is different for countries in the northern hemisphere and southern hemisphere, as well as the system of daylight saving time changes in a market in different years

For example: New York daylight saving time system:

  • 1987-2006:     02:00 on the first Sunday in April       -->    02:00 on the last Sunday in October
  • 2007-present: 02:00 on the second Sunday in March -->    02:00 on the first Sunday in November

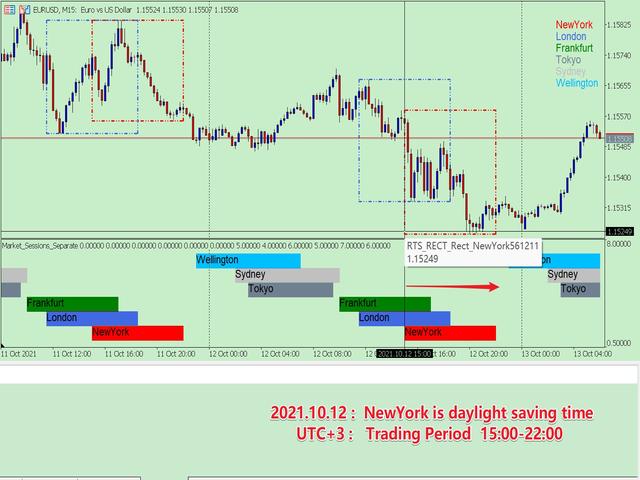
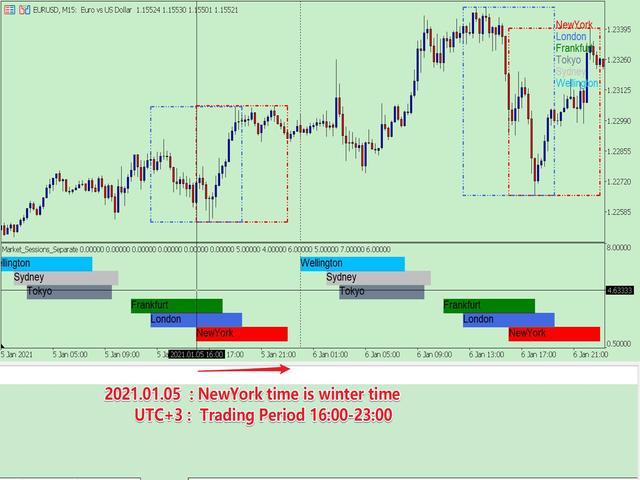
New York forex market trading session (UTC+3): 15:00-22:00 (daylight saving time); 16:00-23:00 (winter time).

            Therefore, the trading session must consider the city, the daylight saving time of the year, and the corresponding trading period, otherwise the trading period is wrong. But if these are all set manually, which is very cumbersome, this program can be set automatically.

    You can refer to my blog to learn about the daylight saving time system and trading hours of major countries:

    DAYLIGHT SAVING TIME RECORDS OF MAJOR COUNTRIES

    OPENING AND CLOSING TIME OF MAJOR INTERNATIONAL FOREIGN EXCHANGE MARKETS


    2. Program Features

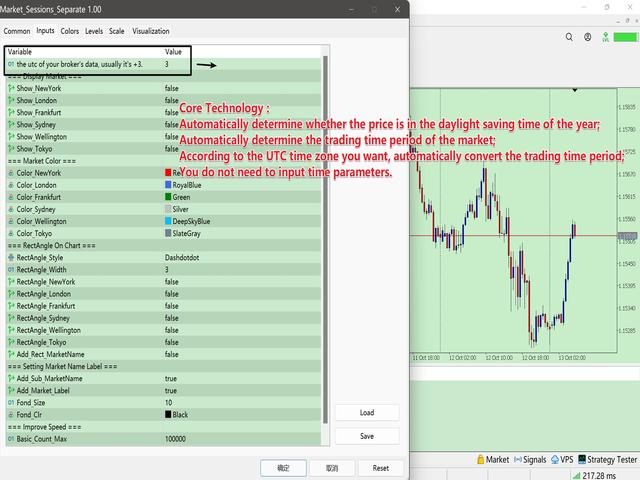
    • Automatically determine whether the price is in the daylight saving time of the year;
    • According to whether the market is in daylight saving time, automatically determine the trading time period of the market;
    • According to the UTC time zone you want, automatically convert the trading time period;
    • The historical data is all rigorously matched, so you can get accurate historical market trading sessions, which is convenient for your research.
    • With multiple display modes, you can always find a solution that suits you.

    3. How to use (sub window mode)

    The parameters are expressed in groups, which are very easy to understand. The following describes each parameter group:

    • is broker auto adjust utc
    • if the above is true, summer utc; if false summer or winter utc.
    • group "=== Show Market On Chart ===" :   The parameter in the group is to choose whether to display the corresponding market, which is the general control key for a single market.
      • Show_NewYork = true;
      • Show_London = true;
      • Show_Frankfurt = true;
      • Show_Sydney = true;
      • Show_Wellington = true;
      • Show_Tokyo = true;
    • group "=== Market Color ===" :  The parameters in the group are to set the color of each market
      • Color_NewYork = clrRed;
      • Color_London = clrRoyalBlue;
      • Color_Frankfurt = clrGreen;
      • Color_Sydney = clrSilver;
      • Color_Wellington = clrDeepSkyBlue;
      • Color_Tokyo = clrSlateGray;
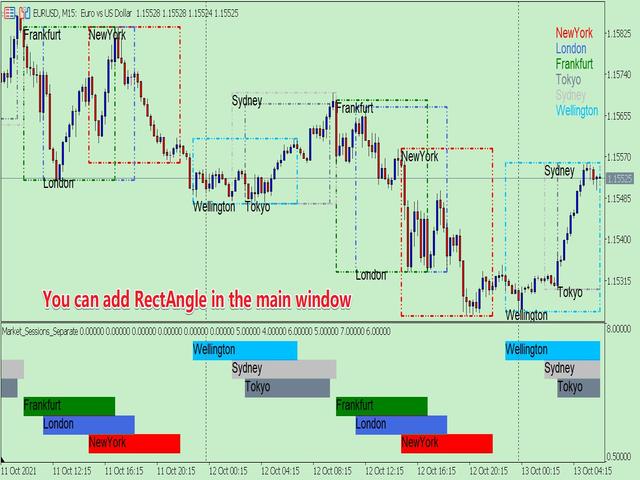
    • group "=== RectAngle On Chart ===" :   Whether to add RectAngle in the main window for the parameter setting in the group
      • RectAngle_Style = STYLE_DASHDOTDOT;        //  Type of RectAngle 
      • RectAngle_Width = 3;        
        • //  The width of the RectAngle , according to the limitations of MT5, only STYLE_SOLID, STYLE_DASHDOTDOT types can be greater than 1.
      • RectAngle_NewYork = true;
      • RectAngle_London = true;
      • RectAngle_Frankfurt = true;
      • RectAngle_Sydney = true;
      • RectAngle_Wellington = true;
      • RectAngle_Tokyo = true;
      • Add_Rect_MarketName = true;        //  Whether to add the market name in the box
    • group "=== Setting Market Name Label ===" :  The parameter setting in the group displays the market name
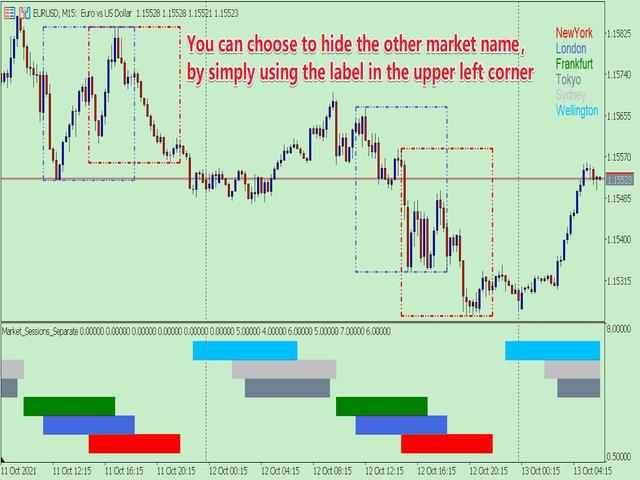
      • Add_Sub_MarketName = true;     //  Whether to add the market name in the sub-window
      • Add_Market_Label = true;        //  Whether to display the market name in the upper right corner of the main window
      • Fond_Size = 10;        //  Text size
      • Fond_Clr = clrBlack;        //  Text color
    • group "=== Improve Speed ===" :  The parameters in the group are used to set the number of calculations. When studying historical data, you can set a larger one; for real-time trading, you can set a smaller one.
      • Basic_Count_Max = 100000;     //   The basic number of data, this can be set very large.
      • Object_Count_Days = 5;        //  The number of boxes and name tags in units of days.

    4. Others

            Due to the limitations of MT5, I had to write the program in two forms.

    One is the sub-window mode;  the other is the chart window mode. The two modes are different, there is always one that suits you. The current page is the sub-window mode.


    추천 제품
    1. What is this.          This is a very rigorous indicator to show different market trading sessions. It shows the main markets: NewYork, London, Frankfurt, Sydney, Wellington, Tokyo.           Very important: Different markets have different start and end dates for daylight saving time, and the trading session of a market can vary depending on daylight saving time and winter time. Also, the daylight saving time system is different for countries in the northern hemisphere and southern hemisphe
    Exact Time — detailed time on the seconds chart. The utility shows the opening time of the selected candle. This is necessary when working with seconds charts. For example, it can be used on a seconds chart built using the " Seconds Chart " utility, which helps to build seconds chart in the MT5 terminal. Use the CTRL key to turn on/off the time display on the chart.
    FREE
    * This product was converted using  "BRiCK Convert4To5 MT4 "  based on the MQL4 source file of  "BRiCK Convert4To5 MT4 Free" . "Convert4To5" is a Script that converts MQL4 source files into MQL5 source files. Experts, Indicators, Scripts, and Libraries with extension ".mq4" will be available for MT5. Parameter None. Procedure 1. Open the following folder.     terminal_data_folder\MQL4\Files\ (in the terminal menu select to view "File" - "Open the data directory") 2. Confirm that the BRiC
    FREE
    Market book tester
    Aliaksandr Hryshyn
    1 (1)
    Using data from the order book in the strategy tester Key features: Simultaneous use of several symbols, up to 7 pieces DOM visualization With the visualization of order books, real-time simulation is available, as well as acceleration or deceleration Working with the library: This product also requires a utility to save data:  https://www.mql5.com/en/market/product/71642 Speed control utility:  https://www.mql5.com/en/market/product/81409 Include file:   https://c.mql5.com/31/735/Market_book_s
    FREE
    specific purpose: Export trading varieties in the market quotation to a table file, which is convenient for users to use EXCEL to analyze trading varieties, and find and select suitable trading varieties faster and more convenient. If you want all trading varieties, you can go to Market Quotation -> Trading Varieties -> Right-click -> Show All, so that you can download all trading varieties. Parameter Description: Cycle, you can choose M1, D1, W1, MN, etc., the default is D1, analyze the daily
    FREE
    Close by percentage MT5
    Konstantin Kulikov
    4.86 (7)
    Hello friends. I wrote this utility specifically for use in my profile with a large number of Expert Advisors and sets ("Joint_profiles_from_grid_sets"   https://www.mql5.com/en/blogs/post/747929 ). Now, in order to limit losses on the account, there is no need to change the "Close_positions_at_percentage_of_loss" parameter on each chart. Just open   one   additional chart, attach this utility and set the desired percentage for closing all trades on the account. The utility has the following fu
    FREE
    SIMPLE AND QUICK CHART CLEANUP SCRIPT - FREE FOR ALL - EASY TO DRAG AND DROP ONTO THE CHART - A MUST HAVE IN MY EYES Everybody loves to draw on a chart! But cleaning is nobodies favor. Most of the time it will be faster to dump all and redraw the important part. Repetition makes you good! ALWAYS think about that! KEEP IT GROWING, ;-) I wish you a good day, Traders! If you need something, send me a message. Best wishes to you from Vienna!
    FREE
    Ordem Facil
    Clesio Hector Dufau Da Conceicao
    EA Ordem Fácil helps you open pending buy and sell orders (buy or sell stop) using the SHIFT, CTRL keys and mouse left button click. To create a buy stop order, press the SHIFT key (only once) and click on mouse left button on the chart above the price. To create a sell stop order, press the CTRL key (only once) and click on mouse left button on the chart below the price. While the order is not opened, when you moving the mouse cursor on the chart, on the left and above corner of the ch
    This tool will allow you to export the Historical data (Open, High, Low, Close, Volume) for any financial instrument present in your MetaTrader 5. You can download multiple Symbols and TimeFrames in the same csv file. Also, you can schedule the frequency of download (every 5 minutes, 60 minutes, etc.). No need to open a lot of charts in order to get the last data, the tool will download the data directly. The CSV File will be stored in the folder: \MQL5\Files . How it works Select the Symbols
    FREE
    PROMOTION!! $499 until 1 Mar. After that, EA will be $1,050 Developed and tested for over 3 years, this is one of the safest EAs on the planet for trading the New York Open. Trading could never be easier.  Trade On NASDAQ US30 (Dow Jones Industrial Average) S&P 500  What Does The EA do? The EA will open a Buy Stop Order and a Sell Stop Order(With SL and TP) on either side of the market just a few seconds before the NY Open.  As soon as 1 of the 2 trades is triggered, the EA automatically delete
    Symbol Manager for MT5
    Taras Slobodyanik
    5 (1)
    Symbol Manager or Grid Manager, designed to group orders into one position (by symbol and by direction). This utility will be useful to multi-currency traders, who can have multiple orders on several pairs. You will be able to see the total number of lots, the total profit, and set virtual stop loss and virtual take profit. To set a real TP (or SL), you must first set the virtual value, and then enter the command in this cell: "set". If you want to set real TP/SL for all orders at once, then en
    1. 12개의 마스터 계정에서 100개의 슬레이브 계정으로 주문을 복사합니다. 슬레이브 계정의 수는 12에서 100까지 사용자 지정할 수 있습니다. 2. MT4에서 MT4, MT4에서 MT5, MT5에서 MT4, MT5에서 MT5를 지원합니다. 3. EURUSD, EURUSDm, EURUSDk와 같은 다양한 플랫폼에서 거래 종류의 접미사를 식별합니다. 4. XAUUSD=GOLD와 같은 사용자 정의 통화 일치. 5. 모든 거래를 복사하거나 BUY, SELL, CLOSE 지침만 복사할 수 있습니다. 6. 손절매 복사 여부를 선택할 수 있습니다. 7. 마스터 계정이 BUY, 슬레이브 계정이 SELL 또는 그 반대와 같이 역순으로 복사할 수 있습니다. 마스터 계정이 포지션을 청산하면 슬레이브 계정은 같은 방향으로 복사되든 반대로 되든 상관없이 동시에 포지션을 청산합니다. 8. 슬레이브 계정이 해지되는 등의 사고 발생시 마스터 계정은 청산 신호가 있지만 슬레이브 계정은 제때 복사하지 않습니
    Hi you, I need your help! Be my Patron, let's make it possible! https://www.patreon.com/joaopeuko https://github.com/Joaopeuko/Mql5-Python-Integration Channel: English version - Versão Inglês: https://www.mql5.com/en/channels/Mql5_Python_Integration_EN Portuguese version - Versão Português: https://www.mql5.com/en/channels/Mql5_Python_Integration_PT Free version with 5 indicators: https://www.mql5.com/en/market/product/57574 This version has 38 indicators, 5 from the free vers
    FREE
    The best time to trade Using this Indicator is when the time reach exactly hour,half,45 minutes,15 minutes and sometimes 5 minutes.. This indicators is helpful to those who trade boom and crash indecies.How to read this indicator first you'll see Blue allow and Red allow all these allows used to indicate or to detect the spike which will happen so the allow happens soon before the spike happen.This indicator works properly only in boom and crash trading thing which you have to consider when
    MACD Colored ZeroLag
    Farzin Sadeghi Bonjar
    4.14 (7)
    It is the MQL5 version of zero lag MACD that was available for MT4 here: https://www.mql5.com/en/code/9993 Also there was a colored version of it here but it had some problems: https://www.mql5.com/en/code/8703 I fixed the MT4 version which has 95 lines of code. It took me 5 days to write the MT5 version.(reading the logs and testing multiple times and finding out the difference of MT5 and MT4!) My first MQL5 version of this indicator had 400 lines of code but I optimized my own code again and n
    FREE
    Value Chart Candlesticks
    Flavio Javier Jarabeck
    4.67 (9)
    The idea of a Value Chart indicator was presented in the very good book I read back in 2020 , " Dynamic Trading Indicators: Winning with Value Charts and Price Action Profile ", from the authors Mark Helweg and David Stendahl. The idea is simple and the result is pure genius: Present candlestick Price analysis in a detrended way! HOW TO READ THIS INDICATOR Look for Overbought and Oversold levels. Of course, you will need to test the settings a lot to find the "correct" one for your approach.
    FREE
    MarketPro toolkit
    Johannes Hermanus Cilliers
    Start earning profits by copying All trades are sent by our successful Forex trader & are extremely profitable. You can earn profits by copying trades daily Trial Period included You'll also get access to extremely powerful trading education which is designed in a simple way for you to become a profitable trader, even if you have no trading experience. https://ec137gsj1wp5tp7dbjkdkxfr4x.hop.clickbank.net/?cbpage=vip
    FREE
    White Weis Volume Ticks
    Ricardo Almeida Branco
    5 (3)
    White Weis Volume This indicator shows the sum of the volume in each wave, bulish or bearish, as idealized by David Weis , but it brings an important addition , which is the marking of the bar with the highest volume of the wave (White Bar)! In coding the indicator, it was sought to optimize the code to require minimal processing during use and not to overload mt5. The indicator can be used for pre-trading analysis and study, where the trader analyzes possible points of support and resi
    LT Ajuste Diario
    Thiago Duarte
    3.67 (3)
    This is a tool in script type. It shows in chart the actual and/or past day ajust price in a horizontal line. The symbol name and it expiration must be set up according to the actual parameters. The lines appearance are fully customizable. You need to authorize the B3 url on MT5 configurations:  www2.bmf.com.br. You need this to the tool can work. This is a tool for brazilian B3 market only!
    FREE
    Volume Weighted Average Price or VWAP is an indicator wich shows different average prices on chart. This is very useful to find strong negotiation price areas and as trend following. Configurations: Day, Week and Month - Show different VWAPs according to the period. You can change each line style on "colors" tab. Any doubt or suggestion please contact us. Enjoy! This is a free indicator, but it took hours to develop. If you want to pay me a coffee, I appreciate a lot   <3 PayPal, Skrill, Ne
    FREE
    Weis Waves
    Flavio Javier Jarabeck
    3.15 (26)
    The original author is David Weis, an expert in the Wyckoff Method. The Weis Wave is a modern adaptation of the 1930's Wyckoff Method, another expert in Tape Reading techniques and Chart Analysis. Weis Waves takes market volume and stacks it into waves according to price conditions giving the trader valuable insights about the market conditions. If you want to learn more about this subject you can find tons of videos in YouTube. Just look for "The Wickoff Method", "Weis Wave" and "Volume Spread
    FREE
    News Loader Pro is a tool that automatically updates every economic news in real time with detailed information from several online data sources. It uses the unique technology to load data with full details from popular Forex websites. An alert will be sent to your mobile/email before an upcoming news release. Moreover, it also marks the news release points on the chart for further review and research. In Forex trading, news is one of the important factors that move the market. Sticking with ne
    Presentation The URL html and xml to csv is designed to get contents from URLs with html or xml content, and to download it to an output format as a txt or as a csv file. It enables to get the whole web sites page, starting with the http protocol, in a document for a further use and in additional with downloading directly on the MetaTrader applications and on the desktop. It is a good advantage for taking the most data from events and economic calendars, and also publications related to the inst
    FREE
    CloseAll MT5
    Mr Sorachai Pitakjarukul
    5 (2)
    ขอบคุณ แรงบันดาลใจ จากโค้ชแพม ที่ทำให้เริ่มทำ    Close all ตัวนี้  และขอขอบคุณทุกคนที่ให้ความรู็มาโดยตลอด ไม่ว่าจะทางตรงทางอ้อม ขอบคุณทุกคนที่ให้ความรู้เพื่อนร่วมเทรด ทั้งนี้เพื่อให้นักเทรดทุกคนได้มีเครื่องมือในการควบคุมการปิดการซื้อขาย จึงขอพัฒนาโปรแกรม close all version 5 ได้ใช้ทุกคน  Close all and update profit Version 1.00 (MT5) Full version Give you free  For MT4 Click  https://www.mql5.com/en/market/product/79252 Fix TPSL calculate  Program function Tab 1 Close order function and sh
    FREE
    Get news5
    Aleksander Gladkov
    Utility for reading news from investing.com To access the site, you need to add WebRequest in the Options terminal menu on the Expert Advisors tab: https://sslecal2.investing.com If reading is successful, a message about writing the file is displayed. The INV_week_this.txt file is written to the MQL5\Files folder of the terminal and is kept up to date, updating data according to its own timer You can attach the utility to any chart with any time frame; just one is enough to support indicat
    this is DEMO VERISON (for demo acc.) of  TRADING OVERLAY with PARTIAL take profit    ("virtual TP")   and % risk lot size   --- full version available   on my 'seller page' as well as version for MT4 Take better control of your trades with ease ! Easy lot size calculation with easy SL/TP setting. Your trading will be much more comfortable with this tool!   Main goal with this tool is very SIMPLE and FAST operation!    Works like any EA, add it to selected chart and trade ! Features: start
    FREE
    Donchian Pro
    Paulo Henrique Faquineli Garcia
    5 (2)
    The Donchian Channel Channels are among the most popular tools of technical analysis, as they visually convey to the analyst the limits within which most price movement tends to occur. Channel users know that valuable information can be obtained at any time, whether prices are in the central region of a band or close to one of the border lines. One of the best known techniques to explore these concepts is Bollinger Bands. However, John Bollinger was not the only one to research the applicatio
    FREE
    MetaCOT 2 is a set of indicators and specialized utilities for the analysis of the U.S. Commodity Futures Trading Commission reports. Thanks to the reports issued by the Commission, it is possible to analyze the size and direction of the positions of the major market participants, which brings the long-term price prediction accuracy to a new higher-quality level, inaccessible to most traders. These indicators, related to the fundamental analysis, can also be used as an effective long-term filter
    FREE
    Sigma Revert Hand
    Italo Martins Coutinho
    Apenas Abre posições em lado inverso para cada posição aberta e fecha as posições antigas Exceução de Inversão de mão de modo rápido, funciona em Conta Hedge e Netting Para mais detalhes de configurações e input de variáveis entre em nossa comunidade no guilded ( https://www.guilded.gg/i/E9m8bYLE ) Inclui Rompimentos, Canais Estreitos, Canais Amplos e Lateralidades, ou seja para todos os ciclos
    FREE
    Easy Copier Limited  is utility tool to copy trade / trade copier form one account (master) to other account (slave) .  It works only with a single forex ( EURUSD ) . You can use this tool as local copier ( Terminals have to be in same PC / VPS ) as well as Remote Copier ( Terminals can be in different PC / VPS ). For remote copy you can use my server or it can be configured to your server . Trades are possible to copy from    MT4 => MT4     MT4 => MT5         MT5 => MT5       MT5 => M
    이 제품의 구매자들이 또한 구매함
    Trade Assistant MT5
    Evgeniy Kravchenko
    4.4 (171)
    거래당 위험 계산, 라인을 사용한 손쉬운 신규 주문, 부분 청산 기능을 통한 주문 관리, 7가지 유형의 트레일링 스탑 및 기타 유용한 기능을 제공합니다. 주의, 응용 프로그램은 전략 테스터에서 작동하지 않습니다. 설명 페이지에서 데모 버전을 다운로드할 수 있습니다.  Manual, Description, Download demo 라인 기능       - 차트에 개시선, 손절매, 차익실현을 표시합니다. 이 기능을 사용하면 새로운 주문을 쉽게 하고 개봉 전에 추가 특성을 볼 수 있습니다. 위기 관리       -       위험 계산 기능은 설정된 위험과 손절매 주문의 크기를 고려하여 새 주문의 볼륨을 계산합니다. 이를 통해 손절매 크기를 설정하고 동시에 설정된 위험을 존중할 수 있습니다. 로트 계산 버튼 - 위험 계산을 활성화/비활성화합니다. 필요한 위험 값은 위험 필드에 0에서 100 사이의 백분율 또는 예금 통화로 설정됩니다. 설정 탭에서 위험 계산 옵션을 선택합니다.
    가격이 순식간에 변할 수 있는 시장에서 주문은 가능한 한 간단해야 한다고 생각하십니까? Metatrader에서는 주문을 열 때마다 시작 가격, 손절매 및 이익실현 및 거래 규모를 입력하는 창을 열어야 합니다. 금융 시장 거래에서 자본 관리는 초기 예금을 유지하고 곱하기 위해 필수적입니다. 따라서 주문을 하고 싶을 때 얼마나 큰 거래를 열어야 하는지 궁금할 것입니다. 이 단일 거래에서 위험을 감수해야 하는 예치금의 비율은 얼마입니까? 이 거래에서 얼마나 많은 이익을 얻을 수 있으며 위험 대비 이익 비율은 얼마입니까? 거래 규모를 설정하기 전에 거래 규모가 어떻게 되어야 하는지에 대한 질문에 대한 답을 얻기 위해 필요한 계산을 수행합니다. 이 모든 작업을 자동으로 수행하는 도구가 있다고 상상해 보십시오. 차트를 열고 시장 분석을 하고 진입점, 방어점(손절매) 및 목표(이익 실현)를 수평선으로 표시하고 마지막에 위험 수준을 정의합니다. 이 거래에서 감당할 수 있는 가용 자본의 %로, 이
    TradePanel MT5
    Alfiya Fazylova
    4.86 (113)
    Trade Panel은 다기능 거래 보조원입니다. 이 애플리케이션에는 수동 거래를 위해 설계된 50개 이상의 기능이 포함되어 있어 대부분의 거래 작업을 자동화할 수 있습니다. 구매하기 전에 데모 계정에서 데모 버전을 테스트할 수 있습니다. 데모 버전 여기 . 전체 지침 여기 . 애플리케이션의 주요 기능: 모든 거래 수단(Forex, CFD, 선물 및 기타)과 함께 작동합니다. 무제한 거래 수단(기호)과의 동시 작업 거래당 위험도 자동 계산 및 이익실현 크기에 대한 손절매 비율 설정 "OCO-order"(하나가 다른 하나를 취소함) 작업과 함께 차트에 선을 설정할 수 있습니다(포지션 열기, 보류 중인 주문 열기 또는 그룹별 주문 닫기). 가상의 이익실현 및 손절매를 설정할 수 있습니다. 위치를 뒤집거나 잠글 수 있습니다. 6가지 유형의 후행 정지 손절매를 손익분기점으로 이동시키는 기능이 있습니다. 포지션 부분 청산(손익 일부 청산) 기능이 있습니다. 가격이 지정된 라인에 닿으면 알립니
    Local Trade Copier EA MT5
    Juvenille Emperor Limited
    5 (63)
    Local Trade Copier EA MT5 를 사용하여 매우 빠른 거래 복사 경험을 해보세요. 1분 안에 간편하게 설정할 수 있으며, 이 거래 복사기를 사용하면 Windows 컴퓨터 또는 Windows VPS에서 여러 개의 MetaTrader 터미널 간에 거래를 0.5초 미만의 초고속 복사 속도로 복사할 수 있습니다. 초보자든 전문가든   Local Trade Copier EA MT5 는 다양한 옵션을 제공하여 사용자의 특정 요구에 맞게 맞춤 설정할 수 있습니다. 이는 수익 잠재력을 높이려는 모든 사람을 위한 최고의 솔루션입니다. 지금 사용해보시고 이것이 왜 시장에서 가장 빠르고 쉬운 무역용 복사기인지 알아보세요! 팁: 여기 에서 데모 계정에서 Local Trade Copier EA MT5 데모 버전을 다운로드하여 사용해 볼 수 있습니다. 다운로드한 무료 데모 파일을 MT5 >> File >> Open Data Folder >> MQL5 >> Experts 폴더에 붙여넣고
    Trade Manager DaneTrades
    DaneTrades Ltd
    4.73 (22)
    거래 관리자는 위험을 자동으로 계산하는 동시에 거래를 빠르게 시작하고 종료하는 데 도움을 줍니다. 과잉 거래, 복수 거래 및 감정 거래를 방지하는 데 도움이 되는 기능이 포함되어 있습니다. 거래를 자동으로 관리할 수 있으며 계정 성과 지표를 그래프로 시각화할 수 있습니다. 이러한 기능은 이 패널을 모든 수동 거래자에게 이상적으로 만들고 MetaTrader 5 플랫폼을 향상시키는 데 도움이 됩니다. 다중 언어 지원. MT4 버전  |  사용자 가이드 + 데모 트레이드 매니저는 전략 테스터에서 작동하지 않습니다. 데모를 보려면 사용자 가이드로 이동하세요. 위기 관리 % 또는 $를 기준으로 위험 자동 조정 고정 로트 크기 또는 거래량과 핍을 기반으로 한 자동 로트 크기 계산을 사용하는 옵션 RR, Pips 또는 Price를 사용한 손익분기점 손실 설정 추적 중지 손실 설정 목표 달성 시 모든 거래를 자동으로 마감하는 최대 일일 손실률(%)입니다. 과도한 손실로부터 계정을 보호하고 과도한
    The product will copy all telegram signal to MT5 ( which you are member) , also it can work as remote copier.  Easy to set up, copy order instant, can work with almost signal formats, image signal,  s upport to translate other language to English Work with all type of channel or group, even channel have "Restrict Saving Content", work with  multi channel, multi MT5 Work as remote copier: with signal have ticket number, it will copy exactly via ticket number. Support to backtest signal. How to s
    MT5 to Telegram Signal Provider 는 사용하기 쉽고 완전히 커스터마이즈 가능한 유틸리티로, 특정 신호를 Telegram의 채팅, 채널 또는 그룹으로 전송하고, 귀하의 계정을 신호 제공자 로 만듭니다. 경쟁 제품과 달리 DLL 임포트를 사용하지 않습니다. [ 데모 ] [ 매뉴얼 ] [ MT4 버전 ] [ 디스코드 버전 ] [ 텔레그램 채널 ] 설정 단계별 사용자 가이드 가 제공됩니다. 텔레그램 API에 대한 지식은 필요하지 않습니다; 개발자가 제공하는 모든 것이 필요합니다. 주요 특징 구독자에게 보낸 주문 상세 정보를 커스터마이즈할 수 있습니다. 예를 들어, 브론즈, 실버, 골드와 같은 계층 구독 모델을 만들 수 있습니다. 골드 구독에서는 모든 신호를 받습니다. id, 심볼, 또는 코멘트로 주문을 필터링할 수 있습니다. 주문이 실행된 차트의 스크린샷이 포함됩니다 보낸 스크린샷에 닫힌 주문을 그려 추가 검증을 합니다 새 주문 메시지를 보내기 전에 포지션을 조
    Bots Builder Pro MT5
    Andrey Barinov
    4.75 (4)
    This is exactly what the name says. Visual strategy builder . One of a kind. Turn your trading strategies and ideas into Expert Advisors without writing single line of code. Generate mql source code files with a few clicks and get your fully functional Expert Advisors, which are ready for live execution, strategy tester and cloud optimization. There are very few options for those who have no programming skills and can not create their trading solutions in the MQL language. Now, with Bots Build
    Mentfx Mmanage mt5
    Anton Jere Calmes
    4.43 (7)
    The added video will showcase all functionality, effectiveness, and uses of the trade manager. Drag and Drop Trade Manager. Draw your entry and have the tool calculate the rest. Advanced targeting and close portions of a trade directly available in tool (manage trades while you sleep). Market order or limit order on either side with factored spread. Just draw the entry, the tool does the rest. Hotkey setup to make it simple. Draw where you want to enter, and the stop loss, the tool calculates al
    Trade copier MT5
    Alfiya Fazylova
    4.35 (26)
    Trade Copier는 거래 계정 간의 거래를 복사하고 동기화하도록 설계된 전문 유틸리티입니다. 복사는 공급자의 계정/단말기에서 동일한 컴퓨터 또는 vps에 설치된 수신자의 계정/단말기로 발생합니다. 구매하기 전에 데모 계정에서 데모 버전을 테스트할 수 있습니다. 데모 버전 여기 . 전체 지침 여기 . 주요 기능 및 이점: 복사기는 "МТ5> МТ5", "МТ4> МТ5", "МТ5> МТ4" 복사를 지원합니다. 복사기는 데모 계정 > 실 계정, 실 계정 > 데모 계정, 데모 계정 > 데모 계정 및 실제 계정 > 실 계정 복사를 지원합니다. 복사기는 읽기 전용 암호가 적용된 투자자 계정에서 복사를 지원합니다. 하나의 공급자 터미널은 여러 수신 터미널로 트랜잭션을 보낼 수 있고 하나의 수신 터미널은 여러 공급자 터미널에서 트랜잭션을 수신할 수 있습니다. 복사기는 귀하 또는 귀하의 고문이 거래하는 동일한 터미널에서 작동할 수 있습니다. 높은 복사 속도(0.5초 미만). 복사기에는 간편
    The top-selling EAs on the market cost a lot and one day they are suddenly gone. This is because one strategy will not work in the forex market all the time. Our product is unique from all others in the MQL Marketplace because our EA comes with 34+ built-in indicators that allow develop strategies every time.  You build your strategy and keep updating it. If one strategy does not work, simply build another all using only one EA. This is All-In-One EA   in this market place. You can use as trade
    OrderManager MT5
    Lukas Roth
    4.88 (16)
    OrderManager   소개: MT5용 혁신적인 유틸리티 MetaTrader 5용 새로운 Order Manager 유틸리티를 통해 전문가처럼 거래를 관리하세요. 단순성과 사용 편의성을 염두에 두고 설계된 Order Manager는 각 거래와 관련된 위험을 쉽게 정의하고 시각화할 수 있습니다. 이를 통해 보다 효과적인 결정을 내리고 거래 전략을 최적화할 수 있습니다. OrderManager에 대한 자세한 정보는 매뉴얼을 참조하십시오. [ 매뉴얼 ] [ MT4 버전 ] [ 텔레그램 채널 ] 주요 특징: 위험 관리: 거래의 위험을 빠르고 쉽게 정의하여 더 나은 결정을 내리고 거래 성능을 향상시킵니다. 시각적 표현: 열린 포지션을 명확하고 간결하게 이해하기 위해 거래와 관련된 위험을 그래픽으로 볼 수 있습니다. 주문 수정: 몇 번의 클릭만으로 주문을 쉽게 수정하거나 닫아, 거래 과정을 간소화하고 소중한 시간을 절약합니다. 손끝의 뉴스: 한 번의 터치로 최신 시장 뉴스를 얻어 항상 정
    Trade Dashboard MT5
    Fatemeh Ameri
    5 (25)
    Tired of complex order placement and manual calculations? Trade Dashboard is your solution. With its user-friendly interface, placing orders becomes effortless, by a single click, you can open trades, set stop loss and take profit levels, manage trade lot size, and calculate risk to reward ratios, allowing you to only focus on your strategy. Say goodbye to manual calculations and streamline your trading experience with Trade Dashboard. Download   demo version   right now. You can find   deta
    Grid Manual MT5
    Alfiya Fazylova
    4.83 (12)
    "Grid Manual"은 주문 그리드 작업을 위한 거래 패널입니다. 이 유틸리티는 보편적이며 유연한 설정과 직관적인 인터페이스를 제공합니다. 그것은 손실을 평균화하는 방향뿐만 아니라 이익을 증가시키는 방향으로 주문 그리드와 함께 작동합니다. 거래자는 주문 그리드를 만들고 유지할 필요가 없으며 유틸리티에서 수행합니다. 거래자가 주문을 시작하는 것으로 충분하며 "Grid Manual"는 자동으로 그를 위한 주문 그리드를 생성하고 거래가 마감될 때까지 그와 동행할 것입니다. 유틸리티의 주요 기능: 모바일 터미널을 포함하여 어떤 방식으로든 열린 주문과 함께 작동합니다. "제한" 및 "중지"의 두 가지 유형의 그리드와 함께 작동합니다. 고정 및 동적(ATR 표시기 기반)의 두 가지 유형의 그리드 간격 계산과 함께 작동합니다. 오픈 오더 그리드의 설정을 변경할 수 있습니다. 차트에서 각 주문 그리드의 손익분기점 수준을 표시합니다. 각 주문 그리드에 대한 이익 마진을 표시합니다. 한 번의 클릭
    회원인 모든 채널에서 신호를 복사하세요 ( 봇 토큰이나 관리자 권한이 필요하지 않음  MT5로 직접 이동합니다. 사용자를 고려하여 설계되었으며 필요한 많은 기능을 제공합니다 이 제품은 사용하기 쉽고 시각적으로 매력적인 그래픽 인터페이스로 제공됩니다. 설정을 사용자 정의하고 제품을 몇 분 안에 사용을 시작하세요! 사용자 가이드 + 데모  | MT4 버전 | 텔레그램 버전 데모를 시도하려면 사용자 가이드로 이동하십시오. Discord   에서 MT5로는 전략 테스터에서 작동하지 않습니다. Discord   에서 MT5로의 기능 회원인 모든 채널에서 복사합니다. 봇 토큰이나 채팅 ID가 필요하지 않습니다 위험 % 또는 고정 로트를 사용하여 거래하세요 특정 심볼 제외 모든 신호를 복사하거나 복사할 신호를 사용자 정의하세요 모든 신호를 인식하도록 단어 및 구를 구성합니다 (기본 설정은 99%의 신호 제공 업체에 작동해야 함) 원하는 경우 시간 및 날짜 설정을 구성하여 신호를 복사
    Adam FTMO MT5
    Vyacheslav Izvarin
    5 (1)
    ADAM EA Special Version for FTMO Please use ShowInfo= false for backtesting ! Our 1st EA created using ChatGPT technology Trade only GOOD and checked PROP FIRMS  Default parameters for Challenge $100,000 Tested on EURUSD and GBPUSD only  Use 15MIN Time Frame Close all deals and Auto-trading  before Weekend at 12:00 GMT+3  Friday For Prop Firms MUST use special Protector  https://www.mql5.com/en/market/product/94362 Signal using ADAM  https://www.mql5.com/en/signals/2190554 --------------------
    -25% discount ($199 -> $149) Advanced trading tool: One click smart orders that execute under your conditions Developed by trader for trading community:  position size calculator (lot size), open position after price action, strategy builder, set and forget trading, mobile notifications... Risk Management -  Risk percentage position size calculator, gain percentage, target risk reward ratio, spread and commissions are included in calculations 7 Advanced order types  - Set and forget trading w
    DrawDown Limiter
    Haidar, Lionel Haj Ali
    5 (17)
    Drawdown Limiter EA You are in the right place if you were searching for Drawdown control, Drawdown limiter, Balance protection, Equity Protection or Daily Drawdown Limit related to Prop Firm, FTMO, or Funded account trading, or if you want to protect your trading account. Have you suffered from controlling your drawdown when trading funded accounts? This EA is meant for you. Prop firms usually set a rule called “Trader Daily Drawdown”, and if it is not respected, you are disqualified.  I am an
    가입한 모든 채널에서 (개인 및 제한된 채널 포함) 시그널을 바로 MT5로 복사합니다.   이 도구는 사용자를 고려하여 설계되었으며 거래를 관리하고 모니터하는 데 필요한 많은 기능을 제공합니다. 이 제품은 사용하기 쉽고 시각적으로 매력적인 그래픽 인터페이스로 제공됩니다. 설정을 사용자 정의하고 제품을 몇 분 안에 사용할 수 있습니다! 사용자 가이드 + 데모  | MT4 버전 | 디스코드 버전 데모를 시도하려면 사용자 가이드로 이동하십시오. Telegram To MT5 수신기는 전략 테스터에서 작동하지 않습니다! Telegram To MT5 특징 여러 채널에서 동시에 신호를 복사합니다. 개인 및 제한된 채널에서 신호를 복사합니다. Bot 토큰이나 채팅 ID가 필요하지 않습니다.   (원하는 경우에는 사용할 수 있습니다) 위험 % 또는 고정된 로트로 거래합니다. 특정 심볼을 제외합니다. 모든 신호를 복사할지 또는 복사할 신호를 사용자 정의할지 선택할 수 있습니다. 모든 신호
    UTM Manager는 빠르고 효율적인 거래 실행을 제공하는 직관적이고 사용하기 쉬운 도구입니다. 눈에 띄는 기능 중 하나는 스프레드를 완전히 무시하고 양초 가격으로 거래할 수 있는 "스프레드 무시" 모드입니다(예: LTF에서 더 높은 스프레드 쌍을 거래할 수 있고 스프레드로 인해 거래에서 제외되는 것을 방지할 수 있음). UTM Manager의 또 다른 주요 측면은 고유한 로컬 거래 복사기로 각 브로커에서 다양한 거래 전략 및 설정(예: 다양한 TP, BE 및 위험 규칙)을 실행할 수 있는 유연성을 허용합니다. 거래 실행: 빠르고 효율적인 거래 실행: 차트에서 진입 및 손절매 가격을 클릭하여 쉽게 거래를 입력하거나 원클릭 고정 손절매 크기 기능을 사용하십시오. 자동 로트 크기 계산: 로트는 미리 정의된 위험 설정을 기반으로 계산되며 위치가 드래그하여 수정될 때 다시 계산됩니다. 하나 또는 여러 위치를 동시에 처리하는 기능. 이익 실현 및 손익분기점: 유연한 이익 실현 설정: 특
    Trade Assistant 38 in 1
    Makarii Gubaydullin
    4.87 (15)
    다기능 도구: 로트 계산기, 가격 조치, R/R 비율, 무역 관리자, 공급 및 수요 영역을 포함한 65개 이상의 기능 데모 버전   |   사용자 매뉴얼   |   MT5 버전 이 유틸리티는 전략 테스터에서 작동하지 않습니다.   여기에서 데모   버전을 다운로드하여 제품을 테스트할 수 있습니다. Contact me   질문/개선 아이디어가 있는 경우/버그가 발견된 경우   저에게 연락 하십시오. 거래 프로세스를 간소화, 가속화 및 자동화하십시오. 이 대시보드로 표준 터미널 기능을 확장하십시오. 유틸리티는 외환, 주식, 지수, 암호화폐 등 모든 거래 수단에서 작동합니다. 1. 새로운 거래 열기 : 로트/리스크/RR 계산: 1. Lot 계산기 (리스크 규모에 따른 거래량 계산) 2. 리스크 계산기 (로트 규모에 따른 리스크 금액) 3. 위험/보상 비율(RR) 4. 주문에 대한 활성화 트리거 + StopLimit 구매 / StopLimit 판매 5. 가상 SL / TP 레벨
    Active Lines
    Yury Kulikov
    5 (4)
    Attention: Demo version for review and testing can be downloaded here . It does not allow trading and can only be run on one chart. Active Lines - a powerful professional tool for operations with lines on charts. Active Lines provides a wide range of actions for events when the price crosses lines. For example: notify, open/modify/close a position, place/remove pending orders. With Active Lines you can assign several tasks to one line, for each of which you can set individual trigger conditions
    Hedge Ninja
    Robert Mathias Bernt Larsson
    Make sure to join our Discord community over at www.Robertsfx.com , you can also buy the EA at robertsfx.com WIN NO MATTER IN WHICH DIRECTION THE PRICE MOVES This robot wins no matter in which direction the price moves by following changing direction depending on in which direction price moves. This is the most free way of trading to this date. So you win no matter which direction it moves (when price moves to either of the red lines as seen on the screenshot, it wins with the profit target yo
    Profit or Loss Pad
    Vladislav Andruschenko
    4.55 (11)
    이익 추적 기능으로 총 이익/손실에 도달하면 MetaTrader 5에서 포지션을 청산합니다.   CloseIfProfitorLoss with Trailing 가상 정류장(별도 주문)을   활성화할 수 있습니다. BUY 및 SELL 포지션을 별도로   계산 및 마감(BUY SELL 별도) , 모든 기호 또는 현재 기호만   닫고 계산(모든 기호) , 이익을 위해   후행   활성화( 후행 이익) 포지션은 예치 통화, 포인트, % 및 인출 금액을   기준으로 마감됩니다. 응용 프로그램은 다른 EA와 함께 또는 수동 거래와 함께 모든 계정에서 사용하도록 설계되었습니다. MT4 버전 전체 설명   +DEMO +PDF 구입 방법 설치하는 방법     로그 파일을 얻는 방법     테스트 및 최적화 방법     Expforex의 모든 제품 일부 쌍 또는 모든 쌍의 총 거래 잔액이 설정에 지정된 값보다 크거나 같으면 모든 위치가 닫히고 주문이 삭제됩니다. 이 버전은 지정된 이익 수준
    -25% discount ($149 -> $111) Everything for chart Technical Analysis indicator mt5 in one tool Draw your supply demand zone with rectangle and support resistance with trendline and get alerts to mobile phone or email alert -  Risk reward indicator mt5 Video tutorials, manuals, DEMO download   here .   Find contacts on my   profile . 1.   Extended rectangles and trendlines Object will be extended to the right edge of the chart when price will draw new candles on chart. This is rectangle extend
    YuClusters
    Yury Kulikov
    4.93 (43)
    Attention: You can view the program operation in the free version  YuClusters DEMO .  YuClusters is a professional market analysis system. The trader has unique opportunities to analyze the flow of orders, trade volumes, price movements using various charts, profiles, indicators, and graphical objects. YuClusters operates on data based on Time&Sales or ticks information, depending on what is available in the quotes of a financial instrument. YuClusters allows you to build graphs by combining da
    한 번의 클릭으로 거래할 수 있는 거래 패널.   위치 및 주문 작업!   차트 또는 키보드에서 거래. 당사의 거래 패널을 사용하면 차트에서 직접 클릭 한 번으로 거래를 실행할 수 있으며 표준 MetaTrader 컨트롤보다 30배 빠르게 거래 작업을 수행할 수 있습니다. 매개변수와 기능의 자동 계산을 통해 트레이더는 더욱 빠르고 편리하게 거래할 수 있습니다. 그래픽 팁, 정보 라벨, 무역 거래에 대한 전체 정보는 MetaTrader 차트에 있습니다. MT4 버전 전체 설명   +DEMO +PDF 구입 방법 설치하는 방법     로그 파일을 얻는 방법     테스트 및 최적화 방법     Expforex의 모든 제품 열기 및 닫기, 반전 및 잠금, 부분 닫기/오토로트. 가상/실제 손절매/이익 실현/후행 정지/손익분기점, 주문 그리드 ... MetaТrader 5   의 주요 주문 거래 컨트롤 패널: 구매, 판매, 구매 중지, 구매 제한, 판매 중지, 판매 제한, 닫기, 삭제
    ManHedger MT5
    Peter Mueller
    5 (2)
    If you'd like to test the product before purchasing please watch the video below. The program doesn't work in the strategy tester! Contact me for user support & advices! If you've bought this EA, you are entitled to a gift!! MT4 Version  With this Expert Advisor, you can: Implement your own Zone Recovery strategy to capitalize on trending markets. Create Grid trading strategies, to profit from ranging markets. Place orders easily and clearly. Display your trades/strategies on the chart. Display
    Trade Assistant GS mt5
    Vasiliy Strukov
    5 (13)
    거래 패널은 주문 관리로 제한됩니다. 버튼을 사용하여 열거나 사용자가 열 수 있습니다. 컬렉션에서 간단하고 편리합니다. 모든 구매자를 보완합니다. Gold Stuff 표시기와 함께 사용하는 것이 좋습니다. 단일 주문으로 거래를 설정하고 거리가 있는 그리드를 구축하십시오. 표준 그리드를 만들려면 10000과 같이 큰 거리를 설정하기만 하면 됩니다. 실시간 결과는 여기에서 볼 수 있습니다. 설정 및 개인 보너스를 받으려면 구매 후 즉시 저에게 연락하십시오!   설정 새 시리즈 열기 - 새 주문 시리즈의 온/오프 시작. Lot miltiplier - 다음 주문에 대한 로트 승수. TP - 핍으로 이익을 얻습니다. SL - 손절매, 첫 주문부터 핍 단위. 트레일 시작 - 트레일링 스톱 활성화. 트레일 스텝 - 트레일링 스톱을 활성화할 때 가격으로부터의 거리. DD 감소 알고리즘 - 수익이 있는 마지막 주문이 손실이 있는 첫 번째 주문 시리즈와 마감될 때 손실 감소 알고리즘입
    Ultimate Trailing Stop EA MT5
    BLAKE STEVEN RODGER
    4.57 (7)
    This EA Utility allows you to manage (with advanced filtering) unlimited open orders (manual or EA) with 16 trailing stop methods: fixed, percent, ATR Exit, Chandelier Exit, Moving Average, Candle High Low Exit, Bollinger Bands, Parabolic, Envelope, Fractal, Ichimoku Kijun-Sen, Alligator, Exit After X Minutes or Bars, RSI and Stochastic. The trailing stop can be either real or virtual, and you can exit fully or with a partial close percent on touch or bar close.  Moreover, you can add (overri
    제작자의 제품 더 보기
    1. Why did I develop this series of indicators I found that most traders need to use multiple time frame indicators. They usually switch time frame to see indicators. However, once the timeframe is switched, you cannot see the  corresponding relationship  between  the price in the smaller timeframe  and  the indicator in the larger timeframe . For example: if your price chart is in H1 timeframe, you can see H4, D1 and W1 indicators in H1 timeframe Chart. This is more helpful for you to find t
    This product can be used to synchronize multiple Charts, and each Chart can be set to a different sync mode. With this product you can better view and manipulate charts: different time frames for a single Symbol, the same time frame for multiple Symbols, system indicators for single/multiple Symbols... and more. Feature: Chart settings can be synchronized, including : background, indentation, size, etc. Multiple Chart window start times  or end times can be synchronized. Multiple Chart time f
    Do you think it's a bit cumbersome when you need to switch symbols or timeframes with mouse click? 1. What is this? This is a program that can switch symbols and timeframes with direction keys. Fast switching, very convenient, no mouse click required. For traders, one symbol with multi-timeframe charts are usually added,  you can change symbol on those charts easily. For multi-currency traders, different symbol charts are usually added, you can also change those timeframes easily. I wrote this p
    This product can be used to synchronize multiple Charts, and each Chart can be set to a different sync mode. With this product you can better view and manipulate charts: different time frames for a single Symbol, the same time frame for multiple Symbols... and more. PS: The link below is the FreeDemo product, you can use it on EURUSD/XUAUSD/USDCNH symbol: https://www.mql5.com/en/market/product/38557 Feature: Chart settings  can be synchronized, including : background, indentation, size, etc.
    Have you ever take a long time to watch a Symbol when the network link is not good ? Have you ever wait for a long time when you switch chart between different Symbols or different TimeFrames ? If you do long-term backtesting , Have you ever to be downloaded datas for a long time ? Yes, If there is no data in the system, those will happen.  1. What is this: Download all the Symbol data in Market Watch to the system. PS: This is not outputting data to Files. This Link go to Demo version: https:
    1. What is this         Rising volatility and falling volatility are not the same, whether it is academic research or actual testing has shown this point.         The original ATR indicator is calculated by putting up and down fluctuations together. This indicator is to calculate separately the upward volatility and the downward volatility, which can better help you study the market. 2. Indicator description          There are two modes for the calculation of this indicator, as shown in the f
    I see that many tools in the market deal with Position and Order in the form of operation panels. Which is loaded into a Chart in the form of an EA. However, once the operator panel EA is loaded, no other EAs can be loaded. So, I wrote the one-click operation of Position and Order as a script, so you can load other EAs and easily complete one-click operation of Trade. 1. What is this: This is a one-click script to close position order. Now you can close position tickets at high speed, for examp
    I see that many tools in the market deal with Position and Order in the form of operation panels. Which is loaded into a Chart in the form of an EA. However, once the operator panel EA is loaded, no other EAs can be loaded. So, I wrote the one-click operation of Position and Order as a script, so you can load other EAs and easily complete one-click operation of Trade. 1. What is this: This is a one-click script to delete the pending order . Now you can delete pending tickets at high speed, for
    Do you think it's a bit cumbersome when you need to switch symbols or timeframes with mouse click? 1. What is this? This is a program that can switch symbols and timeframes with direction keys. Fast switching, very convenient, no mouse click required. For traders, one symbol with multi-timeframe charts are usually added,  you can change symbol on those charts  easily . For multi-currency traders, different symbol charts are usually added, you can also change those timeframes easily. I wrote thi
    According to trading experience: Some symbols are easy to reverse on certain days, such as Monday, or afternoon, and so on. So comparing the current price with the corresponding historical moment price is valuable. If the price coordinate system uses a logarithmic price, you will get a lot of valuable information. 1. What is this? This program can convert the symbol price and add it to your Chart. You can compare it with your major chart. The DEMO version Link: https://www.mql5.com/en/market/p
    What is this: Violent trading: means sending a large number of orders to your brokerage server,  it can conduct a stress test of the trading. In this program you can run a variety of trading tests.  Now you can trade at high speed, For example 1000 orders in an instant. The Demo version's link:  https://www.mql5.com/en/market/product/38431/ Why to use: Whether manual trading or EA trading,  the status of the broker server is very important. So it is beneficial to conduct a trading stress test on
    1. Why did I develop this series of indicators I found that most traders need to use multiple time frame indicators. They usually switch time frame to see indicators. However, once the timeframe is switched, you cannot see the  corresponding relationship  between  the price in the smaller timeframe  and  the indicator in the larger timeframe . For example: if your price chart is in H1 timeframe, you can see H4, D1 and W1 indicators in H1 timeframe Chart. This is more helpful for you to find t
    1. Why did I develop this series of indicators I found that most traders need to use multiple time frame indicators. They usually switch time frame to see indicators. However, once the timeframe is switched, you cannot see the  corresponding relationship  between  the price in the smaller timeframe  and  the indicator in the larger timeframe . For example: if your price chart is in H1 timeframe, you can see H4, D1 and W1 indicators in H1 timeframe Chart. This is more helpful for you to find t
    1. Why did I develop this series of indicators I found that most traders need to use multiple time frame indicators. They usually switch time frame to see indicators. However, once the timeframe is switched, you cannot see the  corresponding relationship  between  the price in the smaller timeframe  and  the indicator in the larger timeframe . For example: if your price chart is in H1 timeframe, you can see H4, D1 and W1 indicators in H1 timeframe Chart. This is more helpful for you to find t
    1. Why did I develop this series of indicators I found that most traders need to use multiple time frame indicators. They usually switch time frame to see indicators. However, once the timeframe is switched, you cannot see the  corresponding relationship  between  the price in the smaller timeframe  and  the indicator in the larger timeframe . For example: if your price chart is in H1 timeframe, you can see H4, D1 and W1 indicators in H1 timeframe Chart. This is more helpful for you to find t
    1. Why did I develop this series of indicators I found that most traders need to use multiple time frame indicators. They usually switch time frame to see indicators. However, once the timeframe is switched, you cannot see the  corresponding relationship  between  the price in the smaller timeframe  and  the indicator in the larger timeframe . For example: if your price chart is in H1 timeframe, you can see H4, D1 and W1 indicators in H1 timeframe Chart. This is more helpful for you to find t
    1. Why did I develop this series of indicators I found that most traders need to use multiple time frame indicators. They usually switch time frame to see indicators. However, once the timeframe is switched, you cannot see the  corresponding relationship  between  the price in the smaller timeframe  and  the indicator in the larger timeframe . For example: if your price chart is in H1 timeframe, you can see H4, D1 and W1 indicators in H1 timeframe Chart. This is more helpful for you to find t
    1. Why did I develop this series of indicators I found that most traders need to use multiple time frame indicators. They usually switch time frame to see indicators. However, once the timeframe is switched, you cannot see the  corresponding relationship  between  the price in the smaller timeframe  and  the indicator in the larger timeframe . For example: if your price chart is in H1 timeframe, you can see H4, D1 and W1 indicators in H1 timeframe Chart. This is more helpful for you to find t
    1. Why did I develop this series of indicators I found that most traders need to use multiple time frame indicators. They usually switch time frame to see indicators. However, once the timeframe is switched, you cannot see the  corresponding relationship  between  the price in the smaller timeframe  and  the indicator in the larger timeframe . For example: if your price chart is in H1 timeframe, you can see H4, D1 and W1 indicators in H1 timeframe Chart. This is more helpful for you to find t
    1. Why did I develop this series of indicators I found that most traders need to use multiple time frame indicators. They usually switch time frame to see indicators. However, once the timeframe is switched, you cannot see the  corresponding relationship  between  the price in the smaller timeframe  and  the indicator in the larger timeframe . For example: if your price chart is in H1 timeframe, you can see H4, D1 and W1 indicators in H1 timeframe Chart. This is more helpful for you to find t
    1. Why did I develop this series of indicators I found that most traders need to use multiple time frame indicators. They usually switch time frame to see indicators. However, once the timeframe is switched, you cannot see the  corresponding relationship  between  the price in the smaller timeframe  and  the indicator in the larger timeframe . For example: if your price chart is in H1 timeframe, you can see H4, D1 and W1 indicators in H1 timeframe Chart. This is more helpful for you to find t
    1. Why did I develop this series of indicators I found that most traders need to use multiple time frame indicators. They usually switch time frame to see indicators. However, once the timeframe is switched, you cannot see the  corresponding relationship  between  the price in the smaller timeframe  and  the indicator in the larger timeframe . For example: if your price chart is in H1 timeframe, you can see H4, D1 and W1 indicators in H1 timeframe Chart. This is more helpful for you to find t
    1. Why did I develop this series of indicators I found that most traders need to use multiple time frame indicators. They usually switch time frame to see indicators. However, once the timeframe is switched, you cannot see the  corresponding relationship  between  the price in the smaller timeframe  and  the indicator in the larger timeframe . For example: if your price chart is in H1 timeframe, you can see H4, D1 and W1 indicators in H1 timeframe Chart. This is more helpful for you to find t
    1. Why did I develop this series of indicators I found that most traders need to use multiple time frame indicators. They usually switch time frame to see indicators. However, once the timeframe is switched, you cannot see the  corresponding relationship  between  the price in the smaller timeframe  and  the indicator in the larger timeframe . For example: if your price chart is in H1 timeframe, you can see H4, D1 and W1 indicators in H1 timeframe Chart. This is more helpful for you to find t
    1. Why did I develop this series of indicators I found that most traders need to use multiple time frame indicators. They usually switch time frame to see indicators. However, once the timeframe is switched, you cannot see the  corresponding relationship  between  the price in the smaller timeframe  and  the indicator in the larger timeframe . For example: if your price chart is in H1 timeframe, you can see H4, D1 and W1 indicators in H1 timeframe Chart. This is more helpful for you to find t
    1. Why did I develop this series of indicators I found that most traders need to use multiple time frame indicators. They usually switch time frame to see indicators. However, once the timeframe is switched, you cannot see the  corresponding relationship  between  the price in the smaller timeframe  and  the indicator in the larger timeframe . For example: if your price chart is in H1 timeframe, you can see H4, D1 and W1 indicators in H1 timeframe Chart. This is more helpful for you to find t
    1. Why did I develop this series of indicators I found that most traders need to use multiple time frame indicators. They usually switch time frame to see indicators. However, once the timeframe is switched, you cannot see the  corresponding relationship  between  the price in the smaller timeframe  and  the indicator in the larger timeframe . For example: if your price chart is in H1 timeframe, you can see H4, D1 and W1 indicators in H1 timeframe Chart. This is more helpful for you to find t
    1. Why did I develop this series of indicators I found that most traders need to use multiple time frame indicators. They usually switch time frame to see indicators. However, once the timeframe is switched, you cannot see the  corresponding relationship  between  the price in the smaller timeframe  and  the indicator in the larger timeframe . For example: if your price chart is in H1 timeframe, you can see H4, D1 and W1 indicators in H1 timeframe Chart. This is more helpful for you to find t
    1. Why did I develop this series of indicators I found that most traders need to use multiple time frame indicators. They usually switch time frame to see indicators. However, once the timeframe is switched, you cannot see the  corresponding relationship  between  the price in the smaller timeframe  and  the indicator in the larger timeframe . For example: if your price chart is in H1 timeframe, you can see H4, D1 and W1 indicators in H1 timeframe Chart. This is more helpful for you to find t
    1. Why did I develop this series of indicators I found that most traders need to use multiple time frame indicators. They usually switch time frame to see indicators. However, once the timeframe is switched, you cannot see the  corresponding relationship  between  the price in the smaller timeframe  and  the indicator in the larger timeframe . For example: if your price chart is in H1 timeframe, you can see H4, D1 and W1 indicators in H1 timeframe Chart. This is more helpful for you to find t
    필터:
    Аврора
    84
    Аврора 2021.10.15 03:47 
     

    사용자가 평가에 대한 코멘트를 남기지 않았습니다

    리뷰 답변
    버전 1.4 2022.06.26
    Increase computing speed.
    버전 1.3 2021.11.26
    fix some bug.
    버전 1.2 2021.11.26
    Added functionality for adaptive brokers to automatically adjust data time zones.
    add the parameters:
    bool bool_BrokerAuto = true; // Whether the broker automatically adjusts the time zone, usually True.
    int Inp_utc = 3; // if the above is true, summer utc; if false summer or winter utc.
    버전 1.1 2021.10.13
    reset default parameters