• 미리보기
  • 리뷰
  • 코멘트

Wick Fill Trend Screener

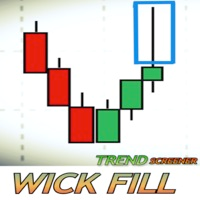
상거래에서 심지 란 무엇입니까? 이 스크리너는 어떻게 작동합니까?
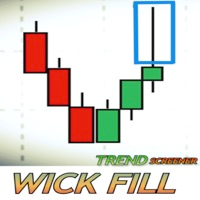
양초의 심지는 가격에 대한 거부를 나타냅니다. 이 스크리너는 채워질 가능성이 큰 심지를 식별하려고 시도합니다. 이 스크리너는 트렌드 시장에서 발생하는 심지에 초점을 맞춥니다.

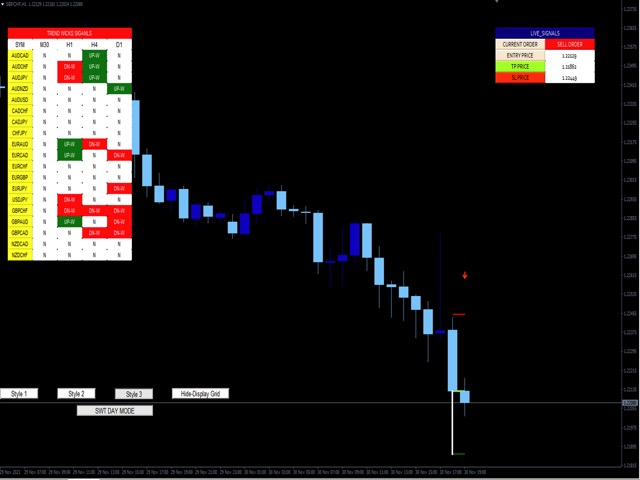
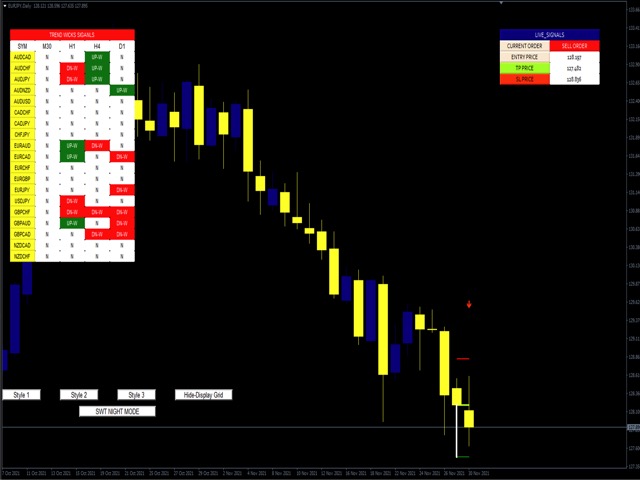
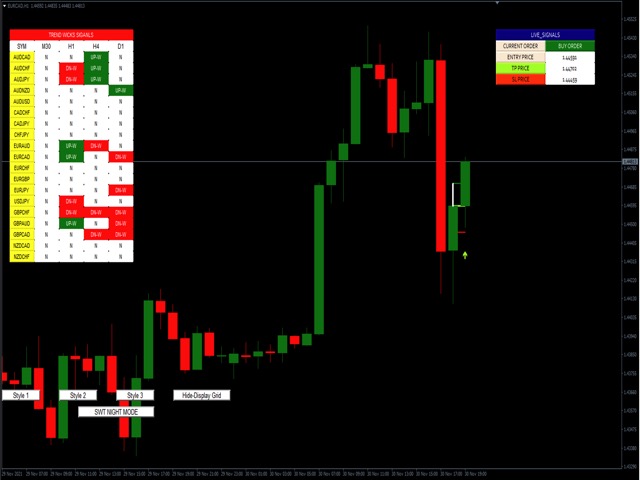
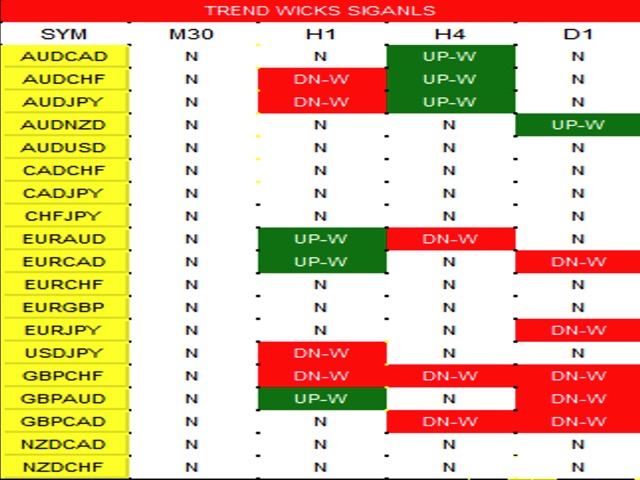
스크리너는 실시간으로 거래되는 잠재적 심지의 전체 보기를 제공하는 대시보드를 표시합니다. 시간 프레임별로 정렬된 모든 쌍/악기를 표시합니다. 구매 기회는 "UP-W"로 표시됩니다. 지정. 대시보드에 녹색으로 표시되고 기회의 이름이 "DN-W"이고 빨간색으로 표시됩니다. 거래자는 화면에 표시되는 대시보드에서 원하는 윅 기회를 클릭해야 하며 스크리너는 해당 특정 거래를 표시합니다. 스크리너는 거래자가 선택한 입력을 기반으로 기회를 표시합니다. 금 또는 US30과 같은 상품은 일반적으로 브로커에 따라 계약 크기가 다릅니다. 동일한 계약 크기의 쌍 또는 악기를 사용하십시오. 그렇지 않으면 계약 크기 쌍/도구 중 하나가 신호를 표시하지 않습니다.

-입력

추세 심지: 이 입력은 표시기가 스캔해야 하는 심지 크기를 결정합니다. %로 측정됩니다. 기본적으로 20%입니다.

-Number of Signals: 성공률 시뮬레이터를 위해 스캔할 신호의 수입니다.

-이동 평균: 이 필터는 이동 평균 지표와 RSI의 조합입니다. 사용자는 자신의 필요에 따라 RSI와 이동 평균을 설정할 수 있습니다.

- 이전 막대 방향: 이 기능은 이전 촛불을 기반으로 신호를 피하거나 허용합니다. true인 경우 표시기는 이전 캔들이 추세의 동일한 방향으로 갈 때만 심지를 신호로 간주합니다. 잘못된 경우 모든 심지가 고려됩니다.

최근 고점, 저점 막대: 이 기능을 사용하면 거래자는 마지막 "x" 막대에서 마지막 고점과 저점을 찾아 범위 기간을 피할 수 있습니다.

-최소 양초 크기: 이 입력은 심지를 스캔할 때 표시기가 고려할 최소 막대 크기입니다.

-최대 양초 크기: 이 입력은 심지를 검색할 때 표시기가 고려할 최대 막대 크기입니다.

손절매 비율: 기본적으로 양초의 HH 또는 LL의 손절매는 신호 양초와 같습니다. 이 기능을 사용하면 심지 신호를 기반으로 더 크거나 더 작은 정지 손실을 설정할 수 있습니다. 예를 들어 사용자가 2를 선택하면 양초의 심지를 기준으로 손절매가 2배가 됩니다.

- 쌍 목록: 이 설정은 스크리너에 표시되어야 하는 쌍/악기를 결정합니다. 다음 형식에 유의하십시오. EURUSD, AUDCAD, GBPNZD

*중개업체 목록에서 사용하는 경우 접두사 또는 접미사를 사용할 수 있습니다.

알람 설정: 이 표시기는 모바일 장치로 보낼 수 있는 알람을 가지고 있으며 알람 및 푸시 알림을 활성화합니다. 손에서 앱으로 신호를 받으려면 사용자가 먼저 MetaTrader 앱의 설정>채팅 및 메시지>에서 Metaquotes ID를 가져와야 합니다. 그런 다음 데스크톱 버전에서 도구>옵션>알림 ------으로 이동하여 메타따옴표 ID를 입력합니다. 그러면 실시간 신호 알림을 받게 됩니다.

전략을 테스트하거나 여기에서 기호를 사용하려면 Wick Fill Trend를 시도하십시오.


스타일이 중요하기 때문에

매번 속성을 클릭하여 초의 색상을 변경하고 배경을 밝거나 어둡게 만들고 격자를 삽입하거나 제거하는 것이 얼마나 성가신 일인지 압니다. 다음은 대부분의 제품에 구축한 원클릭 솔루션입니다.
  • 원하는 양초 스타일의 상인 선택을 위한 3개의 사용자 지정 가능한 버튼.
  • 낮과 밤 모드 사이를 전환하는 버튼입니다.
  • 차트에서 그리드를 표시하거나 숨기는 버튼입니다.
*****설정에서 화면에서 버튼을 표시할 위치를 선택할 수 있습니다.****

내 다른 제품도 확인하십시오 https://www.mql5.com/en/users/javimorales.fer/seller

작가

트레이딩 알고리즘의 창시자 Javier Morales.

추천 제품
Halley s comet
Marta Gonzalez
Halley´s comet   it is a Secure Automated Software for trade Forex market and indices. The architecture is a Fully Automatic Autonomous Robot Expert capable of Independently analyzing the market and making trading decisions Halley´s comet           It is an advanced trading system. This is a fully automatic Expert Advisor.      Halley´s comet   . It is a 100% automatic system,  The system is self-sufficient, performing all the work.     Is a revolution in the  customization of the trading.
Summary This indicator is based on RSI and Momentum indicators. It also considers moving averages of these two indicators. The three indicators have adjustable settings. The arrows do not repaint since the indicator only uses confirmed values and waits for the candle to close before painting an arrow. The indicator is also able to alert when arrows appear. There are 3 types of alerts - Popup, Email and Mobile Push Notifications. The arrows can be used in the EA and the inputs can also be optimiz
FREE
Mars 7 River
Marta Gonzalez
Mars 7 is a    Trend indicator  is a powerful indicator of TREND CHANGE  for any par and any timeframe. It doesn't requires any additional indicators for the trading setup.The indicator gives clear signals about opening and closing trades.This Indicator is a unique, high quality and affordable trading tool. Perfect For New Traders And Expert Traders Low risk entries. Never repaints signal. Never backpaints signal. Never recalculates signal. For MT4 Only Great For Scalping Great For Swing Trad
Speed Meter
Ahmed Soliman
XP Speed Meter the best indicator that measures the price/tick’s currency speed for you. It will give you the ability to know when the pair moving fast or slow . So, you can trade or not trade. It’s very important tool for scalper traders – news traders. Even for trend traders it will be useful to know if the market is trending fast or slow . XP Speed Meter is better than the volume type indicators of course. Because it shows the currency speed on the run-time without any lacking like what the v
SAWA Framework  is the perfect tool for automatic or manual trading ! How does it work? You can trade manually or use it in automatic mode with your own strategy. The expert advisor opens a position when all signals enabled agree on the direction of the trend. It includes 3 types of Money Management: Fix Lot. Auto-lot calculated with a percentage of the account Balance in risk. Auto-lot calculated with a multiplier of the previous position. 3 types of Martingales: Disable. Enable adding in p
R Var 이동 평균 지표는 완고한 추세 추종자를 위해 설계된 추세 추종 지표입니다. 그것은 주식 거래자뿐만 아니라 상품 거래자 사이에서 꽤 인기있는 외환 거래 지표이며 그 인기는 사용자에게 진정한 돈 버는 신호를 전달하는 능력에서 비롯됩니다. 표시기는 시에나 라인에 배치된 녹색 및 빨간색 점으로 구성됩니다. 녹색 점은 강세 신호를 가리키고 빨간색 점은 약세 신호를 나타냅니다. 기본 거래 신호 매수 신호: 지표의 시에나 선에 있는 점이 녹색으로 바뀌면 매수하세요. 매도 신호: 지표의 시에나 선에 있는 점이 빨간색으로 바뀌면 매도하십시오. 매수 거래 종료: 강세 추세가 진행되는 동안 표시기의 시에나 라인에 빨간색 점이 나타나면 모든 매수 주문을 닫습니다. 매도 거래 종료: 약세 추세가 진행되는 동안 R Var 이동 평균 지표의 시에나 선에 녹색 점이 표시되면 모든 매도 주문을 마감합니다. 팁 R Var 이동 평균 지표를 사용할 때 잘못된 신호를 방지하기 위해 적당한 손
Mars 10 The Bars Signal
Marta Gonzalez
3.5 (4)
Mars 10   is a  Oscillators  indicator is a powerful indicator of CHANGE DIRECCTION for any par and any timeframe. It doesn't requires any additional indicators for the trading setup.The indicator gives clear signals about opening and closing trades.This Indicator is a unique, high quality and affordable trading tool.  Can be used in combination with other indicators Perfect For New Traders And Expert Traders Low risk entries. Never repaints signal. Never backpaints signal. Never recalculat
Dow trend bands
Mariusz Piotr Rodacki
This indicator is not only for trading but also for learning, thanks to it, you can learn to identify trend, support and resistance. You've probably heard about the Dow trend theory, where higher highs and higher lows indicate an uptrend, and lower highs and lower lows indicate a downtrend. This indicator determines this trend based on the Dow Theory. You just need to enter a number representing the number of candles between extremes. The optimal solution is the number 3 (H1 TF), unless you
FREE
Multi-timeframe Parabolic SAR dashboard allows you to add and monitor PSAR trends. The multi-timeframe Parabolic SAR dashboard will save you a lot of time and gives you a single view of the markets using PSAR. In short, you can just view one window and get a snapshot of up to 21 instruments on your MT4 platform. The indicator opens in a sub-window. Below are the features of the PSAR Dashboard Indicator Modify PSAR Settings: The PSAR Dashboard comes with default PSAR settings of 0.02 (Step) and 0
EMA Dashboard
Chantal Sala
1 (1)
Ema Dashboard is an innovative dashboard that allows you to monitor Moving Average on multiples symbols and different timeframes. This dashboard allows you to analyze information on 28 pairs on an unique chart. Its functionality includes analysis of All Time Frames. This configuration allows you to identify the Long Term Trend with extreme ease. This panel allows you to take very important directional movements. A click on button opens a new chart (symbol and timeframe). Graphic Object Symbol
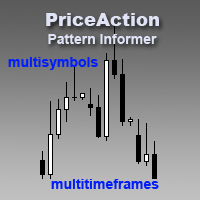
Pattern Informer is a convenient indicator for recognizing Price Action patterns on selected instruments. It presents a convenient overview form of all instruments on three timeframes (Н1, Н4, D1) in a single chart. It's an indispensable tool for manual trading based on the Price Action method. Pattern Informer recognizes the following patterns: PinBar Inside Bar Outside Bar DBLHC DBHLC TBL TBH Indicator Parameters symbols_list - the list of currency pairs separated by commas for which pattern
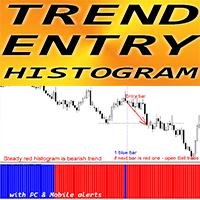
MT4용 외환 지표 "추세 진입 히스토그램" 추세 항목 히스토그램 표시기는 항목 막대가 나타나면 추세 방향에 대한 항목 신호를 검색하는 데 사용할 수 있습니다. 이 지표에는 고유한 기능이 있습니다. 계산에는 가격과 거래량이 모두 필요합니다. 추세 입력 히스토그램은 2가지 색상이 있습니다. 빨간색은 약세 추세이고 파란색은 강세 추세입니다. 꾸준한 추세(동일한 색상의 최소 10개 연속 히스토그램 막대)가 보이면 - 입력 막대를 기다립니다. 입력 신호는 히스토그램에서 반대 색상의 1열과 초기 추세 색상의 다음 열입니다(그림 참조). 짧은 목표 사용 - 현재 추세에 따라 차트에서 가장 가까운 고점/저점 표시기에는 모바일 및 PC 알림이 내장되어 있습니다. 사용 방법 표시기: - 매수 신호의 경우: 꾸준한 강세 추세(파란색 히스토그램 막대) 히스토그램의 +1 빨간색 막대 +1 파란색 막대(여기서 장기 거래 열기) - 매도 신호의 경우: 꾸준한 약세 추세(빨간색 히스토그램 막대) 히스
Atr Grid Maker Pro
AutoTrading Factory
This Expert Advisor uses ATR as CORE indicator for GRID operative.ATR measures intrinsec volatility. Using ATR on a GRID, you will give enought space between lines considering current volatility. On this EA, you can set ATR period and timeframe parameters, and also you can set a ATR multiplier factor, to increase margin between each GRID level. In the same way, you can also configure the number of GRID levels (up and down) as well as the color of the drawn lines. In addition, it has a start/
Mini FFMV Dashboard and CSM
Opengates Success International
1 (1)
Mini Forex Market-View Dashboard and Mini-CSM Mini Full Forex Market View Dashboard is a miniature creation of FULL FOREX MARKET_VIEW Custom indicator created to give the Traders a full view of what is going on in the market but in a partial matter to make it conscise. It is useful most especially for those who don't like bogus indicators or those who have a PC with limited screen size. It uses a real time data to access the market and display every bit of information needed to make a successful
Smart Help
Pavel Krysanov
3.67 (3)
The 'Smart Help' indicator is an excellent assistant for beginners and experienced traders. It consists of 3 parts: The first part provides entry and exit signals in the form of arrows. The up arrow is a signal of an uptrend, the down arrow indicates a downward trend. The second part shows the direction and strength of the current trend. The third part provides information on the currency pair state. The current price is indicated at the top. Below it are: the daily Low and High, the point dista
Oscillator helps determine the direction of the market Shows the direction of the price movement and is painted in the appropriate color. Allows you to conduct trend and counter trend trading It works on all timeframes, on any currency pairs, metals and cryptocurrency Can be used when working with binary options Distinctive features Does not redraw; Simple and clear settings; It works on all timeframes and on all symbols; Suitable for trading currencies, metals, options and cryptocurrency (Bitco
FREE
ForceX Trend
Yvan Musatov
ForceX Trend is a trend indicator that allows you to effectively determine the direction of the current trend, as well as identify potential reversal points. The indicator makes it possible to classify the direction of price movement by determining its strength. Solving this problem helps to enter the market in time and get the desired result. Let's start with the benefits. Allows you to determine the current trend. You can quickly understand what kind of trend is currently developing in th
This trading expert advisors is an clone & upgrade of  "EA Rough Duster ", also trades best on GBPNZD minute 5 timeframe. Maintains a constant account growth and runs best on low spread and commission based accounts. Uses Martingale & perfect hedging to recover unprofitable positions ensuring no loss. Its consistent profit curves,low DrawDowns & risk proves the record for itself in reliability and consistency plus its unique market analysis ensures quick extraction of profits by scalping the mar
Mars 6 is a  Oscillators  indicator  is a powerful indicator of  Break Zone  for any par and any timeframe. It doesn't requires any additional indicators for the trading setup.The indicator gives clear signals about opening and closing trades.This Indicator is a unique, high quality and affordable trading tool. Perfect For New Traders And Expert Traders Low risk entries. Never repaints signal. Never backpaints signal. Never recalculates signal. For MT4 Only Great For Scalping Great For Swing
Kill Zones MT4
Diego Arribas Lopez
MT5 Version Kill Zones Kill Zones allows you to insert up to 3 time zones in the chart. The visual representation of the Kill Zones in the chart together with an alert and notification system helps you to ignore fake trading setups occurring outside the Kill Zones or specific trading sessions. Using Kill Zones in your trading will help you filter higher probability trading setups. You should select time ranges where the market usually reacts with high volatility. Based on EST time zone, followi
Arah Trend
Edi Marsel
ARAH TREND is an indicator to detect the current trend, and predict next trend.  Its very simple way to know trend because   the display so clear. Trend changes are indicated by indicator color change. That's great as an entry point.  The advantages of this indicator : - Beautiful Entry Points - No Need Setting - Suitable for all time frames - Geat for GBPUSD and Gold TF H1 - The display is simple and clear It can also be combined with your mainstay indicator so that the entry point is more acc
For this set of indicators 1. General information     - Calculates with high performance mathematical algorithms.     - Calculated from the price of candles     - The entry point of this order is filtered by the train EMA and the oscillator.     - Calculate the integrity of the candle 2. How does it work?     - You can see two types of order entry points: the notification on the monitor and the arrow.     - You can trust 75-95 percent of this entry point. 3. Settings     - A complete candle
Calculated
Vitalii Zakharuk
Calculated trend indicator, can be used with an optimal risk to profit ratio, shows successful signals. Uses two options for settings. Shows favorable moments for entering the market with arrows. The probability of a successful trend is not very bad! The indicator can be used both for pipsing on small periods, and for long-term trading. The indicator does not redraw and does not lag. It works on all currency pairs and on all timeframes.
Global Trend
Vitalii Zakharuk
Global Trend Indicator, shows the signals for entry. Displays both entry points and the trend itself. Shows statistically calculated moments for entering the market with arrows. When using the indicator, the risk factor can be optimally distributed. Settings: Uses all one parameter for settings. Choosing a parameter, it is necessary to visually resemble it so that the appropriate graph has a projection of extremes. Parameters: Length - the number of bars for calculating the indicator.
Trend New
Vitalii Zakharuk
Trend New Trend Indicator, shows the signals for entry. Displays both entry points and the trend itself. Shows statistically calculated moments for entering the market with arrows. When using the indicator, it is possible to optimally distribute the risk factor. Settings: Uses all one parameter for settings. Selecting a parameter, it is necessary to visually resemble it so that the appropriate graph has a projection of extremes. Options: Length - the number of bars for calculating the ind
The advantages of EA TWO CANDLE SMART are: It is equipped with various filters, including: maxspread, maxlot, takeprofit (4 step), stop loss (3 step), profit target per day, and many more. Open order BUY = If iClose[2] > iOpen[2] && iClose[1] > iOpen[1]. Open order SELL = If iClose[2] < iOpen[2] && iClose[1] < iOpen[1]. Target_profit_perday=50; ==> can work on forward test. lockprofit=2;//Minimal Profit in money Step_LockProfit_in_Money=25; Stoploss_in_Money=1000; Stoploss_in %=50;==> Stoplos
Super volumes
Yerzhan Satov
4 (1)
The arrow indicator for Forex and Binary options is based on tick volumes. Unlike many volume indicators, the "Super volumes" indicator calculates bullish and bearish volumes and gives signals based on the predominance of any of them. If, say, there was an advantage of bullish volumes in this range at the moment, then the signal will be on Buy. Or if the predominance was bearish volumes, then, accordingly, the signal will be on Sell. In the indicator settings in the "volumes" variable, you ca
The Nihilist 5.0 Indicator includes Forexalien and Nihilist Easy Trend trading strategies and systems. It is composed of an MTF Dashboard where you can analyze the different input possibilities of each strategy at a glance. It has an alert system with different types of configurable filters. You can also configure which TF you want to be notified on your Metatrader 4 platform and Mobile application The indicator has the option to view how could be a TP and SL by using ATR or fixed points, even
KT Displaced Moving Averages MT4
KEENBASE SOFTWARE SOLUTIONS
KT DMA is a modified and advanced version of the classic Displaced Moving Averages with buy/sell crossover alerts and a Multi-Timeframe scanner that shows DMA's direction across each real-time time frame. A Displaced Moving Average is a simple moving average that moves ahead or backward in a time frame (either short-term or long-term). It also allows you to predict price movement more accurately. Features Depicts the trend direction using the alignment of three moving averages. Buy/Sell signa
MACD Divergence Finder
Segundo Calvo Munoz
MACD Divergence Finder Indicator will help you to find Divergences between your typical MACD values and the Chart Prices as potential points of actual Trend Reversion or Pull Backs to increase your positions as per the current Trend. Indicator Windows draws MACD value and Divergence arrows but not MACD Signal as it is not considered relevant to detect this kind of Classic Divergences. In some computer/VPS with old microprocessors or low RAM size, when you launch this Indicator (attach it, change
이 제품의 구매자들이 또한 구매함
맞춤형 MT4 지표로 성공적인 외환 거래에 대한 비밀을 발견하십시오! 외환 시장에서 성공을 달성하고 위험을 최소화하면서 일관되게 이익을 얻는 방법을 궁금해 한 적이 있습니까? 여기에 당신이 찾고 있던 답이 있습니다! 거래에 대한 귀하의 접근 방식을 혁신 할 독점적 MT4 지표를 소개 할 수 있습니다. 독특한 다양성 우리의 지표는 Renko 및 Rangebar Candle Formations를 선호하는 사용자를 위해 특별히 설계되었습니다. 우리는 이러한 차트 유형이 많은 숙련 된 거래자들이 선호한다는 것을 이해하기 때문에 우리의 지표가 그들과 완벽하게 통합되어 비교할 수없는 시장 분석을 제공합니다. 명확한 추세 신호 복잡한 분석을 잊어 버리십시오! 우리의 지표는 생생한 색상과 명확한 점 구조를 사용하여 시장 동향을 명확하게 나타냅니다. 빨간색과 파란색 점은 가격 이동 방향에 대해 의심의 여지가 없어 거래에서 빠른 의사 결정을 할 수 있습니다. HH/HL HL/LL
Atomic Analyst
Issam Kassas
5 (3)
우선적으로 언급할 점은이 거래 지표가 다시 그리지 않고 지연되지 않으며 이를 통해 수동 및 로봇 거래 모두에 이상적이라는 점입니다. 사용자 매뉴얼: 설정, 입력 및 전략. Atomic Analyst는 가격의 강도와 모멘텀을 활용하여 시장에서 더 나은 이점을 찾는 PA Price Action Indicator입니다. 고급 필터를 장착하여 잡음과 거짓 신호를 제거하고 거래 잠재력을 높이는 데 도움이 됩니다. 복잡한 지표의 다중 레이어를 사용하여 Atomic Analyst는 차트를 스캔하고 복잡한 수학적 계산을 간단한 신호와 색상으로 변환하여 초보 트레이더가 이해하고 일관된 거래 결정을 내릴 수 있도록합니다. "Atomic Analyst"는 새로운 및 경험이 풍부한 트레이더를위한 종합적인 거래 솔루션입니다. 프리미엄 지표와 최고 수준의 기능을 하나의 거래 전략에 결합하여 모든 종류의 트레이더에 대한 다재다능한 선택지가되었습니다. 인트라데이 거래 및 스캘핑 전략 : 빠르고 정확한
Advanced Currency Strength28 Indicator
Bernhard Schweigert
4.9 (663)
현재 26% 할인 초보자 또는 전문가 트레이더를 위한 최고의 솔루션! 이 지표는 우리가 독점 기능과 새로운 공식을 통합했기 때문에 독특하고 고품질이며 저렴한 거래 도구입니다. 단 하나의 차트로 28 Forex 쌍의 통화 강도를 읽을 수 있습니다! 새로운 추세 또는 스캘핑 기회의 정확한 트리거 포인트를 정확히 찾아낼 수 있기 때문에 거래가 어떻게 개선될지 상상해 보십시오. 사용 설명서: 여기를 클릭  https://www.mql5.com/en/blogs/post/697384 그것이 첫 번째, 원본입니다! 쓸모없는 지망생 클론을 사지 마십시오. 더 스페셜  강력한 통화 모멘텀을 보여주는 하위 창의 화살표 GAP가 거래를 안내합니다! 기본 또는 호가 통화가 과매도/과매도 영역(외부 시장 피보나치 수준)에 있을 때 개별 차트의 기본 창에 경고 표시가 나타납니다. 통화 강도가 외부 범위에서 떨어질 때 풀백/반전 경고. 교차 패턴의 특별 경고 추세를 빠르게 볼 수 있는
Advanced Supply Demand
Bernhard Schweigert
4.92 (310)
현재 33% 할인! 초보자나 전문 트레이더를 위한 최고의 솔루션! 이 보조지표는 우리가 다수의 독창적 기능과 새로운 공식을 통합한 독특하고 고품질이며 저렴한 거래 도구입니다. 이 업데이트를 통해 이중 시간대를 표시할 수 있습니다. 더 높은 TF를 표시할 수 있을 뿐만 아니라 차트 TF와 더 높은 TF 모두를 표시할 수 있습니다: 중첩 영역 표시. 모든 Supply Demand 트레이더들이 좋아할 것입니다. :) 중요한 정보 공개 Advanced Supply Demand의 잠재력을 극대화하려면 다음을 방문하십시오. https://www.mql5.com/ko/blogs/post/720245   진입 또는 목표의 명확한 트리거 포인트를 정확히 찾아냄으로 해서 거래가 어떻게 개선될지 상상해 보십시오. 새로운 알고리즘을 기반으로 매수자와 매도자 간의 잠재적인 불균형을 훨씬 더 쉽게 분간할 수 있습니다. 왜냐하면 가장 강한 공급영역과 가장 강한 수요 영역과 과거에 어떻게 진행 되었는지를(이
TPSpro RFI Levels
Roman Podpora
5 (13)
A key element in trading is zones or levels from which decisions to buy or sell a trading instrument are made. Despite attempts by major players to conceal their presence in the market, they inevitably leave traces. Our task was to learn how to identify these traces and interpret them correctly. Reversal First Impulse levels (RFI)   -  Version MT5                INSTRUCTIONS                 RUS                 ENG                                       R ecommended to use with an indicator   -  
ON Trade Optuma Astro
Abdullah Alrai
5 (4)
물론입니다. 아래는 제공해주신 텍스트의 한국어 번역입니다: MT4용 천문학 지표 소개: 귀하의 최상급 하늘 트레이딩 동반자 트레이딩 경험을 천체의 높이로 끌어올리기 준비가 되셨나요? MT4용 천문학 지표를 소개합니다. 이 혁신적인 도구는 복잡한 알고리즘의 힘을 활용하여 탁월한 천문학적 통찰과 정밀한 계산을 제공합니다. 정보의 우주를 손에 담다: 천문학적 데이터의 보물함을 드러내는 포괄적인 패널을 살펴보세요. 행성의 지오/헬리오센트릭 좌표, 태양/지구 거리, 크기, 길이, 별자리, 황도 좌표 및 적도 좌표, 심지어 수평 좌표 등 각각이 정밀하게 계산되고 아름답게 제시됩니다. 지표에 의해 생성된 수직선은 시간 값에 해당하여 트레이딩 여정에 우주적인 시각을 부여합니다. 행성 라인과 관계: 수정 가능한 스케일과 각도로 차트를 장식하는 행성 라인의 마법을 경험해보세요. 직관적인 컨트롤 패널을 통해 각 행성의 라인의 가시성을 손쉽게 전환할 수 있습니다. 쥰션이나 섹스타일, 사분각, 삼분각, 트
Quantum Trend Sniper Indicator MT4
Bogdan Ion Puscasu
4.59 (39)
소개       Quantum Trend Sniper Indicator는   추세 반전을 식별하고 거래하는 방식을 변화시키는 획기적인 MQL5 지표입니다! 13년 이상의 거래 경험을 가진 숙련된 트레이더 팀이 개발한       Quantum Trend Sniper 표시기       매우 높은 정확도로 추세 반전을 식별하는 혁신적인 방법으로 거래 여정을 새로운 차원으로 끌어올리도록 설계되었습니다. ***Quantum Trend Sniper Indicator를 구입하면 Quantum Breakout Indicator를 무료로 받을 수 있습니다!*** Quantum Trend Sniper Indicator는 추세 반전을 식별하고 세 가지 이익실현 수준을 제안할 때 경고, 신호 화살표를 제공합니다. 초보자 거래자와 전문 거래자 모두에게 적합합니다. Quantum EA 채널:       여기를 클릭하세요 MT5 버전:       여기를 클릭하세요
on free demo press zoom out button to see back.. cnt number is bar numbers.you can change up to 3000 related to chart bars numbers. minimum value is 500. there is g value set to 1.01. no need to change it. this indicator almost grail,no repaint and all pairs ,all timeframe indicator. there is red and blue histograms. if gold x sign comes on red histogram that is sell signal. if blue x sign comes on blue histogram that is buy signal. this indicator on thise version works all pairs.al timeframes
ON Trade Waves Patterns Harmonic Elliot Wolfe를 소개합니다. 이는 수동 및 자동 방법을 사용하여 다양한 시장 패턴을 감지하기 위해 개발된 고급 지표입니다. 다음은 그 작동 방식입니다: 조화적 패턴: 이 지표는 차트에 나타나는 조화적 패턴을 식별할 수 있습니다. 이러한 패턴은 Scott Carney의 "Harmonic Trading vol 1 및 2"에서 설명한 것처럼 조화적 거래 이론을 연습하는 트레이더에게 중요합니다. 수동으로 그리든 자동 감지를 사용하든 ON Trade Waves Patterns가 도움을 줄 것입니다. 컨트롤 패널: 이 지표에는 사용자 친화적인 컨트롤 패널이 있습니다. 차트 및 시간 프레임 설정을 저장하여 다양한 구성 간에 쉽게 전환할 수 있습니다. 차트 공간을 최대화하려면 최소화할 수도 있습니다. 다른 분석 도구를 사용하는 것을 선호하는 경우 닫기 버튼을 클릭하여 모든 지표 데이터를 숨길 수 있습니다. 템플릿 저장: 설정을 사
TPSproTREND PrO
Roman Podpora
5 (15)
TPSpro TRENDPRO  - is a trend indicator that automatically analyzes the market and provides information about the trend and each of its changes, as well as giving signals for entering trades without redrawing! The indicator uses each candle, analyzing them separately. referring to different impulses - up or down impulse. Exact entry points into transactions for currencies, crypto, metals, stocks, indices!  -  Version MT5               DETAILED DESCRIPTION        /       TRADING SETUPS           
Advanced Currency IMPULSE with ALERT
Bernhard Schweigert
4.91 (494)
현재 31% 할인!! 초보자 또는 전문가 트레이더를 위한 최고의 솔루션! 이 지표는 우리가 독점 기능과 비밀 공식을 통합했기 때문에 독특하고 고품질이며 저렴한 거래 도구입니다. 단 하나의 차트로 28개 통화 쌍 모두에 대한 경고를 제공합니다. 새로운 추세 또는 스캘핑 기회의 정확한 트리거 포인트를 정확히 찾아낼 수 있기 때문에 거래가 어떻게 개선될지 상상해 보십시오! 새로운 기본 알고리즘을 기반으로 구축되어 잠재적인 거래를 훨씬 더 쉽게 식별하고 확인할 수 있습니다. 이는 통화의 강세 또는 약세가 가속되는지 여부를 그래픽으로 표시하고 가속 속도를 측정하기 때문입니다. 자동차의 속도계처럼 생각하면 됩니다. 가속화할 때 Forex 시장에서 동일한 일이 분명히 더 빠르게 발생합니다. 즉, 반대 방향으로 가속화되는 통화를 페어링하면 잠재적으로 수익성 있는 거래를 식별한 것입니다. 통화 모멘텀의 수직선과 화살표가 거래를 안내합니다! 역동적인 Market Fibonacci 23
The BB Reversal Arrows technical trading system has been developed to predict reverse points for making retail decisions. The current market situation is analyzed by the indicator and structured for several criteria: the expectation of reversal moments, potential turning points, purchase and sale signals. The indicator does not contain excess information, has a visual understandable interface, allowing traders to make reasonable decisions. All arrows appear to close the candle, without redr
Up down v6T
Guner Koca
5 (1)
Thise indicator is up down v6  comes with tradingwiev pinescript. purchased people, after installed on terminal ,contact me on mql5  to get BONUS  TradingView pinescript. up-down indicator is no repaint and works all pairs and lower than weekly time frames charts. it is suitable also 1 m charts for all pairs. and hold long way to signal. dont gives too many signals. when red histogram cross trigger line that is up signal.and price probably will down when blue histogram cross trigger line that
Entry Points Pro
Yury Orlov
4.7 (225)
다시 색을 칠하지 않고 거래에 진입할 수 있는 정확한 신호를 제공하는 MT4용 지표입니다. 외환, 암호화폐, 금속, 주식, 지수 등 모든 금융 자산에 적용할 수 있습니다. 매우 정확한 추정값을 제공하고 매수와 매도의 가장 좋은 시점을 알려줍니다. 하나의 시그널로 수익을 내는 지표의 예와 함께 비디오 (6:22)시청하십시오! 대부분의 거래자는 Entry Points Pro 지표의 도움으로 첫 거래 주 동안 트레이딩 결과를 개선합니다. 저희의   Telegram Group 을 구독하세요! Entry Points Pro 지표의 좋은점. 재도색이 없는 진입 신호 신호가 나타나고 확인되면(시그널 캔들이 완성된 경우) 신호는 더 이상 사라지지 않습니다. 여타 보조지표의 경우 신호를 표시한 다음 제거되기 때문에 큰 재정적 손실로 이어집니다. 오류 없는 거래 게시 알고리즘을 통해 트레이드(진입 또는 청산)를 할 이상적인 순간을 찾을 수 있으며, 이를 통해 이를 사용하는 모든 거래자의
현재 20% 할인 ! 초보자 또는 전문가 트레이더를 위한 최고의 솔루션! 이 대시보드 소프트웨어는 28개의 통화 쌍에서 작동합니다. 2가지 주요 지표(Advanced Currency Strength 28 및 Advanced Currency Impulse)를 기반으로 합니다. 전체 Forex 시장에 대한 훌륭한 개요를 제공합니다. 고급 통화 강도 값, 통화 이동 속도 및 모든(9) 시간대의 28 Forex 쌍에 대한 신호를 보여줍니다. 추세 및/또는 스캘핑 기회를 정확히 파악하기 위해 차트의 단일 지표를 사용하여 전체 시장을 볼 수 있을 때 거래가 어떻게 개선될지 상상해 보십시오! 잠재적인 거래를 식별하고 확인하면서 강력한 통화와 약한 통화를 더욱 쉽게 식별할 수 있도록 이 지표에 기능을 내장했습니다. 이 표시기는 통화의 강세 또는 약세가 증가 또는 감소하는지 여부와 모든 시간대에서 수행되는 방식을 그래픽으로 보여줍니다. 추가된 새로운 기능은 현재 시장 조건 변화에 적
Symbols must be separated by commas (,) and entered into the parameters exactly as displayed by your broker to ensure they are recognized in the dashboard. These symbols will be used for analysis by the indicator. With one click open any pair any timeframe directly from dashboard The MA Speedometer Dashboard is a highly functional MetaTrader 4 (MT4) indicator designed to enhance trading strategies through dynamic market analysis. It offers robust features for identifying market trends, trading
TrendMaestro
Stefano Frisetti
5 (2)
note: this indicator is for METATRADER4, if you want the version for METATRADER5 this is the link:  https://www.mql5.com/it/market/product/108106 TRENDMAESTRO ver 2.4 TRENDMAESTRO recognizes a new TREND in the bud, he never makes mistakes. The certainty of identifying a new TREND is priceless. DESCRIPTION TRENDMAESTRO identifies a new TREND in the bud, this indicator examines the volatility, volumes and momentum to identify the moment in which there is an explosion of one or more of these data a
FX Power MT4 NG
Daniel Stein
5 (9)
모닝 브리핑 여기 mql5 와 텔레그램에서 FX Power MT4 NG 는 오랫동안 인기 있는 통화 강도 측정기인 FX Power의 차세대 버전입니다. 이 차세대 강도 측정기는 무엇을 제공합니까? 기존 FX Power에서 좋아했던 모든 것 PLUS GOLD/XAU 강도 분석 더욱 정밀한 계산 결과 개별 구성 가능한 분석 기간 더 나은 성능을 위한 사용자 정의 가능한 계산 한도 특별 멀티더 많은 것을보고 싶은 사람들을위한 특별한 다중 인스턴스 설정 모든 차트에서 좋아하는 색상을위한 끝없는 그래픽 설정 수많은 알림 옵션, 중요한 것을 다시는 놓치지 않도록 Windows 11 및 macOS 스타일의 둥근 모서리가 있는 새로운 디자인 마법처럼 움직이는 인디케이터 패널 FX 파워 키 특징 모든 주요 통화의 완전한 강세 이력 모든 시간대에 걸친 통화 강세 이력 모든 브로커 및 차트에서 고유 계산 결과 100% 신뢰할 수있는 실시간100 % 신뢰할 수있는 실시간 계산-> 다시 칠하지 않음
77% discount for the next 10 buyers (original price $605): 1 left 3 Indicators in 1 indicator Strategy based on price action Made specifically for the best forex currency pairs Can be used in the best time frame of the market at a very reasonable price This indicator is basically 3 different indicatos . But we have combined these 3 indicators in 1 indicator so that you can use 3 indicators at the lowest price. All three strategies are based on price action. But based on different trends.
Quantum Breakout Indicator PRO
Bogdan Ion Puscasu
4.96 (26)
소개       Quantum Breakout PRO   , 브레이크아웃 존 거래 방식을 변화시키는 획기적인 MQL5 지표! 13년 이상의 거래 경험을 가진 숙련된 트레이더 팀이 개발한   Quantum Breakout PRO는   혁신적이고 역동적인 브레이크아웃 영역 전략으로 거래 여정을 새로운 차원으로 끌어올리도록 설계되었습니다. Quantum Breakout Indicator는 5개의 이익 목표 영역이 있는 브레이크아웃 영역의 신호 화살표와 브레이크아웃 상자를 기반으로 한 손절 제안을 제공합니다. 초보자 거래자와 전문 거래자 모두에게 적합합니다. Quantum EA 채널:       여기를 클릭하세요 MT5 버전 :   여기를 클릭하세요 중요한! 구매 후 설치 매뉴얼을 받으려면 개인 메시지를 보내주십시오. 추천: 기간: M15 통화쌍: GBPJPY, EURJPY, USDJPY,NZDUSD, XAUUSD 계정 유형: 스프레드가 매우 낮은 ECN, Ra
Scalper Inside PRO
Alexey Minkov
4.75 (57)
An exclusive indicator that utilizes an innovative algorithm to swiftly and accurately determine the market trend. The indicator automatically calculates opening, closing, and profit levels, providing detailed trading statistics. With these features, you can choose the most appropriate trading instrument for the current market conditions. Additionally, you can easily integrate your own arrow indicators into Scalper Inside Pro to quickly evaluate their statistics and profitability. Scalper Inside
Quantum Heiken Ashi PRO MT4
Bogdan Ion Puscasu
4.43 (7)
소개       Quantum Heiken Ashi PRO   차트 시장 동향에 대한 명확한 통찰력을 제공하도록 설계된 Heiken Ashi 양초는 노이즈를 필터링하고 잘못된 신호를 제거하는 기능으로 유명합니다. 혼란스러운 가격 변동에 작별을 고하고 더 매끄럽고 신뢰할 수 있는 차트 표현을 만나보세요. Quantum Heiken Ashi PRO를 정말 독특하게 만드는 것은 전통적인 촛대 데이터를 읽기 쉬운 색상 막대로 변환하는 혁신적인 공식입니다. 빨간색과 녹색 막대는 각각 약세와 강세 추세를 우아하게 강조하여 잠재적 진입점과 퇴장점을 매우 정확하게 파악할 수 있습니다. Quantum EA 채널:       여기를 클릭하세요 MT5 버전:       여기를 클릭하세요 이 놀라운 지표는 다음과 같은 몇 가지 주요 이점을 제공합니다. 선명도 향상: Heiken Ashi 바는 가격 변동을 완화하여 시장 추세를 보다 명확하게 나타내므로 유리한 거래 기회를 쉽게 식별할 수 있
Pro SMC Tool
The Anh Pham
5 (1)
Welcome to the world of SMC (Smart Money Concepts) Trading, where we empower traders with the tools and knowledge to make smarter trading decisions. Our latest addition to our suite of trading tools is the SMC Trading Pro indicator, version 1.0. Key Features: Major Market Structure Identification with BODY break. Order Block must be in Major Swing ( not Small Swing ). Order Block with Fair Value Gap Detection. Order Block in Discount | Premium zone. Filter for only Bullish, Bearish or All Order
우선적으로 이 거래 시스템은 다시 그리지 않고, 다시 그리지 않으며, 지연되지 않는 것을 강조할 가치가 있습니다. 이는 전문적인 거래에 이상적입니다. 온라인 강좌, 사용자 매뉴얼 및 데모. "스마트 서포트 앤 레지스턴스 트레이딩 시스템"은 새로운 및 경험 많은 트레이더를 위해 개발된 고급 지표입니다. 이 시스템은 외환 시장에서 정밀도와 신뢰감을 제공합니다. 이 포괄적인 시스템은 일일 거래 전략, 스윙 거래 전략, 지원 및 저항 전략, 캔들스틱 패턴 전략, VWAP 전략, 다중 시간대 추세 전략 등을 포함한 7개 이상의 전략, 10개의 지표 및 다양한 거래 방식을 결합합니다. 이 시스템은 화살표 신호, 진입 및 출구 지점, 거래 경보, 높은 시간대 추세 분석, 실시간 거래 모니터링 및 트렌드 및 볼륨 캔들 색상 제공합니다. 자동 지원 및 저항 감지로 다양한 시장 상황에서 신중한 결정을 돕는 다면적 인 지표입니다. 스마트 서포트 앤 레지스턴스 트레이딩 시스템은 프리미엄 및 강력한
EZT Trend
Tibor Rituper
4 (1)
EZT 추세 표시기는 추세, 하락세 및 진입 기회를 보여줍니다. 선택적 필터링과 모든 유형의 경고를 사용할 수 있습니다. 이메일 및 푸시 알림 알림이 추가됩니다. 우리는 또한 이 지표를 기반으로 EA를 개발 중이며 곧 제공될 예정입니다. 두 개의 컬러 히스토그램과 하나의 선으로 구성된 다기능 표시기입니다. 이는 추세 방향과 강도를 시각적으로 표현한 것이며, 선이나 히스토그램에서 여러 번 차이를 발견할 수 있습니다. 표시기는 자동 매개변수 설정과 잘 작동합니다. 이는 주어진 기간에 대해 미리 결정되어 있으므로 해당 설정으로 표시기를 사용하는 것이 좋습니다. 수동 모드에서는 자신만의 매개변수를 설정할 수 있습니다. 이는 다중 시간대(mtf) 표시기입니다. 이 지표는 MTF rsi, MTF cci 또는 MACD pro와 같은 다른 지표의 조합과 잘 작동합니다. 거래되는 상품의 변동성이 클수록 최상의 항목을 찾는 데 사용해야 하는 기간이 더 짧아집니다. 항상 더 높은 기간
Best Currency Strength Indicator
Tumelo Patrick Rakotsoane
4.55 (47)
Advanced Currency Strength Indicator The Advanced Divergence Currency Strength Indicator. Not only it breaks down all 28 forex currency pairs and calculates the strength of individual currencies across all timeframes , but, You'll be analyzing the WHOLE forex market in 1 window (In just 1 minute) . This indicator is very powerful because it reveals the true movements of the market.  It is highly recommended to  analyze charts knowing the performance of individual currencies or the countries ec
How to use Pair Trading Station Pair Trading Station is recommended for H1 time frame and you can use it for any currency pairs. To generate buy and sell signal, follow few steps below to apply Pair Trading Station to your MetaTrader terminal. When you load Pair Trading Station on your chart, Pair Trading station will assess available historical data in your MetaTrader platforms for each currency pair. On your chart, the amount of historical data available will be displayed for each currency pai
Price Action Entry Alerts
Stephen Sanjeeve Sahayam
5 (3)
이 지표는 매수 또는 매도 압력에 대한 모든 막대를 선별하고 볼륨이 가장 높은 4가지 유형의 캔들 패턴을 식별합니다. 이 양초는 여러 선형 필터를 사용하여 필터링되어 매수 또는 매도 신호를 표시합니다. 신호는 더 높은 시간 프레임 방향과 함께 거래량이 많은 시간에 거래될 때 가장 잘 작동합니다. 모든 필터는 사용자 정의가 가능하며 독립적으로 작동합니다. 버튼 클릭으로 단일 방향의 신호를 볼 수 있습니다. 또한 이 지표에는 의사 결정 과정을 지원할 수 있는 가장 중요한 가격 조치 및 스마트 머니 개념이 포함되어 있습니다. 하나의 도구에서 신호 및 거래 교육을 모두 제공합니다. 특징: 신호는 다시 칠하지 않습니다. Engulfing candles, Rejection candles, Expanded range candles 및 Pinbars를 식별합니다. 각 유효한 신호에 대해 여러 항목, 손절매 및 여러 이익 실현 수준을 표시합니다. 대량 세션으로 필터링합니다. 지원/저항 수준 및
RelicusRoad Pro
Relicus LLC
4.78 (139)
이제 $ 147 (몇 가지 업데이트 후 $ 499 증가) - 무제한 계정 (PCS 또는 MACS) RelicusRoad 사용 설명서 + 교육 비디오 + 비공개 Discord 그룹 액세스 + VIP 상태 시장을 보는 새로운 방법 RelicusRoad는 외환, 선물, 암호화폐, 주식 및 지수에 대한 세계에서 가장 강력한 거래 지표로서 거래자에게 수익성을 유지하는 데 필요한 모든 정보와 도구를 제공합니다. 우리는 초보자부터 고급까지 모든 거래자가 성공할 수 있도록 기술적 분석 및 거래 계획을 제공합니다. 미래 시장을 예측할 수 있는 충분한 정보를 제공하는 핵심 거래 지표입니다. 우리는 차트에서 말이 안 되는 여러 지표 대신 완전한 솔루션을 믿습니다. 타의 추종을 불허하는 매우 정확한 신호, 화살표 + 가격 조치 정보를 표시하는 올인원 표시기입니다. 강력한 AI를 기반으로 하는 RelicusRoad는 누락된 정보와 도구를 제공하여 교육하고 성공적인 트레이더인 트레이딩 전문
FX Volume
Daniel Stein
4.6 (35)
모닝 브리핑을 통해 세부 정보와 스크린샷으로 매일 시장 업데이트를 받으세요 여기 mql5 및 텔레그램에서 FX 거래량은 브로커의 관점에서 시장 심리에 대한 실제 통찰력을 제공하는 최초이자 유일한 거래량 지표입니다. 브로커와 같은 기관 시장 참여자가 외환 시장에서 어떤 포지션을 취하고 있는지에 대한 훌륭한 통찰력을 COT 보고서보다 훨씬 빠르게 제공합니다. 차트에서 이 정보를 직접 확인하는 것은 트레이딩의 진정한 판도를 바꾸고 획기적인 솔루션입니다. 다음과 같은 고유한 시장 데이터 인사이트의 이점 비율 는 통화의 매수/매도 포지션 비율을 백분율로 표시 비율 변화 는 선택한 기간 내 매수 비율과 비율 변화를 표시 총 거래량 는 해당 통화의 총 거래량(롱 및 숏)을 로트 단위로 보여줍니다 Volumes Long 는 해당 통화의 모든 롱 포지션의 거래량을 보여줍니다 Volumes Short 는 해당 통화의 모든 숏 포지션의 거래량을 보여줍니다 Net Long 는 순 롱 포지션의 거래량
제작자의 제품 더 보기
Stochastic Rsi Style MT5
Javier Morales Fernandez
스타일이 중요하기 때문에 촛불의 색상, 배경을 밝거나 어둡게 변경하고 격자를 넣거나 제거하기 위해 매번 속성을 클릭하는 것이 얼마나 성가신 일인지 압니다. 클릭 한 번으로 해결하는 방법은 다음과 같습니다. 차트에서 그리드를 표시하거나 숨기는 버튼 1개. 트레이더가 원하는 캔들 스타일을 선택할 수 있는 3개의 맞춤형 버튼. 주간 모드와 야간 모드 사이를 전환하는 버튼 1개. *****설정에서 화면에서 버튼을 표시할 위치를 선택할 수 있습니다.*** 내 다른 제품을 확인하는 것을 고려하십시오 https://www.mql5.com/en/users/javimorales.fer/seller 스토캐스틱 RSI란 무엇입니까? 스토캐스틱 RSI(StochRSI)는 0과 1(또는 일부 차트 플랫폼의 경우 0과 100) 범위의 기술적 분석에 사용되는 지표이며 스토캐스틱 오실레이터 공식을 상대 강도 지수(RSI) 값 세트에 적용하여 생성됩니다. 표준 가격 데이터보다 작가 트레이딩 알고리즘의 창시자 하비
FREE
Rsi Style
Javier Morales Fernandez
스타일이 중요하기 때문에 매번 속성을 클릭하여 초의 색상을 변경하고, 배경을 밝거나 어둡게 만들고, 격자를 삽입하거나 제거하는 것이 얼마나 성가신 일인지 압니다. 클릭 한 번으로 해결하는 방법은 다음과 같습니다. 트레이더가 원하는 캔들 스타일을 선택할 수 있는 3개의 맞춤형 버튼. 낮과 밤 모드 사이를 전환하는 버튼입니다. 차트에서 그리드를 표시하거나 숨기는 버튼입니다. *****설정에서 화면에서 버튼을 표시할 위치를 선택할 수 있습니다.**** 내 다른 제품도 확인하십시오 https://www.mql5.com/en/users/javimorales.fer/seller MT5 버전 확인: https://www.mql5.com/en/market/product/69070 RSI 지표는 무엇입니까? RSI는 0에서 100까지 측정할 수 있는 오실레이터로 표시됩니다. 이 지표는 J. Welles Wilder Jr.가 개발했으며 1978년 그의 저서 New Concepts in Technica
FREE
Stochastic Rsi Style
Javier Morales Fernandez
스타일이 중요하기 때문에 촛불의 색상, 배경을 밝거나 어둡게 변경하고 격자를 넣거나 제거하기 위해 매번 속성을 클릭하는 것이 얼마나 성가신 일인지 압니다. 클릭 한 번으로 해결하는 방법은 다음과 같습니다. 차트에서 그리드를 표시하거나 숨기는 버튼 1개. 트레이더가 원하는 캔들 스타일을 선택할 수 있는 3개의 맞춤형 버튼. 주간 모드와 야간 모드 사이를 전환하는 버튼 1개. *****설정에서 화면에서 버튼을 표시할 위치를 선택할 수 있습니다.*** 내 다른 제품을 확인하는 것을 고려하십시오 https://www.mql5.com/en/users/javimorales.fer/seller 스토캐스틱 RSI란 무엇입니까? 스토캐스틱 RSI(StochRSI)는 0과 1(또는 일부 차트 플랫폼의 경우 0과 100) 범위의 기술적 분석에 사용되는 지표이며 스토캐스틱 오실레이터 공식을 상대 강도 지수(RSI) 값 세트에 적용하여 생성됩니다. 표준 가격 데이터보다 작가 트레이딩 알고리즘의 창시자 하비
FREE
Wick Fill Trend
Javier Morales Fernandez
- 심지 채우기 트렌드 개념 시장에서 변동성이 큰 이벤트 동안 양초는 이동 중에 심지를 만드는 경향이 있습니다. 촛대의 심지는 가격의 거부를 반영합니다. 이 심지는 대부분 그 방향으로 밀리는 큰 양이 있기 때문에 채워집니다. Wick Fill Trend는 트렌드 시장에 중점을 둔 기회를 스캔합니다. 진입 점과 함께 라이브 신호를 표시하고 이익을 얻고 손실을 막는 성공률 시뮬레이터 대시 보드가 있습니다. 이 성공률 시뮬레이터는 백 테스트로 사용하여 과거에 더 나은 수익을 가진 입력을 확인할 수 있습니다. 핍과 백분율의 이익을 계산하여 과거 성과를 기반으로 사용하기에 가장 적합한 매개 변수가 무엇인지 전체적으로 알 수 있습니다. -   입력 - 트렌드 심지 :이 입력은 표시기가 스캔해야하는 심지의 크기를 결정합니다. %로 측정됩니다 %. 기본적으로 20 %입니다. - 신호 수 : 성공률 시뮬레이터를 위해 스캔 할 신호 수입니다. - 이동 평균 :이 필터는 이동 평
Stochastic RSI Alerts
Javier Morales Fernandez
확률 적 RSI 란 무엇입니까? 확률 적 RSI ( StochRSI )은 일부 차트 플랫폼 (에서 0과 1 ) 또는 0과 100 사이의 기술 분석에 사용되는 지표이며 확률 적 발진기를 적용하여 생성됩니다 표준 가격 데이터가 아닌 상대 강도 지수 ( RSI ) 값 세트에 대한 공식. 이 버전에는 실제로 좋은 기회를 놓치지 않도록 경고가 포함되어 있습니다. 신호 구매 주문 또는 신호 판매 주문을 받으려면 매개 변수를 설정합니다. 신호를 받으려면 MetaQuotes ID를 통해 데스크탑 버전을 Metatrader 앱과 연결해야합니다. MetaQuotes ID는 MT4 / 5 앱에서 > > 채팅 및 메시지 설정에 있습니다. 바탕 화면에 도구 > > > 옵션 > > 알림이 있습니다. 바탕 화면 버전에 ID를 입력하고 활성 알림을 표시하면 바로 사용할 수 있습니다. MT5 버전을 사용해보십시오  스타일이 중요하기 때문에 촛불의 색, 배경을 밝거나 어둡게 변경하고 그리드를 넣거나
Wick Fill Trend MT5
Javier Morales Fernandez
- 심지 채우기 트렌드 개념 시장에서 변동성이 큰 이벤트 동안 양초는 이동 중에 심지를 만드는 경향이 있습니다. 촛대의 심지는 가격의 거부를 반영합니다. 이 심지는 대부분 그 방향으로 밀리는 큰 양이 있기 때문에 채워집니다. Wick Fill Trend는 트렌드 시장에 중점을 둔 기회를 스캔합니다. 진입 점과 함께 라이브 신호를 표시하고 이익을 얻고 손실을 막는 성공률 시뮬레이터 대시 보드가 있습니다. 이 성공률 시뮬레이터는 백 테스트로 사용하여 과거에 더 나은 수익을 가진 입력을 확인할 수 있습니다. 핍과 백분율의 이익을 계산하여 과거 성과를 기반으로 사용하기에 가장 적합한 매개 변수가 무엇인지 전체적으로 알 수 있습니다. - 입력 - 트렌드 심지 :이 입력은 표시기가 스캔해야하는 심지의 크기를 결정합니다. %로 측정됩니다 %. 기본적으로 20 %입니다. - 신호 수 : 성공률 시뮬레이터를 위해 스캔 할 신호 수입니다. - 이동 평균 :이 필터는 이동 평균
Wick Fill Trend Screener MT5
Javier Morales Fernandez
상거래에서 심지 란 무엇입니까? 이 스크리너는 어떻게 작동합니까? 양초의 심지는 가격에 대한 거부를 나타냅니다. 이 스크리너는 채워질 가능성이 큰 심지를 식별하려고 시도합니다. 이 스크리너는 트렌드 시장에서 발생하는 심지에 초점을 맞춥니다. 스크리너는 실시간으로 거래되는 잠재적 심지의 전체 보기를 제공하는 대시보드를 표시합니다. 시간 프레임별로 정렬된 모든 쌍/악기를 표시합니다. 구매 기회는 "UP-W"로 표시됩니다. 지정. 대시보드에 녹색으로 표시되고 기회의 이름이 "DN-W"이고 빨간색으로 표시됩니다. 거래자는 화면에 표시되는 대시보드에서 원하는 윅 기회를 클릭해야 하며 스크리너는 해당 특정 거래를 표시합니다. 스크리너는 거래자가 선택한 입력을 기반으로 기회를 표시합니다. 금 또는 US30과 같은 상품은 일반적으로 브로커에 따라 계약 크기가 다릅니다. 동일한 계약 크기의 쌍 또는 악기를 사용하십시오. 그렇지 않으면 계약 크기 쌍/도구 중 하나가 신호를 표시하지 않습니다.
Stochastic RSI Alerts MT5
Javier Morales Fernandez
확률 적 RSI 란 무엇입니까? 확률 적 RSI ( StochRSI )은 일부 차트 플랫폼 (에서 0과 1 ) 또는 0과 100 사이의 기술 분석에 사용되는 지표이며 확률 적 발진기를 적용하여 생성됩니다 표준 가격 데이터가 아닌 상대 강도 지수 ( RSI ) 값 세트에 대한 공식. 이 버전에는 실제로 좋은 기회를 놓치지 않도록 경고가 포함되어 있습니다. 신호 구매 주문 또는 신호 판매 주문을 받으려면 매개 변수를 설정합니다. 신호를 받으려면 MetaQuotes ID를 통해 데스크탑 버전을 Metatrader 앱과 연결해야합니다. MetaQuotes ID는 MT4 / 5 앱에서 > > 채팅 및 메시지 설정에 있습니다. 바탕 화면에 도구 > > > 옵션 > > 알림이 있습니다. 바탕 화면 버전에 ID를 입력하고 활성 알림을 표시하면 바로 사용할 수 있습니다. MT4버전을 사용해보십시오  스타일이 중요하기 때문에 촛불의 색, 배경을 밝거나 어둡게 변경하고 그리드를 넣거나
필터:
리뷰 없음
리뷰 답변