MA Histogram Commercial
- 지표
- Szymon Palczynski
- 버전: 1.50
- 업데이트됨: 3 7월 2020
- 활성화: 5
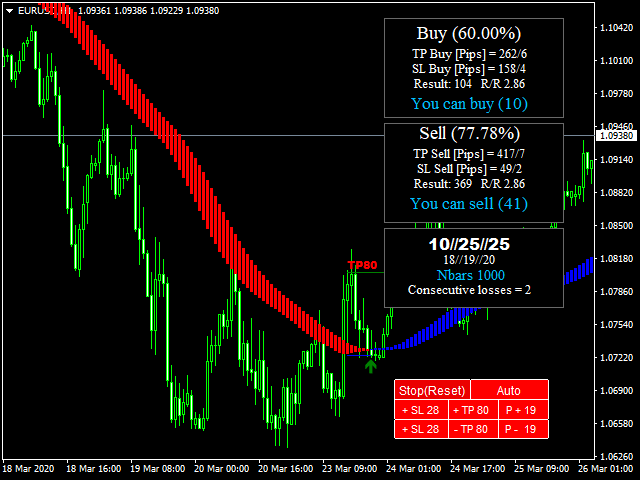
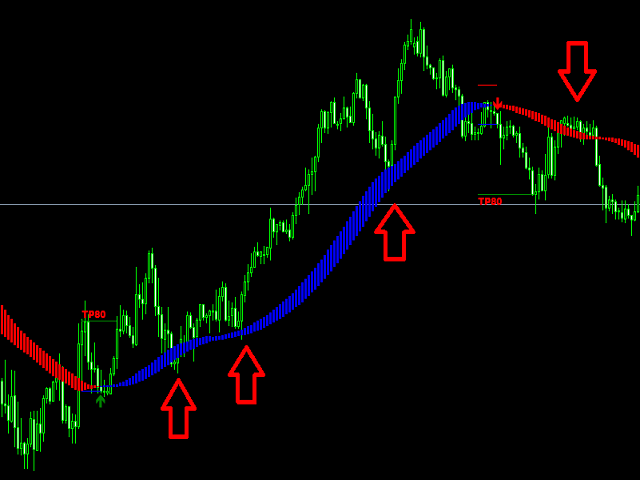
Commercial version of open code. A forex trader can create a simple trading strategy to take advantage trading opportunities using MA Histogram or associated indicators. MA Histogram are used primarily as trend indicators and also identify support and resistance levels.
Improved version 1.30
Added:
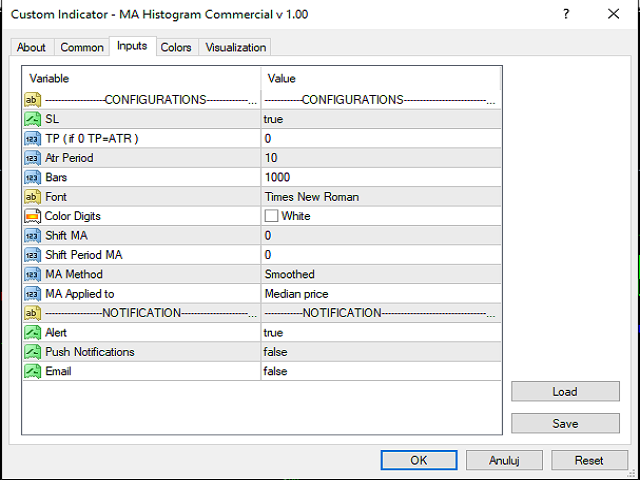
- Take Profit
- Stop Loss
- Automatic optimization
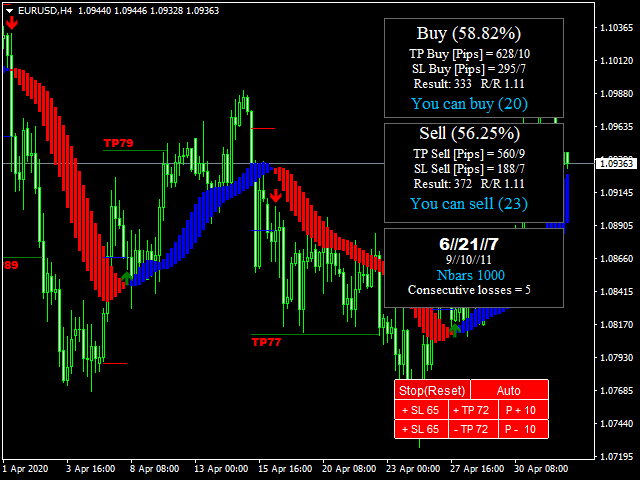
- Result
- R/R
- Consecutive losses


Great Indicator, just what I was looking for. clean coded and fast to detect the best parameter on any attached instrument. a must-have in trader's arsenal!
added the developer is very kind and cares about his project handled a custom request instantly. its not my first purchase from Szymon and sure won't be the last its hard to find a developer who really cares and continue to offer support