• 미리보기
  • 리뷰 (12)
  • 코멘트 (9)
  • 새 소식

RSImaxmin

4.5

The indicator shows when there are overprice and divergences on the RSI.

In addition, it has configurable alerts, dynamic overprice levels and a special “RSI cleaner” function.

The indicator that automatically calculates the premium rates!

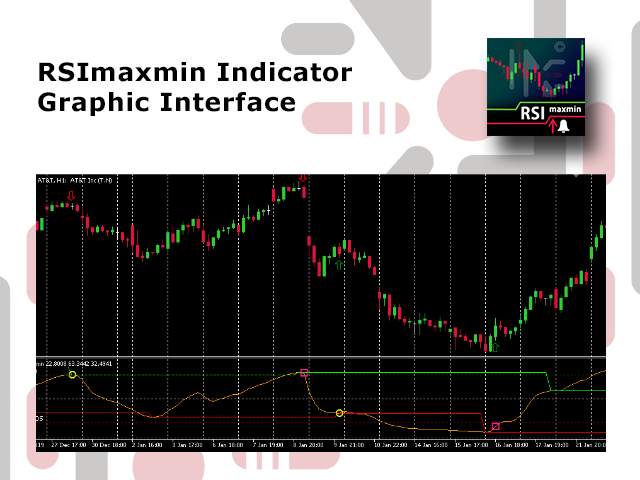
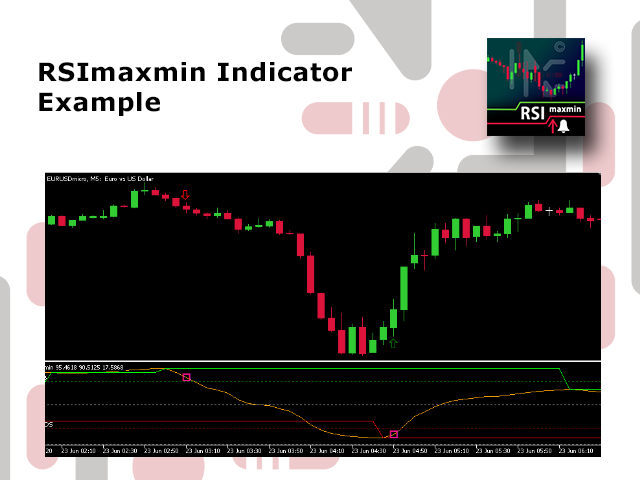
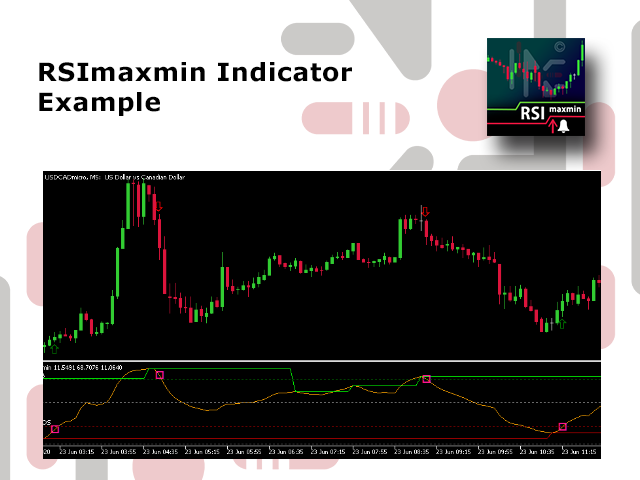
RSImaxmin is an indicator based on the Relative Strength Index (RSI) oscillator that effectively identifies changes in price trends as it reflects the relative strength of bullish movements compared to bearish movements. It is widely used by traders to measure the strength of a trend and identify end-of-trend signals.

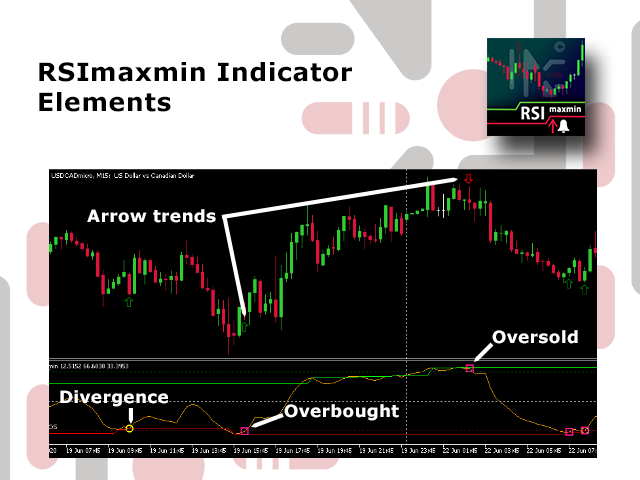
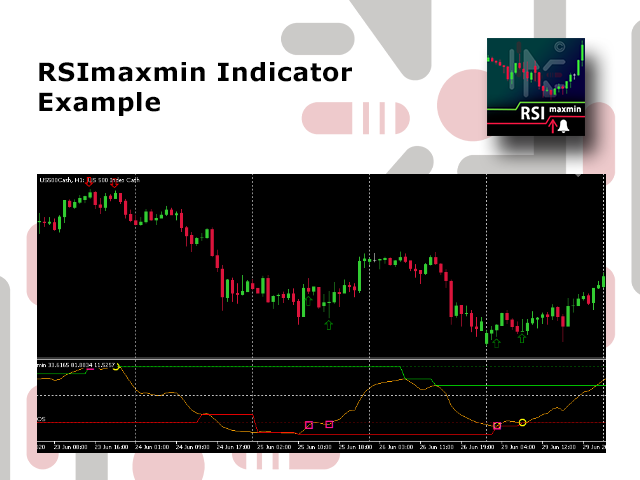
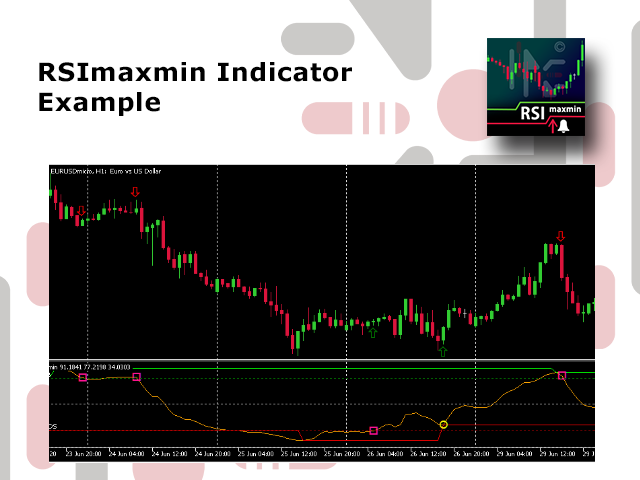
The RSImaxmin indicator provides valuable market information and signals of overbought, oversold, bullish divergence and bearish divergence that it detects automatically. These signals are represented in the oscillator as circles for divergence points and squares for overbougnt points. Immediately, you can receive configurable alerts of these signals.

In addition, this indicator has two unique characteristics; you can chart dynamic support and resistance levels that it automatically calculates according to the market to which it has been applied and the input parameters conveniently set by the trader. Overbought and oversold levels are also automatically calculated for each chart optimizing results.

The second unique feature of RSImaxmin is its “ cleaner RSI ” filter developed to reduce signal noise, this filter can be very useful to improve the effectiveness of a strategy.

Features

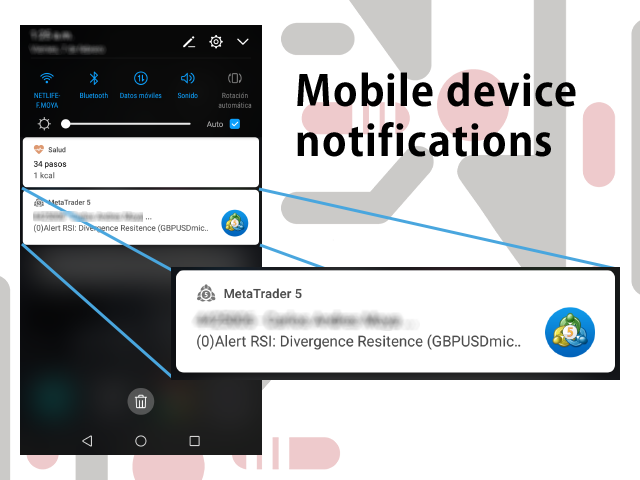
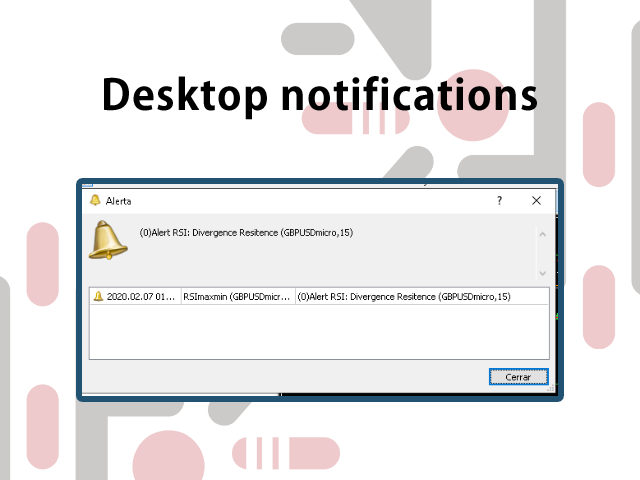
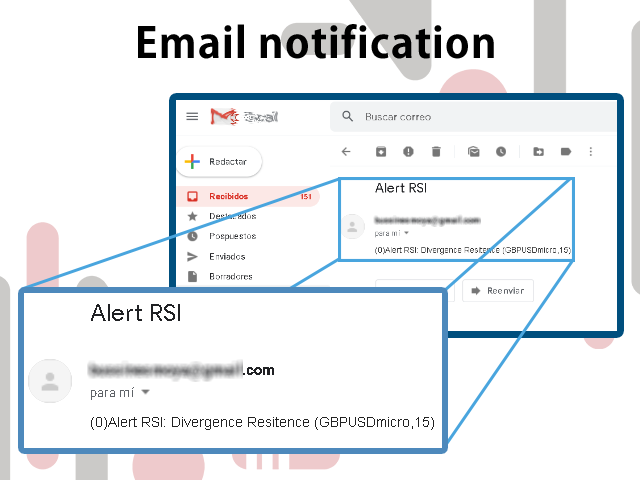
  • The indicator allows to generate alerts in different configurations (mobile application - Push, email, desktop application) when divergences and overpricing are detected
  • Alerts can be repeated for the same event to guarantee or to recognize the RSImaxmin
  • The RSImaxmin simplifies the parameters as much as possible, so that the trader can avoid complex settings
  • The RSImaxmin is valid for any asset and any time horizon
  • It can be used in strategies based solely on this indicator or it can be combined with other indicators
  • You can set the color of the indicator trend lines
  • Optimized and tested algorithm to ensure that it is always in service

contains:

  • Oscillatory line RSImaxmin
  • Two lines of dynamic levels of supports and resistances in the oscillator signal
  • Three fixed level lines, “resist OB", 50 and " support OS" (although you can add or remove lines at any level that the trader deems necessary in the setup)

Parameters

  • RSI Period is thecandlestick period used to calculate the value of the RSI oscillator
  • Tolerance to take as a max is the value used as a condition for accepting a peak as a new maximum
  • Tolerance to take as a min is the value used as a condition to accept a peak as a new minimum
  • Price and RSI calculation Kind the algorithm can use all forms of price calculation including HL/2, HLC/3 and HLCC/4  
  • Activate the cleaner RSI this is true if you want to use the filter on the oscillator to reduce signal noise
  • View divergence (circle) is true if you want to display circles in the oscillator at the points where divergence occurred
  • View overprice (square) is true if you want to display square in the oscillator at points where overpricing is detected
  • View trend in chart (arrow) is true if you want to see an arrow on the candlestick chart indicating the possible trend according to RSImaxmin oscillator.
  • View support and resist levels is true if you want to see support and resistance calculated automatically
  • Alert Settings This parameter allows you to choose the alerts you want to receive regarding the indicator. These can be:
    • alerts_ off 
    • maxmin_ Divergences 
    • max_ Divergences 
    • min_ Divergences 
    • overbought 
    • oversold 
    • overbought_ sold 
    • all_ alerts 
  • Alert Kind are the options that the program allows to notify you of an event (mobile application, email, desktop application). These can be:
    • Mobile (you must have this option activated on your MT5 platform)
    • Email (you must configure your MT5 platform to receive emails)
    • Desktop 
    • Alls choose 
  • Alert repetition per event these are the times you can repeat an alert for the same event. You can repeat an alarm 1, 3, 5 and 10 times as you think necessary

If you have any questions or suggestions, you can contact me via the following link.

리뷰 12
José Fábio RP
125
José Fábio RP 2023.10.26 16:23 
 

I have to say this indicator is wonderful. Thanks for working on it.

odymt5
175
odymt5 2021.10.05 13:54 
 

Thank you for an excellent indicator, easy to use.

Paul Bell
148
Paul Bell 2021.04.05 10:41 
 

very useful product

추천 제품
Sync In Many Ways MT5
Sa No Tsuyoshi Kokorozashi
Description This is a Utility tool for MT5 which will make our chart analysis task quite more efficient and save large amount of time. As for chart analysis, some are watching out several symbol simultaneously with single timeframe and others are trading only one single pair with   multi timeframe analysis. For both, a common troublesome issue is “scroll chart to look back” or “draw chart objects” in multi charts at the same time.  Especially for those who are trading with multi timeframe soluti
One Direction Pro is a combination of hedging, Grid averaging, pyramiding, lot martingale - anti martingale strategies, which aims to enter and exit the market as quickly as possible so as not to be trapped by unexpected market changes. Bot Explanation  |  MT4 version  |  Setfile:    pls  leave a message on the comment tab, I will send you the latest setfile Expert parameters: 1. Manage Open Positions + Trade Buy: allow buy + Trade Sell: allow sell + Select Entry Method + Period in bars
ADAM for FTMO 5
Vyacheslav Izvarin
5 (1)
ADAM EA Special Version for FTMO Please find new Version here  https://www.mql5.com/en/market/product/113326 Our 1st EA created using ChatGPT technology Trade only GOOD and checked PROP FIRMS  Default parameters for Challenge $100,000 Tested on EURUSD and GBPUSD only  Use 15MIN Time Frame Close all deals and Auto-trading  before Weekend at 12:00 GMT+3  Friday For Prop Firms MUST use special Protector  https://www.mql5.com/en/market/product/94362 Signal using ADAM  https://www.mql5.com/en/signa
Meditation Seed: Meditation is a practice in which an individual uses a technique – such as mindfulness, or focusing the mind on a particular object, thought, or activity – to train attention and awareness, and achieve a mentally clear and emotionally calm and stable state.[1][2][3][4][web 1][web 2] Meditation is practiced in numerous religious traditions. The earliest records of meditation (dhyana) are found in the Upanishads, and meditation plays a salient role in the contemplative repertoire
FREE
UPDATE MAR/20 OBS: Please after purchase contact US via CHAT to suport. This Product is a Market Scanner based on Didi Index Indicator. He can scan all time frames of Symbols in Market Watch, client can customize according the demand, its can scan a single symbol or more than 100. Manual: Link Driver Link do Manual Video:   LINK The Scanner informs 4 kind of signals, all alerts are providing from Didi Index Indicator: 1 - Didi Index - Alert of Buy : Cross up of "Curta" short moving averag
Time Closer can help you closing all the open position at the specified time "Everyday". Mainly for Day trader that don't want to hold position overnight, or over different session, or over a specific time. Simple Parameter to use. Usage Download and drag Time Closer on the chart (Chart Symbol should be the same Chart Symbol as you want the position close) Check Allow AutoTrading is "On" Set parameters Input Parameters Turnon  True - Turnon the utility False - Turnoff the utility Close all S
!! FLASH SALE !!   Over 80% off !!     For ONE week only. Now only $47 - normally $297! >>>      Ends on 30 June 2023 - Don't miss it! Buy and Sell Arrows On The Chart According To Price Action Sends Alerts On MT5 To Your Phone To You Email Does NOT repaint. Works on any pair, any timeframe.     10 Activations allowed so you are free from limitations. MT4 Version here . For spreads from a tiny 0.1 pips RAW/ECN Accounts,  click here . Check out my Waka Esque EA signal here: >>   High Ri
다중 통화 이전 캔들 또는 이전 막대 스캐너를 사용하면 지표 설정에서 선택한 사용자 정의 기간으로 다중 기호 차트를 스캔할 수 있습니다. 제품 기준 : https://www.mql5.com/en/market/product/78657 전날 고가, 전주 고가, 전월 고저 또는 사용자 정의 기간에 대한 다중 기호를 스캔하는 데 사용할 수 있습니다. 이전 4시간 차트 고저 노이즈를 필터링하고 가격이 고점 또는 저점에 도달할 때 방향 알림을 제공합니다. 전략은 간단합니다. 전날, 주 또는 월 최고가에 도달하면 5분과 같은 더 짧은 시간 내에 가격이 거부되는 것으로 보입니다. 다양한 경고 유형을 선택하는 옵션이 있습니다. 밀리초 단위로 스캔할 빈도를 선택하고 설정할 수 있습니다. 1000은 시장 시계의 모든 기호를 매초마다 검색한다는 의미입니다. 제품 특징 1. 터미널 알림 2. 이메일 알림 3. 푸시 알림
RSIScalperPro
PATRICK WENNING
RSIScalperPro를 소개합니다 - 메타트레이더 5용 RSI 기반의 혁신적인 인디케이터로, 1분 차트에서의 스캘핑에 최적화되어 있습니다! RSIScalperPro를 사용하면 정확한 진입 및 청산 신호를 제공하는 강력한 도구를 손에 넣을 수 있습니다. RSIScalperPro는 서로 다른 두 가지 RSI 지표를 사용하여 과매수 및 과매도 레벨에 대한 명확한 신호를 제공합니다. 2개의 RSI의 시간 프레임 및 제한 값을 원하는 대로 조정하여 트레이딩 전략에 최적화된 결과를 얻을 수 있습니다. 차트 상의 개별 화살표는 거래 진입 및 청산 타이밍을 쉽게 파악하는 데 도움이 됩니다. 또한 RSIScalperPro의 특징 중 하나는 사용자 정의 가능한 3개의 이동 평균선입니다. 이를 통해 트렌드의 방향을 판단하고 강력한 거래 신호를 확인하는 데 도움이 됩니다. 이를 통해 조기에 트렌드를 감지하고 수익성 높은 거래에 참여할 수 있습니다. 뿐만 아니라 RSIScalperPro는 새로운 거래
Candle Info For selected candle: OHLC prices Open Time Bar shift body size in points upper shadow in points Lower shadow in points Candle length in points Tick volume For current candle: Remaining time Ticks/sec For the chart: Price at mouse position Time at mouse position Draw Lines For selected candle you can draw a projected line forward, backward or both ways. You can hide/show/delete all lines created.
P Booster Pro is the developed version of P Booster.  Pro version allows adjusting 5 parameters: - RiskPerc: p ercent of the biggest lot that is available according to equity. - PriceFellPercent: difference between the choused candle ( WhichCandleM15From ) and the Candle 1 price in percent. - StopLossLevel: Stop loss level in percent point. For example: 30 = 99,7% of the Ask price. - WhichCandleM15From: M15 Candle ID from where the expert will check the PriceFellPercent level and compare it with
Tim Trend
Oleksii Ferbei
Due to the fact that at each separate period of time, trading and exchange platforms from different parts of the planet are connected to the trading process, the Forex market operates around the clock. Depending on which continent trading activity takes place during a certain period, the entire daily routine is divided into several trading sessions. There are 4 main trading sessions: Pacific. European. American Asian This indicator allows you to see the session on the price chart. You can als
News Clock
Victor Klenov
The professional   browser  of News and Trading Sessions is now available in MetaTrader 5. Now all the most important market information is collected on one dial! News located on the Time scale. Planning your working time has never been so easy and convenient ... The news scale can be switched a day, two, a week, a month forward or backward (see the details in the short video). All news updates in real time. Thanks to the built-in filters, you can configure the display of news by importanc
Elliott Wave Helper
Siarhei Vashchylka
4.92 (12)
Elliott Wave Helper - a panel for making elliott wave and technical analysis. Includes all known wave patterns, support and resistance levels, trend lines and cluster zones. Manual (Be sure to read before purchasing) | Version for MT4 Advantages 1. Making wave analysis and technical analysis in a few clicks 2. All Elliott wave patterns available, including triangle and combinations 3. All nine wave display styles, including a special circle font 4. E lements of technical analysis : trend lines
이 지표는 실용적인 거래를위한 완벽한 웨이브 자동 분석 지표입니다!=>Increase the choice of international style mode, (red fall green rise style) 대역의 표준화된 정의는 더 이상 다른 사람들의 물결이 아니며 인공 간섭의 그림이 제거되어 접근 방식의 엄격한 분석에서 핵심 역할을 합니다.           현재 구매 할인 중!   색인 내용: 1.       기본파동:   첫째, 가격변동과정에서 기본변동의 변곡점을 찾았고, 물론 그의 주문이 너무 강하지 않아 다음 계산의 기초가 된다. 2.       2차 대역   : 기본파를 기반으로 알고리즘 분석을 통해 보다 명확한 2차 대역을 획득하고, 2차 대역은 파동 분석의 기반 제공 삼.       Wave:   추세가 더 명확하고 직관적이고 방향성이 있습니다.파동의 지속 여부를 분석하기 위해서는 2차 파동 대역의 형태를 살펴보고, 2차 파동의 구성을 분석하여 차후의
SSX Titan TT
Artem Minchuk
3.36 (45)
Delving deep into the sphere of finance and trading strategies, I decided to conduct a series of experiments, exploring approaches based on reinforcement learning as well as those operating without it. Applying these methods, I managed to formulate a nuanced conclusion, pivotal for understanding the significance of unique strategies in contemporary trading. Neural network advisors, despite showcasing impressive efficiency in the initial stages, proved to be highly unstable in the long run. Vario
Statistics Boom and Crash
Marcelo Jose Patino Vargas
SYSTEM DESCRIPTION Our MT5 EA uses an advanced statistical system to determine the optimal time to open sell positions on the BOOM 1000, BOOM 500, and BOOM 300 assets. Based on rigorous market data analysis, the EA identifies the moment when there is a 90% probability of a bearish candle, allowing our users to enter a sell position with maximum confidence in success. This data-driven approach is the key to achieving profitable and consistent trades in BOOM 1000, and our EA is designed to aut
ClearArrows MT5
Pavel Krysanov
For any trader, the result of market analysis is the correct determination of entry and exit points from the market. The ClearArrows indicator does not display any unnecessary information that may distract or mislead the trader, but only the most important thing. The indicator is very easy to use, when a down arrow appears, you need to open a SELL deal, when an up arrow appears you need to open a BUY deal. The ClearArrows indicator, despite its outward simplicity, has a large analytical algor
FRB Candle Counter
Fernando Baratieri
Candle Counter This product counts the candles and shows the result according to the configuration defined by the user. Professional traders use it to emphasize a specific candlestick. Settings Position - Choose whether the numbers will be displayed above or below the candle Distance - The distance that the number will have from the candle, referring to the minimum or maximum Font Size - Font Size Color - Font Color
To get access to MT4 version please click   here . This is the exact conversion from TradingView: QQE MT4 Glaz-modified by JustUncleL This is a light-load processing and non-repaint indicator. All input options are available. This is not a multi time frame indicator. Buffers are available for processing in EAs. You can message in private chat for further changes you need.
!! FLASH SALE !!   Over 80% off !!     For ONE week only. Now only $47 - normally $297! >>>      Ends on 30 June 2023 - Don't miss it! Buy And Sell Signal Arrows On The Chart When The Price Is About To Reverse. Also Sends Alerts –On MT5 To Your Phone To Your Email. Does not repaint. Works on any pair, any timeframe.   (Just ajust the settings for your pair and timeframe.) 10 Activations allowed so you are free from limitations MT4 version here .   Spreads from 0.1pip RAW/ECN Acco
Utilities
Douglas Lucio De Araujo
Indicator with 3 features - Clock : Clock independent of the chart, counting continues even when the market is closed. - Template : After setting up a configuration in any graphic, be it color patterns, indicators, zoom ... The configuration will be copied to all active graphics. - TimeFrame : Set the TimeFrame on a chart, and with just one click all the active charts will be changed to the same TimeFrame.
Our selling bot envisions a seamless and efficient selling experience for clients. We understand the importance of optimizing the selling process and maximizing sales potential. With our bot, clients can effortlessly list their products, services, or assets, and attract buyers through intelligent pricing strategies and targeted promotions. Our vision is to provide clients with a user-friendly interface where they can easily input all the necessary details for their listings. We aim to simplify t
Introduction This indicator detects volume spread patterns for buy and sell opportunity. The patterns include demand and supply patterns. You might use each pattern for trading. However, these patterns are best used to detect the demand zone (=accumulation area) and supply zone (=distribution area). Demand pattern indicates generally potential buying opportunity. Supply pattern indicates generally potential selling opportunity. These are the underlying patterns rather than direct price action. T
This Indicator adding power to traditional zigzag indicator. With High-Low numbers in vision it will be easier to estimate change of trend by knowing the depth of each wave. Information including points, pips, percentage%, and #bars can be displayed based on configuration. All information is real-time update. This indicator is especially useful in sideway market to buy low sell high.
Price Spectrum
Yuriy Ponyatov
The Price Spectrum indicator reveals opportunities for detailed market analysis. Advantages: Market Volume Profile Creation : The indicator assists in analyzing the dynamics of trading volumes in the market. This allows traders to identify crucial support and resistance levels, as well as determine market structure. Filtering Insignificant Volumes : Using the indicator helps filter out insignificant volumes, enabling traders to focus on more significant market movements. Flexible Configuration S
Forex Volumes
Marco Montemari
Forex is the most liquid market in the world. For this reason real volumes are not available. Some indicators use the number of ticks, in other cases the broker can supply volumes informations but they will be only data about that broker. Volumes are important becase they will form the price and volatility of the market. Using an algorithm this indicator can give you a very good approximation of the volumes for each candle. How to read the indicators? This version provides you many visualiza
IVolX 2 DPOC mt5
Denis Chebatarev
Vol 2 DPOC volume vol 2 DOC-dynamic horizontal volume indicator for any time periods Main settings of the indicator: Volume Source -selecting data for volumes (tick or real) DPOCOn -enabling / disabling the indicator DPOCFrom -calculation start date DPOCTo -settlement end date The indicator allows you to manually select areas on the chart to analyze changes in the maximum volume over time. You can do this by using vertical lines and moving them along the chart. Or by setting specific dates
The third indicator from the set for market analysis. The first one is here:  https://www.mql5.com/ru/market/product/65258 The second one is here: https://www.mql5.com/ru/market/product/65347 The indicator builds a channel of maximum price fluctuations for a specified period. Additionally, the middle of the channel is drawn. All color settings, line types are customizable. The indicator allows you to see the picture of price movement from a slightly different angle. You can use several in
(암호화폐 차트) 지정한 막대의 개수만큼 히스토리를 가져와서 인스턴트 데이터를 직접 보여주기 시작합니다. 모든 시간대에 일할 수 있는 기회를 제공합니다. 여러 기호로 작업할 수 있습니다. 이 앱은 백그라운드 서비스입니다. 시장 감시 화면에서 "S"로 시작하는 모든 기호의 이력을 다운로드하여 틱 데이터를 보여줍니다. 바이낸스 스팟의 실시간 거래 데이터를 MT5로 자동 전송합니다. 링크에서 스크립트를 실행하여 프로그램을 사용하세요. https://www.mql5.com/en/market/product/69000 이 프로그램은 설치가 필요합니다. https://www.mql5.com/tr/market/product/73887 도구 메뉴 >> 옵션 >> Expert Advisors에서 WebRequest를 허용하고 URL을 추가해야 합니다. https://api.binance.com
이 제품의 구매자들이 또한 구매함
우선 이 거래 시스템이 리페인팅, 리드로잉 및 레이그 인디케이터가 아니라는 점을 강조하는 것이 중요합니다. 이는 수동 및 로봇 거래 모두에 이상적인 것으로 만듭니다. "스마트 트렌드 트레이딩 시스템 MT5"은 새로운 및 경험이 풍부한 트레이더를 위해 맞춤형으로 제작된 종합적인 거래 솔루션입니다. 10개 이상의 프리미엄 인디케이터를 결합하고 7개 이상의 견고한 거래 전략을 특징으로 하여 다양한 시장 조건에 대한 다목적 선택이 가능합니다. 트렌드 추종 전략: 효과적인 트렌드 추이를 타기 위한 정확한 진입 및 손절 관리를 제공합니다. 반전 전략: 잠재적인 트렌드 반전을 식별하여 트레이더가 범위 시장을 활용할 수 있게 합니다. 스캘핑 전략: 빠르고 정확한 데이 트레이딩 및 단기 거래를 위해 설계되었습니다. 안정성: 모든 인디케이터가 리페인팅, 리드로잉 및 레이그가 아니므로 신뢰할 수 있는 신호를 보장합니다. 맞춤화: 개별 거래 선호도를 고려한 맞춤형 전략을 지원합니다. 최상의 전략을 찾는
Atomic Analyst MT5
Issam Kassas
4.27 (11)
우선적으로 언급할 점은이 거래 지표가 다시 그리지 않고 지연되지 않으며 이를 통해 수동 및 로봇 거래 모두에 이상적이라는 점입니다. Atomic Analyst는 가격의 강도와 모멘텀을 활용하여 시장에서 더 나은 이점을 찾는 PA Price Action Indicator입니다. 고급 필터를 장착하여 잡음과 거짓 신호를 제거하고 거래 잠재력을 높이는 데 도움이 됩니다. 복잡한 지표의 다중 레이어를 사용하여 Atomic Analyst는 차트를 스캔하고 복잡한 수학적 계산을 간단한 신호와 색상으로 변환하여 초보 트레이더가 이해하고 일관된 거래 결정을 내릴 수 있도록합니다. "Atomic Analyst"는 새로운 및 경험이 풍부한 트레이더를위한 종합적인 거래 솔루션입니다. 프리미엄 지표와 최고 수준의 기능을 하나의 거래 전략에 결합하여 모든 종류의 트레이더에 대한 다재다능한 선택지가되었습니다. 인트라데이 거래 및 스캘핑 전략 : 빠르고 정확한 일일 거래 및 단기 거래를 위해 설계
Quantum Trend Sniper
Bogdan Ion Puscasu
5 (37)
소개       Quantum Trend Sniper Indicator는   추세 반전을 식별하고 거래하는 방식을 변화시키는 획기적인 MQL5 지표입니다! 13년 이상의 거래 경험을 가진 숙련된 트레이더 팀이 개발한       Quantum Trend Sniper 표시기       매우 높은 정확도로 추세 반전을 식별하는 혁신적인 방법으로 거래 여정을 새로운 차원으로 끌어올리도록 설계되었습니다. ***Quantum Trend Sniper Indicator를 구입하면 Quantum Breakout Indicator를 무료로 받을 수 있습니다!*** Quantum Trend Sniper Indicator는 추세 반전을 식별하고 세 가지 이익실현 수준을 제안할 때 경고, 신호 화살표를 제공합니다. 초보자 거래자와 전문 거래자 모두에게 적합합니다. Quantum EA 채널:       여기를 클릭하세요 MT4 버전:       여기를 클릭하세요
FX Volume MT5
Daniel Stein
4.94 (17)
모닝 브리핑을 통해 세부 정보와 스크린샷으로 매일 시장 업데이트를 받으세요 여기 mql5 및 텔레그램에서 FX 거래량은 브로커의 관점에서 시장 심리에 대한 실제 통찰력을 제공하는 최초이자 유일한 거래량 지표입니다. 브로커와 같은 기관 시장 참여자가 외환 시장에서 어떤 포지션을 취하고 있는지에 대한 훌륭한 통찰력을 COT 보고서보다 훨씬 빠르게 제공합니다. 차트에서 이 정보를 직접 확인하는 것은 트레이딩의 진정한 판도를 바꾸고 획기적인 솔루션입니다. 다음과 같은 고유한 시장 데이터 인사이트의 이점 비율 는 통화의 매수/매도 포지션 비율을 백분율로 표시 비율 변화 는 선택한 기간 내 매수 비율과 비율 변화를 표시 총 거래량 는 해당 통화의 총 거래량(롱 및 숏)을 로트 단위로 보여줍니다 Volumes Long 는 해당 통화의 모든 롱 포지션의 거래량을 보여줍니다 Volumes Short 는 해당 통화의 모든 숏 포지션의 거래량을 보여줍니다 Net Long 는 순 롱 포지션의 거래량
FX Power MT5 NG
Daniel Stein
5 (4)
모닝 브리핑 여기 mql5 와 텔레그램에서 FX Power MT5 NG 는 오랫동안 인기 있는 통화 강도 측정기인 FX Power의 차세대 버전입니다. 이 차세대 강도 측정기는 무엇을 제공합니까? 기존 FX Power에서 좋아했던 모든 것 PLUS GOLD/XAU 강도 분석 더욱 정밀한 계산 결과 개별 구성 가능한 분석 기간 더 나은 성능을 위한 사용자 정의 가능한 계산 한도 특별 멀티더 많은 것을보고 싶은 사람들을위한 특별한 다중 인스턴스 설정 모든 차트에서 좋아하는 색상을위한 끝없는 그래픽 설정 수많은 알림 옵션, 중요한 것을 다시는 놓치지 않도록 Windows 11 및 macOS 스타일의 둥근 모서리가 있는 새로운 디자인 마법처럼 움직이는 인디케이터 패널 FX 파워 키 특징 모든 주요 통화의 완전한 강세 이력 모든 시간대에 걸친 통화 강세 이력 모든 브로커 및 차트에서 고유 계산 결과 100% 신뢰할 수있는 실시간100 % 신뢰할 수있는 실시간 계산-> 다시 칠하지 않음
Advanced Supply Demand MT5
Bernhard Schweigert
4.53 (15)
현재 33% 할인! 초보자나 전문 트레이더를 위한 최고의 솔루션! 이 보조지표는 우리가 다수의 독창적 기능과 새로운 공식을 통합한 독특하고 고품질이며 저렴한 거래 도구입니다. 이 업데이트를 통해 이중 시간대를 표시할 수 있습니다. 더 높은 TF를 표시할 수 있을 뿐만 아니라 차트 TF와 더 높은 TF 모두를 표시할 수 있습니다: 중첩 영역 표시. 모든 Supply Demand 트레이더들이 좋아할 것입니다. :) 중요한 정보 공개 Advanced Supply Demand의 잠재력을 극대화하려면 다음을 방문하십시오. https://www.mql5.com/ko/blogs/post/720245   진입 또는 목표의 명확한 트리거 포인트를 정확히 찾아냄으로 해서 거래가 어떻게 개선될지 상상해 보십시오. 새로운 알고리즘을 기반으로 매수자와 매도자 간의 잠재적인 불균형을 훨씬 더 쉽게 분간할 수 있습니다. 왜냐하면 가장 강한 공급영역과 가장 강한 수요 영역과 과거에 어떻게 진행 되었는지를(이
RelicusRoad Pro MT5
Relicus LLC
4.82 (22)
이제 $ 147 (몇 가지 업데이트 후 $ 499 증가) - 무제한 계정 (PCS 또는 MACS) RelicusRoad 사용 설명서 + 교육 비디오 + 비공개 Discord 그룹 액세스 + VIP 상태 시장을 보는 새로운 방법 RelicusRoad는 외환, 선물, 암호화폐, 주식 및 지수에 대한 세계에서 가장 강력한 거래 지표로서 거래자에게 수익성을 유지하는 데 필요한 모든 정보와 도구를 제공합니다. 우리는 초보자부터 고급까지 모든 거래자가 성공할 수 있도록 기술적 분석 및 거래 계획을 제공합니다. 미래 시장을 예측할 수 있는 충분한 정보를 제공하는 핵심 거래 지표입니다. 우리는 차트에서 말이 안 되는 여러 지표 대신 완전한 솔루션을 믿습니다. 타의 추종을 불허하는 매우 정확한 신호, 화살표 + 가격 조치 정보를 표시하는 올인원 표시기입니다. 강력한 AI를 기반으로 하는 RelicusRoad는 누락된 정보와 도구를 제공하여 교육하고 성공적인 트레이더인 트레이딩 전문
XQ Indicator MetaTrader 5
Marzena Maria Szmit
5 (1)
Step into the realm of Forex trading with confidence and precision using XQ, a cutting-edge Forex indicator designed to elevate your trading game to unprecedented heights. Whether you're a seasoned trader or just stepping into the world of currency exchange, XQ Forex Indicator empowers you with the insights and signals needed to make informed trading decisions. The signal conditions are a combination of three indicators, and XQ Forex Indicator only display  medium and long-term trends . The ind
Volume by Price MT5
Brian Collard
5 (3)
The Volume by Price Indicator for MetaTrader 5 features Volume Profile and Market Profile TPO (Time Price Opportunity). Get valuable insights out of currencies, equities and commodities data. Gain an edge trading financial markets. Volume and TPO histogram bar and line charts. Volume Footprint charts. TPO letter and block marker charts including split structures. Versatile segmentation and compositing methods. Static, dynamic and flexible ranges with relative and/or absolute visualizations. Lay
Entry Points Pro for MT5
Yury Orlov
4.54 (157)
다시 색을 칠하지 않고 거래에 진입할 수 있는 정확한 신호를 제공하는 MT5용 지표입니다. 외환, 암호화폐, 금속, 주식, 지수 등 모든 금융 자산에 적용할 수 있습니다. 매우 정확한 추정값을 제공하고 매수와 매도의 가장 좋은 시점을 알려줍니다. 하나의 시그널로 수익을 내는 지표의 예와 함께 비디오 (6:22)시청하십시오! 대부분의 거래자는 Entry Points Pro 지표의 도움으로 첫 거래 주 동안 트레이딩 결과를 개선합니다. 저희의   Telegram Group 을 구독하세요! Entry Points Pro 지표의 좋은점. 재도색이 없는 진입 신호 신호가 나타나고 확인되면(시그널 캔들이 완성된 경우) 신호는 더 이상 사라지지 않습니다. 여타 보조지표의 경우 신호를 표시한 다음 제거되기 때문에 큰 재정적 손실로 이어집니다. 오류 없는 거래 게시 알고리즘을 통해 트레이드(진입 또는 청산)를 할 이상적인 순간을 찾을 수 있으며, 이를 통해 이를 사용하는 모든 거래자의
ICT, SMC, SMART MONEY CONCEPTS, SMART MONEY, Smart Money Concept, Support and Resistance, Trend Analysis, Price Action, Market Structure, Order Blocks, BOS/CHoCH,   Breaker Blocks ,  Momentum Shift,   Supply&Demand Zone/Order Blocks , Strong Imbalance,   HH/LL/HL/LH,    Fair Value Gap, FVG,  Premium  &   Discount   Zones, Fibonacci Retracement, OTE, Buy Side Liquidity, Sell Side Liquidity, BSL/SSL Taken, Equal Highs & Lows, MTF Dashboard, Multiple Time Frame, BigBar, HTF OB, HTF Market Structure
Blahtech Supply Demand MT5
Blahtech Limited
4.57 (14)
Was: $299  Now: $99   Supply Demand uses previous price action to identify potential imbalances between buyers and sellers. The key is to identify the better odds zones, not just the untouched ones. Blahtech Supply Demand indicator delivers functionality previously unavailable on any trading platform. This 4-in-1 indicator not only highlights the higher probability zones using a multi-criteria strength engine, but also combines it with multi-timeframe trend analysis, previously confirmed swings
ON Trade Gann Squares MT5
Abdullah Alrai
5 (1)
간 스퀘어 지표는 W.D. 간이 쓴 "시장 예측을 위한 수학적 공식" 기사에 기반한 강력한 시장 분석 도구입니다. 이 도구는 수학적 개념과 간 이론을 사용하여 정확한 시장 분석을 수행합니다. 144, 90, 52의 제곱과 9의 제곱을 사용합니다. 또한 의 9의 제곱근 및 해당 제곱의 채널 및 스타 패턴과의 관련성을 통합합니다. 사용자 메뉴얼 및 적용: 이 지표를 사용하기 전에 사용자 메뉴얼을 읽고 질문이 있을 경우 문의하시기 바랍니다. 전체 메뉴얼은 웹사이트에서 제공됩니다. MT5의 전체 버전을 구매하거나 MT4의 무료 버전을 테스트할 수 있습니다. 두 버전 모두 링크에서 확인하실 수 있습니다. 주요 기능 및 기능: 간 스퀘어 지표는 정확한 결정을 위해 기하학적 개념과 간 이론을 활용하는 시장 분석을 위한 포괄적인 도구 집합을 제공합니다. 주요 기능은 다음과 같습니다. 9의 제곱 분석:   이 지표는 9의 제곱에 대한 수평 선, 스타 패턴, 그리드 및 간 팬을 그릴 수 있습니다. 간
소개       Quantum Breakout PRO   , 브레이크아웃 존 거래 방식을 변화시키는 획기적인 MQL5 지표! 13년 이상의 거래 경험을 가진 숙련된 트레이더 팀이 개발한       퀀텀 브레이크아웃 PRO       혁신적이고 역동적인 브레이크아웃 존 전략으로 거래 여정을 새로운 차원으로 끌어올리도록 설계되었습니다. Quantum Breakout Indicator는 5개의 이익 목표 영역이 있는 브레이크아웃 영역의 신호 화살표와 브레이크아웃 상자를 기반으로 한 손절 제안을 제공합니다. 초보자 거래자와 전문 거래자 모두에게 적합합니다. Quantum EA 채널:       여기를 클릭하세요 중요한! 구매 후 설치 매뉴얼을 받으려면 개인 메시지를 보내주십시오. 추천: 기간: M15 통화쌍: GBPJPY, EURJPY, USDJPY,NZDUSD, XAUUSD 계정 유형: 스프레드가 매우 낮은 ECN, Raw 또는 Razor 브로커 시간: GM
Owl Smart Levels MT5
Sergey Ermolov
4.47 (36)
MT4 버전  |  FAQ Owl Smart Levels Indicator 는 Bill Williams 의 고급 프랙탈, 시장의 올바른 파동 구조를 구축하는 Valable ZigZag, 정확한 진입 수준을 표시하는 피보나치 수준과 같은 인기 있는 시장 분석 도구를 포함하는 하나의 지표 내에서 완전한 거래 시스템입니다. 시장과 이익을 취하는 장소로. 전략에 대한 자세한 설명 표시기 작업에 대한 지침 고문-거래 올빼미 도우미의 조수 개인 사용자 채팅 ->구입 후 나에게 쓰기,나는 개인 채팅에 당신을 추가하고 거기에 모든 보너스를 다운로드 할 수 있습니다 힘은 단순함에 있습니다! Owl Smart Levels 거래 시스템은 사용하기 매우 쉽기 때문에 전문가와 이제 막 시장을 연구하고 스스로 거래 전략을 선택하기 시작한 사람들 모두에게 적합합니다. 전략 및 지표에는 눈에 보이지 않는 비밀 공식 및 계산 방법이 없으며 모든 전략 지표는 공개되어 있습니다. Owl Smart Levels를
Gartley Hunter Multi
Siarhei Vashchylka
5 (5)
Gartley Hunter Multi - An indicator for searching for harmonic patterns simultaneously on dozens of trading instruments and on all classic timeframes: (m1, m5, m15, m30, H1, H4, D1, Wk, Mn). Manual (Be sure to read before purchasing) | Version for MT4 Advantages 1. Patterns: Gartley, Butterfly, Shark, Crab. Bat, Alternate Bat, Deep Crab, Cypher 2. Simultaneous search for patterns on dozens of trading instruments and on all classic timeframes 3. Search for patterns of all possible sizes. Fr
Blahtech Market Profile MT5
Blahtech Limited
5 (8)
Was: $249  Now: $99   Market Profile defines a number of day types that can help the trader to determine market behaviour. A key feature is the Value Area, representing the range of price action where 70% of trading took place. Understanding the Value Area can give traders valuable insight into market direction and establish the higher odds trade. It is an excellent addition to any system you may be using. Inspired by Jim Dalton’s book “Mind Over Markets”, this indicator is designed to suit the
TPSproTREND PrO MT5
Roman Podpora
5 (5)
TPSpro TRENDPRO  - is a trend indicator that automatically analyzes the market and provides information about the trend and each of its changes, as well as giving signals for entering trades without redrawing! The indicator uses each candle, analyzing them separately. referring to different impulses - up or down impulse. Exact entry points into transactions for currencies, crypto, metals, stocks, indices!  -  Version MT4                  DETAILED DESCRIPTION        /       TRADING SETUPS       
Golden Spikes Detector
Batsirayi L Marango
5 (1)
Golden Spikes Detector This indicator is based on an advanced strategy primarily for trading spikes on Boom and Crash Indices. Complex algorithms were implemented to detect high probability entries only. It alerts on potential Buy and Sell entries. To trade spikes on the Deriv or Binary broker, only take Buy Boom and Sell Cash alerts. It was optimised to be loaded on 5-minute timeframe although multiple timeframe analysis is done in the background. Features ·             Desktop pop up and sound
Matrix Arrow Indicator MT5
Juvenille Emperor Limited
5 (14)
매트릭스 화살표 표시기 MT5 는 외환, 상품, 암호 화폐, 지수, 주식과 같은 모든 기호/도구에 사용할 수 있는 100% 다시 칠하지 않는 다중 기간 표시기를 따르는 고유한 10 in 1 추세입니다.  Matrix Arrow Indicator MT5 는 다음과 같은 최대 10개의 표준 지표에서 정보와 데이터를 수집하여 초기 단계에서 현재 추세를 결정합니다. 평균 방향 이동 지수(ADX) 상품 채널 지수(CCI) 클래식 하이켄 아시 캔들 이동 평균 이동 평균 수렴 발산(MACD) 상대 활력 지수(RVI) 상대 강도 지수(RSI) 포물선 SAR 스토캐스틱 오실레이터 윌리엄스의 백분율 범위 모든 지표가 유효한 매수 또는 매도 신호를 제공하면 강력한 상승/하락 추세를 나타내는 다음 캔들/막대가 시작될 때 해당 화살표가 차트에 인쇄됩니다. 사용자는 사용할 표시기를 선택하고 각 표시기의 매개변수를 개별적으로 조정할 수 있습니다. 매트릭스 화살표 표시기 MT5는 선택한 표시기에서만 정보를 수
IX Power MT5
Daniel Stein
5 (2)
IX Power는   마침내 FX Power의 탁월한 정밀도를 외환이 아닌 기호에도 적용했습니다. 좋아하는 지수, 주식, 원자재, ETF, 심지어 암호화폐까지 단기, 중기, 장기 추세의 강도를 정확하게 파악할 수 있습니다. 단말기가 제공하는   모든 것을 분석할   수 있습니다. 사용해 보고 트레이딩   타이밍이 크게 향상되는   것을 경험해 보세요. IX Power 주요 특징 단말기에서 사용 가능한 모든 거래 심볼에 대해 100% 정확한 비재도장 계산 결과 제공 사전 구성 및 추가적으로 개별 구성 가능한 강도 분석 기간의 드롭다운 선택 가능 이메일, 메시지, 모바일 알림을 통한 다양한 알림 옵션 제공 EA 요청을 위한 액세스 가능한 버퍼 더 나은 성능을 위한 사용자 지정 가능한 계산 한도 더 많은 것을 보고 싶은 사용자를 위한 특별 다중 인스턴스 설정 모든 차트에서 좋아하는 색상을 위한 무한한 그래픽 설정 가능 Windows 11 및 macOS 스타일의 둥
Golden Gate Algo MT5
James David Lane
4 (6)
크리스마스 40% 할인! 1월 1일에 가격이 $250로 인상됩니다! GoldenGate Entries를 소개합니다: 혁신적인 트레이딩 솔루션! GoldenGate Entries (GGE)를 사용하여 거래하는 혁신적인 방법을 발견하세요. GGE는 귀하의 거래 경험을 향상시키기 위해 디자인된 고급 지표로, 사용자에게 정확성과 자신감을 부여하는 포괄적인 기능을 제공합니다. 페어: 아무거나 (FX - 상품 - 주식 - 주식 - 암호화폐) 타임프레임: 15분에서 H1까지 주요 기능: 매수 및 매도 화살표 표시: 팝업 알림과 함께 매수 및 매도 화살표 표시를 받아 언제나 정보를 확인할 수 있습니다. GoldenGate_Algo: 시장 상황에 대한 통찰력을 얻으려면 GoldenGate_Algo를 사용하세요. 시장이 '과매도'인지 '과매수'인지 평가하는 강력한 도구입니다. 현재 트렌드 분석: 현재 보고 있는 타임프레임에서 현재 트렌드에 액세스하여 거래를 주류 시장 방
Bill Williams Advanced
Siarhei Vashchylka
5 (3)
Bill Williams Advanced is designed for automatic chart analysis using Bill Williams' "Profitunity" system. The indicator analyzes four timeframes at once. Manual (Be sure to read before purchasing) Advantages 1. Automatically analyzes the chart using the "Profitunity" system of Bill Williams. The found signals are placed in a table in the corner of the screen. 2. Equipped with a trend filter based on the Alligator indicator. Most of the system signals are recommended to be used only accordi
TPA True Price Action indicator reveals the true price action of the market makers through 100% non-repainting signals strictly at the close of a candle! TPA shows entries and re-entries, every time the bulls are definitely stronger than the bears and vice versa. Not to confuse with red/green candles. The shift of power gets confirmed at the earliest stage and is ONE exit strategy of several. There are available now two free parts of the TPA User Guide for our customers. The first "The Basics"
TrendMaestro5
Stefano Frisetti
note: this indicator is for METATRADER4, if you want the version for METATRADER5 this is the link:  https://www.mql5.com/it/market/product/108106 TRENDMAESTRO recognizes a new TREND in the bud, he never makes mistakes. The certainty of identifying a new TREND is priceless. DESCRIPTION TRENDMAESTRO identifies a new TREND in the bud, this indicator examines the volatility, volumes and momentum to identify the moment in which there is an explosion of one or more of these data and therefore the mome
The 123 Pattern is one of the most popular, powerful and flexible chart patterns. The pattern is made up of three price points: a bottom, a peak or valley, and a Fibonacci retracement between 38.2% and 71.8%. A pattern is considered valid when the price breaks beyond the last peak or valley, moment at which the indicator plots an arrow, rises an alert, and the trade can be placed. [ Installation Guide | Update Guide | Troubleshooting | FAQ | All Products ] Clear trading signals Customizable c
TrendDecoder Premium MT5
Christophe, Pa Trouillas
5 (1)
이제 메타트레이더에서 사용 가능 범위 및 다음 가능한 움직임 식별       |      추세의 초기 신호와 강도를 확인하세요       |      반전 전 명확한 출구 확보       |      가격이 테스트 할 피보 레벨 파악 비추적, 비지연 지표 - 수동 및 자동 거래에 이상적 - 모든 자산 및 모든 시간 단위에 적합 - 출시 시 50% 할인   - 이후 >> $149로 복귀 구매 후   이 채널로 문의 하여 권장 설정을 확인하세요. MT4 버전:   여기를 클릭하세요 BladeSCALPER 및 PowerZONES 로 전체 방법을 확인하세요. 어떤 서비스인가요? 트렌드디코더는 추세 모니터링을 간단하고 쉽게 하기 위한 여러 혁신 기술의 집약체입니다. 투영 추세선(투영 추세선)   - 다가오는 추세의 속도 기준 실시간 추세선과 투영 추세선 비교   - 시장이 이전과 같은 방향으로 움직이고 있는지, 아니면 둔화되고 있는지? 실시간 추세선 교차   - 추세가 궤
Quantum Heiken Ashi PRO MT5
Bogdan Ion Puscasu
4.5 (8)
시장 동향에 대한 명확한 통찰력을 제공하도록 설계된 Heiken Ashi 양초는 노이즈를 필터링하고 잘못된 신호를 제거하는 기능으로 유명합니다. 혼란스러운 가격 변동에 작별을 고하고 더 매끄럽고 신뢰할 수 있는 차트 표현을 만나보세요. Quantum Heiken Ashi PRO를 정말 독특하게 만드는 것은 전통적인 촛대 데이터를 읽기 쉬운 색상 막대로 변환하는 혁신적인 공식입니다. 빨간색과 녹색 막대는 각각 약세와 강세 추세를 우아하게 강조하여 잠재적 진입점과 퇴장점을 매우 정확하게 파악할 수 있습니다. Quantum EA 채널:       여기를 클릭하세요 MT4 버전:       여기를 클릭하세요 이 놀라운 지표는 다음과 같은 몇 가지 주요 이점을 제공합니다. 선명도 향상: Heiken Ashi 바는 가격 변동을 완화하여 시장 추세를 보다 명확하게 나타내므로 유리한 거래 기회를 쉽게 식별할 수 있습니다. 소음 감소: 종종 잘못된 신호로 이어지는 불규칙한 가격 변동
Trades Assistant MT5
Martin Muriu Maina
Trade Assistant MetaTrader System  — a multi-timeframe system that is based on three standard indicators:   Stochastic oscillator ,   RSI   (Relative Strength Index), and   CCI   (Commodity Channel Index). It displays current trend directions for M1, M5, M15, M30, H1, H4, D1, W1, and MN1 timeframes. When you follow such an indicator you have a clear picture of the trends across all important timeframes. It doesn't matter which timeframe you attach this indicator to. Input parameters CheckCandl
Professional Scalping Tool on Deriv Attention! The indicator will be sold in limited quantities!!! Description: This trading indicator is designed for professional traders focused on scalping. Designed with the market in mind, it provides highly accurate spike trading signals. It works on the M1 timeframe and supports the following symbols: Boom 300 Index, Boom 500 Index, Boom 1000 Index, Crash 300 Index, Crash 500 Index, Crash 1000 Index. Functional Features: - Direction: - Trading is ca
제작자의 제품 더 보기
MACDmaxmin free demo
Carlos Andrés Moya Erazo
5 (3)
The indicator shows when there are overpricing and divergences over a normalized MACD Plus, it displays signals with configurable alerts, self-regulating dynamic overprice levels, and a simple setup and interface. This indicator automatically calculates markup ranges. MACDmaxmin is an indicator based on the MACD oscillator that effectively identifies trend changes in price, as it is a momentum indicator that captures the trend and shows the relationship between two moving averages of the price.
FREE
MACDmaxmin
Carlos Andrés Moya Erazo
3 (2)
The indicator shows when there are overpricing and divergences over a normalized MACD Plus, it displays signals with configurable alerts, self-regulating dynamic overprice levels, and a simple setup and interface. The indicator that automatically calculates overprices ranges! MACDmaxmin is an indicator based on the MACD oscillator that effectively identifies trend changes in price, as it is a momentum indicator that captures the trend and shows the relationship between two moving averages of th
필터:
jerome1677
250
jerome1677 2024.01.28 03:54 
 

rented this indicator and installed it but it does show upon my MT5 and i have not received ant assistance from the seller. if that changes so will the review but 1 star until otherwise

José Fábio RP
125
José Fábio RP 2023.10.26 16:23 
 

I have to say this indicator is wonderful. Thanks for working on it.

Aravind Kolanupaka
8835
Aravind Kolanupaka 2023.10.23 19:18 
 

Good indicator

odymt5
175
odymt5 2021.10.05 13:54 
 

Thank you for an excellent indicator, easy to use.

Welber Goncalves
401
Welber Goncalves 2021.08.03 23:17 
 

O meu está com problema, pois configuro para somente emitir sinal de sobrecompra ele emite sinal de sobrevenda e viceversa.

Carlos Andrés Moya Erazo
4912
개발자의 답변 Carlos Andrés Moya Erazo 2021.08.05 04:33
Saudações, lamentamos o transtorno.
Encontramos o problema e o corrigimos, esperamos que o produto atenda aos seus objetivos. Obrigado por nos ajudar a melhorar.
Êxitos!
Marsterp Marcel
25
Marsterp Marcel 2021.04.19 15:39 
 

Hi i didnt receive my RSImaxmin

Paul Bell
148
Paul Bell 2021.04.05 10:41 
 

very useful product

teodomiro
74
teodomiro 2021.02.06 18:43 
 

it´s good but I have rent the product again but i cannot download it again. could you pls help me with this ...

baraka fadi
55
baraka fadi 2020.12.04 16:02 
 

The best indicator ever, precious tool, Thank you

Pavel Shirykalov
241
Pavel Shirykalov 2020.11.10 08:22 
 

Thank you, an interesting indicator, I'm waiting for an expert

Claudio Jones
167
Claudio Jones 2020.06.09 16:25 
 

Very useful and accurate indicator when making a decision. Carlos Moya provides quality support. I'm happy with the results. Thanks a lot

Dunstan Wafula Namusonge
851
Dunstan Wafula Namusonge 2020.04.09 05:34 
 

Very resourceful

리뷰 답변
버전 3.4 2022.03.09
Performance update 2022
버전 3.3 2021.08.14
Overbought and oversold alarm override correction.
버전 3.2 2020.09.08
Resource Optimization
버전 3.1 2020.07.27
New Functions, Trend Arrows on Chart, RSI Signal Enhancement
버전 3.0 2020.07.16
New overpricing indicator included.
버전 2.15 2020.06.19
Optimization of resources and minimum programming corrections.
버전 2.14 2020.06.08
compatibility issues fix.
버전 2.13 2020.06.08
Resource Optimization and minimal programming fixes.
버전 2.0 2020.05.02
Display of divergence points (trend change indicator).
버전 1.50 2020.05.02
Optimization of resources, more intuitive presentation of values.
버전 1.10 2020.04.25
Resource Optimization.