• Übersicht
  • Bewertungen (9)
  • Diskussion (9)
  • Neue Funktionen

RSImaxmin

4.86

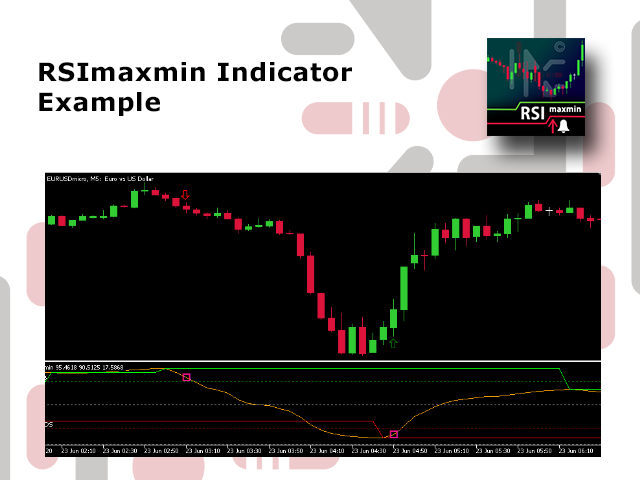
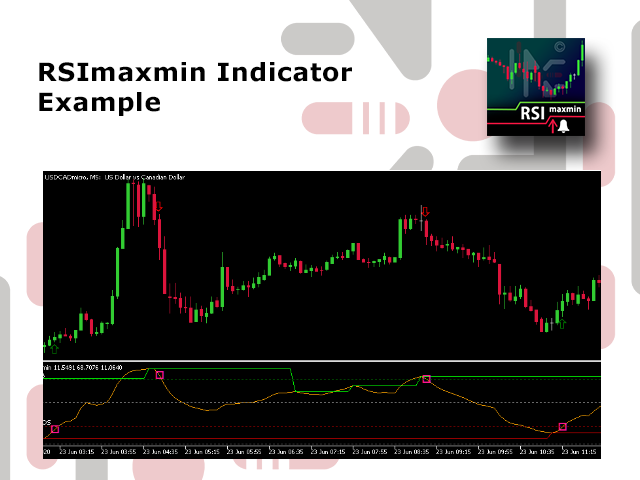
The indicator shows when there are overprice and divergences on the RSI.

In addition, it has configurable alerts, dynamic overprice levels and a special “RSI cleaner” function.

The indicator that automatically calculates the premium rates!

RSImaxmin is an indicator based on the Relative Strength Index (RSI) oscillator that effectively identifies changes in price trends as it reflects the relative strength of bullish movements compared to bearish movements. It is widely used by traders to measure the strength of a trend and identify end-of-trend signals.

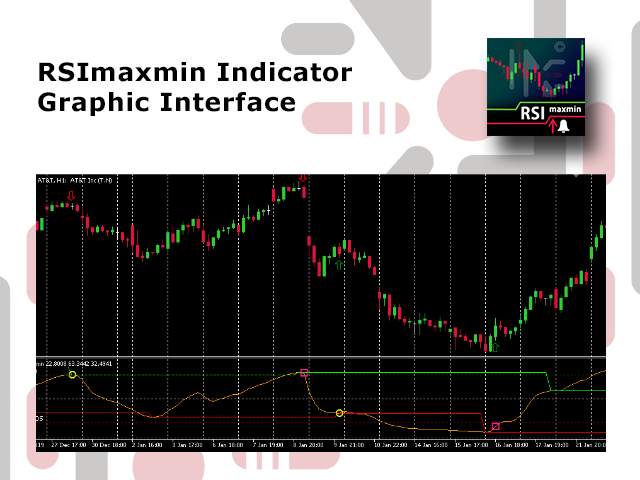
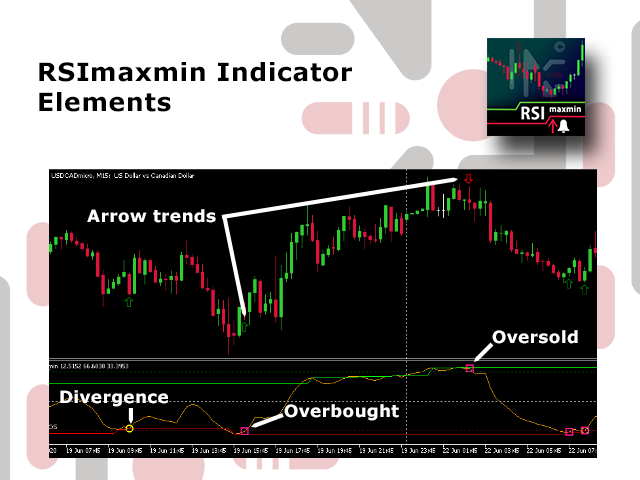
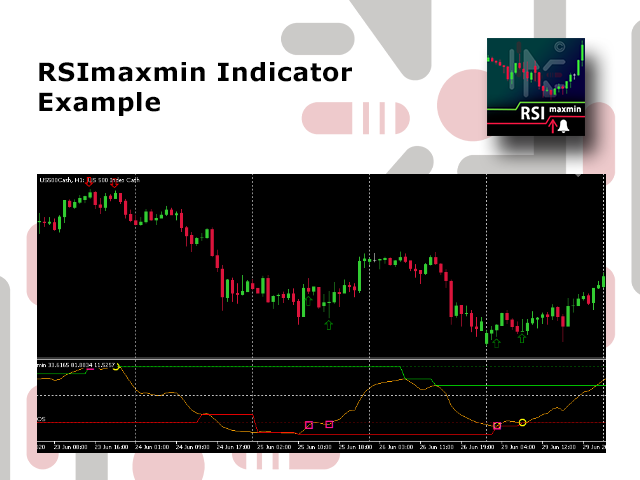
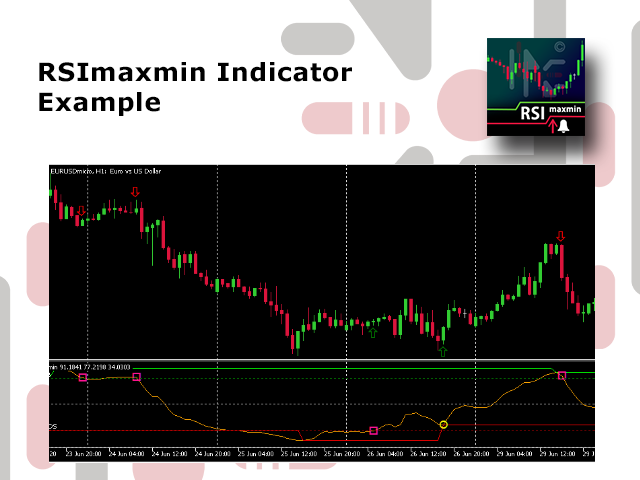
The RSImaxmin indicator provides valuable market information and signals of overbought, oversold, bullish divergence and bearish divergence that it detects automatically. These signals are represented in the oscillator as circles for divergence points and squares for overbougnt points. Immediately, you can receive configurable alerts of these signals.

In addition, this indicator has two unique characteristics; you can chart dynamic support and resistance levels that it automatically calculates according to the market to which it has been applied and the input parameters conveniently set by the trader. Overbought and oversold levels are also automatically calculated for each chart optimizing results.

The second unique feature of RSImaxmin is its “ cleaner RSI ” filter developed to reduce signal noise, this filter can be very useful to improve the effectiveness of a strategy.

Features

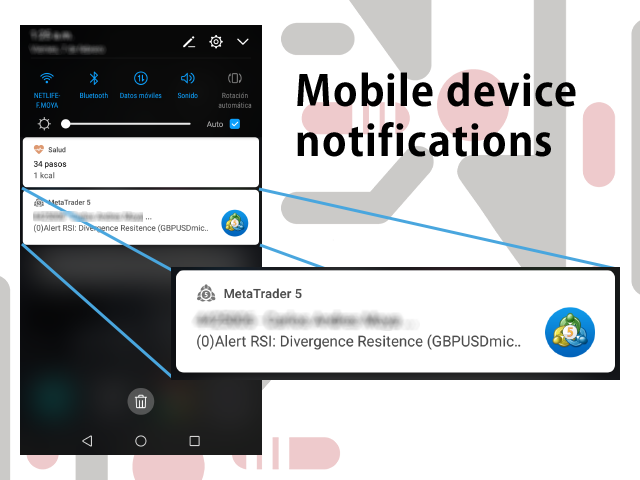
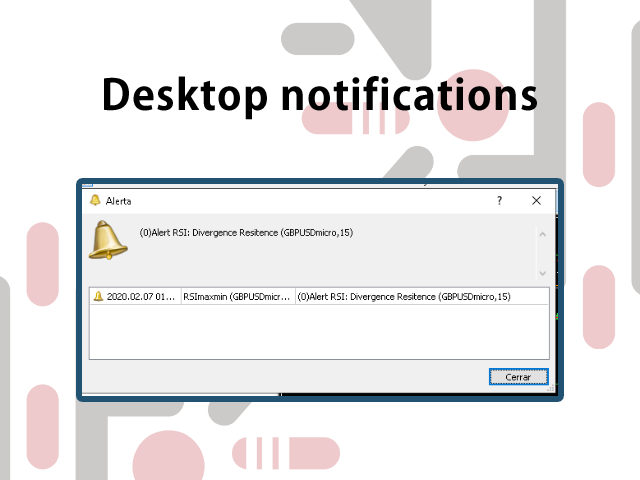
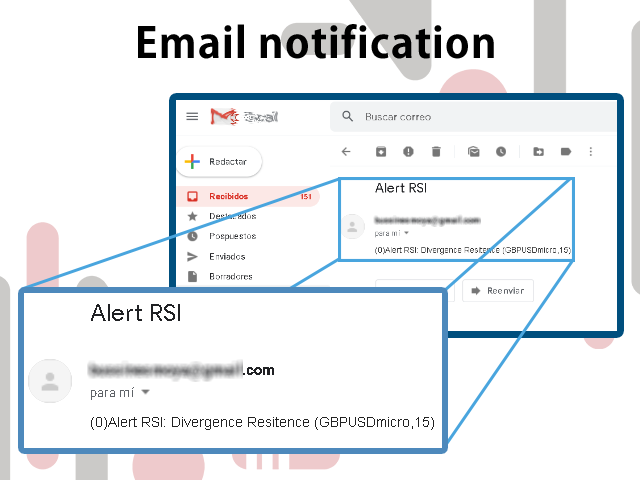
  • The indicator allows to generate alerts in different configurations (mobile application - Push, email, desktop application) when divergences and overpricing are detected
  • Alerts can be repeated for the same event to guarantee or to recognize the RSImaxmin
  • The RSImaxmin simplifies the parameters as much as possible, so that the trader can avoid complex settings
  • The RSImaxmin is valid for any asset and any time horizon
  • It can be used in strategies based solely on this indicator or it can be combined with other indicators
  • You can set the color of the indicator trend lines
  • Optimized and tested algorithm to ensure that it is always in service

contains:

  • Oscillatory line RSImaxmin
  • Two lines of dynamic levels of supports and resistances in the oscillator signal
  • Three fixed level lines, “resist OB", 50 and " support OS" (although you can add or remove lines at any level that the trader deems necessary in the setup)

Parameters

  • RSI Period is thecandlestick period used to calculate the value of the RSI oscillator
  • Tolerance to take as a max is the value used as a condition for accepting a peak as a new maximum
  • Tolerance to take as a min is the value used as a condition to accept a peak as a new minimum
  • Price and RSI calculation Kind the algorithm can use all forms of price calculation including HL/2, HLC/3 and HLCC/4  
  • Activate the cleaner RSI this is true if you want to use the filter on the oscillator to reduce signal noise
  • View divergence (circle) is true if you want to display circles in the oscillator at the points where divergence occurred
  • View overprice (square) is true if you want to display square in the oscillator at points where overpricing is detected
  • View trend in chart (arrow) is true if you want to see an arrow on the candlestick chart indicating the possible trend according to RSImaxmin oscillator.
  • View support and resist levels is true if you want to see support and resistance calculated automatically
  • Alert Settings This parameter allows you to choose the alerts you want to receive regarding the indicator. These can be:
    • alerts_ off 
    • maxmin_ Divergences 
    • max_ Divergences 
    • min_ Divergences 
    • overbought 
    • oversold 
    • overbought_ sold 
    • all_ alerts 
  • Alert Kind are the options that the program allows to notify you of an event (mobile application, email, desktop application). These can be:
    • Mobile (you must have this option activated on your MT5 platform)
    • Email (you must configure your MT5 platform to receive emails)
    • Desktop 
    • Alls choose 
  • Alert repetition per event these are the times you can repeat an alert for the same event. You can repeat an alarm 1, 3, 5 and 10 times as you think necessary

If you have any questions or suggestions, you can contact me via the following link.

Bewertungen 9
odymt5
175
odymt5 2021.10.05 13:54 
 

Thank you for an excellent indicator, easy to use.

Paul Bell
133
Paul Bell 2021.04.05 10:41 
 

very useful product

baraka fadi
50
baraka fadi 2020.12.04 16:02 
 

The best indicator ever, precious tool, Thank you

Empfohlene Produkte
Sync In Many Ways MT5
Sa No Tsuyoshi Kokorozashi
Description This is a Utility tool for MT5 which will make our chart analysis task quite more efficient and save large amount of time. As for chart analysis, some are watching out several symbol simultaneously with single timeframe and others are trading only one single pair with   multi timeframe analysis. For both, a common troublesome issue is “scroll chart to look back” or “draw chart objects” in multi charts at the same time.  Especially for those who are trading with multi timeframe soluti
59 USD
One Direction Pro is a combination of hedging, Grid averaging, pyramiding, lot martingale - anti martingale strategies, which aims to enter and exit the market as quickly as possible so as not to be trapped by unexpected market changes. Signal | Bot Explanation  |  MT4 version  |  Setfile:    pls  leave a message on the comment tab, I will send you the latest setfile Expert parameters: 1. Manage Open Positions + Trade Buy: allow buy + Trade Sell: allow sell + Select Entry Method + Period
199 USD
Meditation Seed: Meditation is a practice in which an individual uses a technique – such as mindfulness, or focusing the mind on a particular object, thought, or activity – to train attention and awareness, and achieve a mentally clear and emotionally calm and stable state.[1][2][3][4][web 1][web 2] Meditation is practiced in numerous religious traditions. The earliest records of meditation (dhyana) are found in the Upanishads, and meditation plays a salient role in the contemplative repertoire
FREE
UPDATE MAR/20 OBS: Please after purchase contact US via CHAT to suport. This Product is a Market Scanner based on Didi Index Indicator. He can scan all time frames of Symbols in Market Watch, client can customize according the demand, its can scan a single symbol or more than 100. Manual: Link Driver Link do Manual Video:   LINK The Scanner informs 4 kind of signals, all alerts are providing from Didi Index Indicator: 1 - Didi Index - Alert of Buy : Cross up of "Curta" short moving averag
30 USD
Time Closer can help you closing all the open position at the specified time "Everyday". Mainly for Day trader that don't want to hold position overnight, or over different session, or over a specific time. Simple Parameter to use. Usage Download and drag Time Closer on the chart (Chart Symbol should be the same Chart Symbol as you want the position close) Check Allow AutoTrading is "On" Set parameters Input Parameters Turnon  True - Turnon the utility False - Turnoff the utility Close all S
30 USD
Binance Spot Realtime Live Tick data for Metatrader 5 Its a Tick ( Bid Ask Last ) based Live Data, It shows Bid Ask Last Volume and Spread which can be useful by EA for buy and sell. The information of Tick are fetched from Binance Websocket and candlesticks are plotted on 1min chart, Other timeframes are automatically updated by Metatrader5. For more information, Read Blog : https://www.mql5.com/en/blogs/post/749488 Why you should buy this product? There are many EAs which requires Spread and
40 USD
P Booster Pro is the developed version of P Booster.  Pro version allows adjusting 5 parameters: - RiskPerc: p ercent of the biggest lot that is available according to equity. - PriceFellPercent: difference between the choused candle ( WhichCandleM15From ) and the Candle 1 price in percent. - StopLossLevel: Stop loss level in percent point. For example: 30 = 99,7% of the Ask price. - WhichCandleM15From: M15 Candle ID from where the expert will check the PriceFellPercent level and compare it with
40 USD
Statistics Boom and Crash
Marcelo Jose Patino Vargas
SYSTEM DESCRIPTION Our MT5 EA uses an advanced statistical system to determine the optimal time to open sell positions on the BOOM 1000, BOOM 500, and BOOM 300 assets. Based on rigorous market data analysis, the EA identifies the moment when there is a 90% probability of a bearish candle, allowing our users to enter a sell position with maximum confidence in success. This data-driven approach is the key to achieving profitable and consistent trades in BOOM 1000, and our EA is designed to automat
500 USD
The professional   browser  of News and Trading Sessions is now available in MetaTrader 5. Now all the most important market information is collected on one dial! News located on the Time scale. Planning your working time has never been so easy and convenient ... The news scale can be switched a day, two, a week, a month forward or backward (see the details in the short video). All news updates in real time. Thanks to the built-in filters, you can configure the display of news by importanc
79.88 USD
Dieser Indikator ist ein perfekter automatischer Wellenanalyse-Indikator für den praktischen Handel! Die standardisierte Definition des Bandes ist nicht mehr eine Welle von verschiedenen Leuten, und das Ziehen von menschengemachten Interferenzen wird eliminiert, was eine Schlüsselrolle bei der gründlichen Analyse des Ansatzes spielt. =>Increase the choice of international style mode, (red fall green rise style)           Derzeit Kaufrabatt!   Inhalt des Index: 1.       Grundwelle:   Zue
188 USD
For any trader, the result of market analysis is the correct determination of entry and exit points from the market. The ClearArrows indicator does not display any unnecessary information that may distract or mislead the trader, but only the most important thing. The indicator is very easy to use, when a down arrow appears, you need to open a SELL deal, when an up arrow appears you need to open a BUY deal. The ClearArrows indicator, despite its outward simplicity, has a large analytical algor
39 USD
Candle Info For selected candle: OHLC prices Open Time Bar shift body size in points upper shadow in points Lower shadow in points Candle length in points Tick volume For current candle: Remaining time Ticks/sec For the chart: Price at mouse position Time at mouse position Draw Lines For selected candle you can draw a projected line forward, backward or both ways. You can hide/show/delete all lines created.
30 USD
Scorpion Trader
Renato Takahashi
O Scorpion Trader é um robô trader de negociação automática projetado especificamente para a bolsa brasileira B3. Ele utiliza uma estratégia exclusiva baseada na técnica japonesa Heikin Ashi para identificar pontos de reversão (mean reversion). Para calcular a tendência, o robô usa a técnica de médias móveis e candlesticks Heiken Ashi. Ele posiciona ordens de compra e venda nos pontos de reversão, com base em stops fixos ou variáveis ​​determinados com base em candlesticks anteriores. O robô ta
100 USD
Utilities
Douglas Lucio De Araujo
Indicator with 3 features - Clock : Clock independent of the chart, counting continues even when the market is closed. - Template : After setting up a configuration in any graphic, be it color patterns, indicators, zoom ... The configuration will be copied to all active graphics. - TimeFrame : Set the TimeFrame on a chart, and with just one click all the active charts will be changed to the same TimeFrame.
30 USD
This easy to setup indicator shows you the market volumes in a different way, with support and resistance as showed. You can setup: - Backdays volume to show - Heiken Ashi candle view It works for every kind of graph and every kind of period. The program shows the volumes based on the number of candles displayed in the chart: the more candles the more volumes. Enjoy this very useful indicator. Please feel free to message me to report any kind of improvements! :D
69 USD
Leopard EA MT5
Botond Ratonyi
Leopard EA   This EA designed to be consistently profitable and flexible to market changes, it uses a complex fusion of candlestick patterns, Moving averages and Relative strength index. Pairs it works on:  default settings  on EURUSD M15! ---USDJPY(set file in comments) ---USDCHF(set file in comments) Leopard EA  is a fully automated expert Advisor with    secure stop loss level. DOES NOT USE Dangerous systems like the Grid, martingale and other risky strategies.  If you have
299 USD
This is my own modified version of the RMI indicator. Its one of the best indicators i've found to take small profits from the market and i've been able to make it slightly better by modifying and fine tuning some parts Default settings works best for M1 timeframe The Relative Momentum Index calculates a ratio of upwards changes to downwards changes in prices over N-period bars. The RMI values range between 0 and 100. 30 and 70 are the two levels of oversold and overbought market conditions re
500 USD
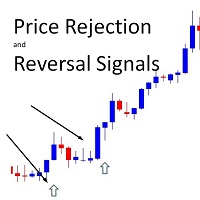
!! FLASH SALE !!   Over 75% off !!     For ONE week only. Now only $57 - normally $297! Ends on 31 March - Don't miss it! Buy And Sell Signal Arrows On The Chart When The Price Is About To Reverse. Also Sends Alerts – On MT5 To Your Phone To Your Email. Does not repaint. Works on any pair, any timeframe.   (Just ajust the settings for your pair and timeframe.) 10 Activations allowed so you are free from limitations MT4 version here .   What is Price Rejection and Reversal and w
57 USD
Mit diesem Produkt in Form einer Dienstleistung ist es nun möglich, eigene Symbole aus den von Yahoo Finance bereitgestellten Daten zu erstellen. Der Dienst wird innerhalb der Plattform im Hintergrund ausgeführt und aktualisiert ständig unsere bevorzugten Zeitreihen, die nicht auf Ihrem Broker verfügbar sind. Dies ist nützlich für die Entwicklung von Intermarket-Strategien, zum Beispiel bieten nicht alle Broker den VIX-Index oder den DOLLARINDEX oder die T-BOND-Kurse an. Mit diesem Produkt
30 USD
Introduction This indicator detects volume spread patterns for buy and sell opportunity. The patterns include demand and supply patterns. You might use each pattern for trading. However, these patterns are best used to detect the demand zone (=accumulation area) and supply zone (=distribution area). Demand pattern indicates generally potential buying opportunity. Supply pattern indicates generally potential selling opportunity. These are the underlying patterns rather than direct price action. T
80 USD
This Indicator adding power to traditional zigzag indicator. With High-Low numbers in vision it will be easier to estimate change of trend by knowing the depth of each wave. Information including points, pips, percentage%, and #bars can be displayed based on configuration. All information is real-time update. This indicator is especially useful in sideway market to buy low sell high.
40 USD
Keys to Market
Anatolii Mel'sitov
Hallo! Mein Name ist Anatoly Melsitov. Ich bin ein professioneller Händler mit Erfahrung im Handel auf den Margenmärkten der Forex- und Moskauer Börse und handele insgesamt seit etwa 14 Jahren. Während der ganzen Zeit des Handels habe ich enormes Wissen, Erfahrung und Verständnis für das Wesen des Marktes gewonnen. Ich möchte Ihnen sagen, dass der Markt für einen Anfänger ein Ort zu sein scheint, an dem Sie leicht Gewinne erzielen können. Aber das ist eine Illusion und ein großer Fehler. Der Mar
900 USD
Forex is the most liquid market in the world. For this reason real volumes are not available. Some indicators use the number of ticks, in other cases the broker can supply volumes informations but they will be only data about that broker. Volumes are important becase they will form the price and volatility of the market. Using an algorithm this indicator can give you a very good approximation of the volumes for each candle. How to read the indicators? This version provides you many visualiza
67 USD
Vol 2 DPOC volume vol 2 DOC-dynamic horizontal volume indicator for any time periods Main settings of the indicator: Volume Source -selecting data for volumes (tick or real) DPOCOn -enabling / disabling the indicator DPOCFrom -calculation start date DPOCTo -settlement end date The indicator allows you to manually select areas on the chart to analyze changes in the maximum volume over time. You can do this by using vertical lines and moving them along the chart. Or by setting specific dates
30 USD
The third indicator from the set for market analysis. The first one is here:  https://www.mql5.com/ru/market/product/65258 The second one is here: https://www.mql5.com/ru/market/product/65347 The indicator builds a channel of maximum price fluctuations for a specified period. Additionally, the middle of the channel is drawn. All color settings, line types are customizable. The indicator allows you to see the picture of price movement from a slightly different angle. You can use several in
30 USD
(Krypto-Währungsdiagramme) Es bringt die Historie so viel wie die Anzahl der von Ihnen angegebenen Balken und beginnt, die sofortigen Daten direkt anzuzeigen. Bietet die Möglichkeit, in allen Zeitrahmen zu arbeiten. Ermöglicht das Arbeiten mit mehreren Symbolen. Diese App ist ein Hintergrunddienst. Es lädt den Verlauf aller Symbole herunter, die mit "S" auf dem Marktbeobachtungsbildschirm beginnen, und zeigt die Ticks-Daten an. Überträgt automatisch Echtzeit-Handelsdaten von
70 USD
AutoSignals Trend
Aurelio Miguel Machado Da Silva
Der Indikator verfolgt den Trend in 5 verschiedenen Chartzeiten für dasselbe Asset, basierend auf 6 Signalen für jede Chartzeit.  Das Hauptziel des Indikators besteht darin, uns den Mehrheitstrend des finanziellen Vermögenswerts zu zeigen, in den er platziert wurde. Das System überträgt die Informationen der Trends in mehreren grafischen Zeiten. Auf diese Weise hat der Benutzer einen umfassenden Überblick über die Bewegung des Assets. Diese Art von Tool ermöglicht dem Benutzer eine höhere Treffe
40 USD
Speed GBPUSD required set file Live Siqnal Only 3 copies left at 49 USD. Next price is 99 USD - This is an aggressive trading system, designed to maximize your deposit! Just a few simple parameters will make your work with the Speed GBPUSD much easier. The strategy is based on the best of many scalping strategies with the addition of the author's methodology! Recommendations for trading: - GBPUSD H1 currency pair - Leverage 1:500 or higher - Minimum deposit 100 units of the currency Attent
49 USD
Momentum Squeeze indicator is a next-level oscillator. It helps you to recognize whether the momentum is rising or declining with high precision . It uses relative highs and lows, volumes, ranges and an advanced statistical methods to determine current momentum strength.  Momentum Squeeze is great tool when deciding whether you should trade with or counter trend. Inputs: Analysis period --> Period used for determining momentum  Upper Level --> Only for visualization purposes, upper li
47 USD
This indicator helps you control several pairs in a small workspace, therefore, it is not necessary to open several charts on the platform to do so. The indicator shows sequentially up to 6 different pairs, besides that each of these pairs has a button with which you can stop the indicator to observe the selected pair. Place the indicator on a chart to monitor several pairs and the rest of your space use it on the chart of the pair you wish to observe in detail.   MT4 version       Parameters Ob
30 USD
Käufer dieses Produkts erwarben auch
Dies ist ein Indikator für MT5, der genaue Signale für den Einstieg in einen Handel ohne Repainting (Neuzeichnen) liefert. Er kann auf alle Finanzwerte angewendet werden: Forex, Kryptowährungen, Metalle, Aktien, Indizes. Er liefert ziemlich genaue Schätzungen und sagt Ihnen, wann es am besten ist, eine Position zu eröffnen und zu schließen. Sehen Sie sich das Video (6:22) mit einem Beispiel für die Verarbeitung nur eines Signals an, das sich für den Indikator gelohnt hat! Die meisten Händler ver
125 USD
Gold Stuff mt5
Vasiliy Strukov
4.97 (92)
Gold Stuff mt5-Ein Trendindikator, der speziell für Gold entwickelt wurde, kann auch auf allen Finanzinstrumenten verwendet werden. Der Indikator wird nicht neu gezeichnet und verzögert sich nicht. Empfohlener Zeitrahmen H1. WICHTIG! Kontaktieren Sie mich sofort nach dem Kauf, um Anweisungen und Bonus zu erhalten! DATEN Draw Arrow - inkl.aus. zeichnen von Pfeilen in einem Diagramm. Alerts-inkl.aus.akustische Warnungen. E - mail notification-inkl.aus. benachrichtigungen per E-Mail. Puch-
125 USD
ICT, SMC, SMART MONEY CONCEPTS, SMART MONEY, Smart Money Concept, Support and Resistance, Trend Analysis, Price Action, Market Structure, Order Blocks, BOS/CHoCH,   Momentum Shift, HH/LL/HL/LH,    Fair Value Gap, FVG,  Premium  &   Discount   Zones, Fibonacci Retracement, OTE, Buy Side Liquidity, Sell Side Liquidity, BSL/SSL Taken, Equal Highs & Lows, MTF Dashboard, Multiple Time Frame, BigBar, HTF OB, HTF Market Structure,  Liquidity Voids, Long Wicks, Candle Timer, Fractals, ZigZag, Time Zone
63 USD
Advanced Supply Demand MT5
Bernhard Schweigert
4.36 (11)
Derzeit 33% Rabatt! Die beste Lösung für jeden Anfänger oder erfahrenen Händler! Dieser Indikator ist ein einzigartiges, qualitativ hochwertiges und erschwingliches Trading-Tool, da wir eine Reihe von proprietären Funktionen und eine neue Formel integriert haben. Mit diesem Update werden Sie in der Lage sein, doppelte Zeitrahmenzonen anzuzeigen. Sie können nicht nur einen höheren TF (Zeitrahmen) anzeigen, sondern sowohl den Chart-TF als auch den höheren TF: SHOWING NESTED ZONES. Alle Supply Dema
199 USD
Blahtech Supply Demand MT5
Blahtech Limited
4.45 (11)
Supply Demand uses previous price action to identify potential imbalances between buyers and sellers. The key is to identify the better odds zones, not just the untouched ones. Blahtech Supply Demand indicator delivers functionality previously unavailable on any trading platform. This 4-in-1 indicator not only highlights the higher probability zones using a multi-criteria strength engine, but also combines it with multi-timeframe trend analysis, previously confirmed swings and engulfing detecto
142 USD
Royal Wave Pro M5
Vahidreza Heidar Gholami
5 (2)
Royal Wave is a Trend-Power oscillator which has been programmed to locate and signal low-risk entry and exit zones. Its core algorithm statistically analyzes the market and generates trading signals for overbought, oversold and low volatile areas. By using a well-designed alerting system, this indicator makes it easier to make proper decisions regarding where to enter and where to exit trades. Features Trend-Power Algorithm Low risk Entry Zones and Exit Zones Predictions for Overbought and Over
129 USD
Matrix Arrow Indicator MT5
Juvenille Emperor Limited
5 (11)
Matrix Arrow Indicator MT5   ist ein einzigartiger 10-in-1-Trend, der zu   100 % nicht neu gezeichnet   werden kann. Multi-Timeframe-Indikator, der für alle Symbole/Instrumente verwendet werden kann:   Forex ,   Rohstoffe ,   Kryptowährungen ,   Indizes ,   Aktien .  Der  Matrix Arrow Indicator MT5  wird den aktuellen Trend in seinen frühen Stadien bestimmen und Informationen und Daten von bis zu 10 Standardindikatoren sammeln, die sind: Durchschnittlicher Richtungsbewegungsindex (ADX) Rohstoff
75 USD
Market Profile defines a number of day types that can help the trader to determine market behaviour. A key feature is the Value Area, representing the range of price action where 70% of trading took place. Understanding the Value Area can give traders valuable insight into market direction and establish the higher odds trade. It is an excellent addition to any system you may be using. Blahtech Limited presents their Market Profile indicator for the MetaTrader community. Inspired by Jim Dalton’s
142 USD
Owl Smart Levels MT5
Sergey Ermolov
5 (1)
Indikator-Leitfaden  |  Owl Smart Levels-Strategie  |   MT4-Version  |  Wie installiert man?   |   FAQ Der Owl Smart Levels Indikator ist ein komplettes Handelssystem innerhalb eines Indikators, der so beliebte Marktanalysetools wie die fortschrittlichen Fraktale von Bill Williams , Valable ZigZag, das die richtige Wellenstruktur des Marktes aufbaut, und Fibonacci-Levels , die die genauen Einstiegslevels markieren, enthält in den Markt und Orte, um Gewinne mitzunehmen. Eine detaillierte Beschre
97 USD
Royal Scalping Indicator M5
Vahidreza Heidar Gholami
5 (8)
Royal Scalping Indicator is an advanced price adaptive indicator designed to generate high-quality trading signals. Built-in multi-timeframe and multi-currency capabilities make it even more powerful to have configurations based on different symbols and timeframes. This indicator is perfect for scalp trades as well as swing trades. Royal Scalping is not just an indicator, but a trading strategy itself. Features Price Adaptive Trend Detector Algorithm Multi-Timeframe and Multi-Currency Trend Low
149 USD
Automated Trendlines MT5
Georgios Kalomoiropoulos
Trendlinien sind das wichtigste Werkzeug der technischen Analyse im Devisenhandel. Leider zeichnen die meisten Händler sie nicht richtig. Der automatische Trendlinien-Indikator ist ein professionelles Tool für ernsthafte Trader, das Ihnen hilft, die Trendbewegung der Märkte zu visualisieren. Es gibt zwei Arten von Trendlinien Bullische Trendlinien und Bärische Trendlinien. Im Aufwärtstrend wird die Forex-Trendlinie durch die niedrigsten Swing-Punkte der Preisbewegung gezogen. Wenn man m
99 USD
Stargogs Spike Catcher
Lorenzo Edward Beukes
5 (6)
Stargogs Spike Catcher V3 This Indicator is Developed To milk the BOOM and CRASH indices . Send me Message if you need any help with the indicator.  CHECK OUT THE STARGOGS SPIKE CATCHER EA/ROBOT V3: CLICK HERE ALSO CHECK OUT SECOND TO NONEFX SPIKE CATCHER:   CLICK HERE STARGOGS SPIKE CATCHER V3 WHATS NEW! Brand New Strategy. This is the Indicator you need for 2023. The Indicator Gives you an Entry at a time when conditions are met and you should use TP & SL. New Trendline that changes color in
100 USD
Introduction to X3 Chart Pattern Scanner X3 Cherart Pattern Scanner is the non-repainting and non-lagging indicator detecting X3 chart patterns including Harmonic pattern, Elliott Wave pattern, X3 patterns, and Japanese Candlestick patterns. Historical patterns match with signal patterns. Hence, you can readily develop the solid trading strategy in your chart. More importantly, this superb pattern scanner can detect the optimal pattern of its kind. In addition, you can switch on and off individu
250 USD
Strong Support mt5
Vasiliy Strukov
5 (5)
Unterstützungs- und Widerstandsniveaus sind seit langem ein mächtiges Werkzeug für die Marktanalyse. Der Strong Support Indikator baut Unterstützungsniveaus auf lokalen Preistiefs und Widerstandsniveaus auf lokalen Preishochs auf. Meine anderen Entwicklungen finden Sie hier Es wird empfohlen, in Verbindung mit einem Trendindikator wie Gold Stuff zu verwenden, um den Trend zu handeln und gleichzeitig Konsolidierungs- oder Umkehrzonen zu definieren sowie Stop-Loss und Take-Profit auf Unterstü
125 USD
Trend Scanner mt5 GS
Vasiliy Strukov
5 (6)
Trend Scanner scannt Markttrends aus Multi-Symbolen und Multi-Time-Frames und zeigt sie auf einem beweglichen Panel auf dem Chart an, den er zur Analyse verwendet. Der Händler kann mehrere Paare seiner Wahl zur Anzeige auswählen. Trend Scanner ist ein großartiges Tool, um die Richtung des Trends zu sehen, und kann für den manuellen Handel oder den EA-Handel verwendet werden, indem nur Kauf- oder Verkaufsaufträge gemäß dem Trend zugelassen werden. Echtzeit-Ergebnisse können hier eingesehen wer
125 USD
Offer 249 down from 350 for the next 3 copies. then back to 350 $ Are you tired of using outdated indicators that leave you guessing where to set your profit targets? Look no further than the AK CAP Opening Range Breakout Indicator. This powerful tool is backed by a US patent and has already helped countless traders pass funded challenges like FTMO. We use it daily on our prop traders and internal funds, and now it's available to you as well. The calculation behind the indicator is incredibly
249 USD
Automatisierte Angebots- und Nachfragezonen der nächsten Generation. Neuer und innovativer Algorithmus, der bei jedem Diagramm funktioniert. Alle Zonen werden dynamisch entsprechend der Preisbewegung des Marktes erstellt. ZWEI ARTEN VON WARNUNGEN --> 1) WENN DER PREIS EINE ZONE ERREICHT 2) WENN EINE NEUE ZONE BILDET WIRD Sie erhalten keinen weiteren nutzlosen Indikator. Sie erhalten eine vollständige Handelsstrategie mit nachgewiesenen Ergebnissen.     Neue Eigenschaften:    
149 USD
PZ Day Trading MT5
PZ TRADING SLU
2.6 (5)
Dieser Indikator erkennt Preisumkehrungen im Zick-Zack, wobei nur Preisaktionsanalysen und ein Donchian-Kanal verwendet werden. Es wurde speziell für den kurzfristigen Handel entwickelt, ohne dass ein Nachlackieren oder ein Backpainting erforderlich ist. Es ist ein fantastisches Werkzeug für clevere Trader, die darauf abzielen, das Timing ihrer Operationen zu verbessern. [ Installationsanleitung | Update-Anleitung | Fehlerbehebung | FAQ | Alle Produkte ] Erstaunlich einfach zu handeln Es bi
125 USD
Italo Volume Indicator MT5
Italo Santana Gomes
5 (9)
BUY INDICATOR AND GET EA FOR FREE AS A BONUS + SOME OTHER GIFTS! ITALO VOLUME INDICATOR  is the best volume indicator ever created, and why is that? The Indicator works on all time-frames and assets, indicator built after 6 years of experience on forex and many other markets. You know many volume indicators around the internet are not complete, does not help, and it's difficult to trade, but the Italo Volume Indicator is different , the Italo Volume Indicator shows the wave volume, when market
65 USD
Sind Sie es leid, Unterstützungs- und Widerstandslinien zu zeichnen? Der Unterstützungswiderstand ist ein Multi-Zeitrahmen-Indikator, der Unterstützungs- und Widerstandslinien mit einer sehr interessanten Wendung automatisch erkennt und zeichnet: Wenn das Preisniveau im Laufe der Zeit getestet wird und seine Bedeutung zunimmt, werden die Linien dicker und dunkler. [ Installationsanleitung | Update-Anleitung | Fehlerbehebung | FAQ | Alle Produkte ] Steigern Sie Ihre technische Analyse über Nacht
99 USD
• Non Repaint • DelayNo Lag •Pop Up notification • 98% Verified Accuracy • Real time arrows to catch spikes at least 4-8 bars We forward guide video how milk spikes  We also add in telegram group for better quality help  +see live trading results  https://youtu.be/DCG4CAWlg4I you will see an arrow signal and open trade for spike stop-loss of trade will be 8 or 10 candles if no spike exit you just need to follow spike arrow signals and for more good results follow inst
200 USD
Divergenzen sind schwierig zu finden und seltener anzutreffen. Sie sind eines der zuverlässigsten Handelsszenarien. Dieser Indikator sucht automatisch mit Ihrem bevorzugten Oszillator nach regelmäßigen und versteckten Abweichungen. [ Installationsanleitung | Update-Anleitung | Fehlerbehebung | FAQ | Alle Produkte ] Einfach zu handeln Findet regelmäßige und versteckte Abweichungen Unterstützt viele bekannte Oszillatoren Implementiert Handelssignale basierend auf Ausbrüchen Zeigt geeignete
125 USD
Wolfe Waves sind natürlich vorkommende Handelsmuster, die an allen Finanzmärkten vorhanden sind und einen Kampf um einen Gleichgewichtspreis darstellen. Diese Muster können sich über kurze und lange Zeiträume entwickeln und sind eines der zuverlässigsten prädiktiven Umkehrmuster, die es gibt und die normalerweise starken und langen Kursbewegungen vorausgehen. [ Installationsanleitung | Update-Anleitung | Fehlerbehebung | FAQ | Alle Produkte ] Klare Handelssignale Erstaunlich einfach zu handeln
99 USD
Relative Cyclicality
Cristian Mihail Pauna
The Relative Cyclicality indicator defines the cycles of any price evolution. This indicator is computed by applying the "Cyclicality" mathematical transformation to the classic Relative Strength Index indicator made by J. Welles Wilder. The Relative Cyclicality defines very good entry and exit trading signals near the minimal and maximal points. It is better than RSI itself due to the unicity of the minimal and maximal points on a specific time interval. The Relative Cyclicality indicator can b
300 USD
Price Cyclicality MT5
Cristian Mihail Pauna
The Price Cyclicality indicator defines the cycles of any price evolution. It shows clearly the ascending and descending intervals with asymptotic evolution near the minimal and maximal price values. The Price Cyclicality indicator can be used to generate automated entry signals near the minimal price values. Also, the Price Cyclicality indicator can be used to define limit conditions to generate automated exit signals near the maximal price values. The efficiency of this indicator was proved du
300 USD
Trade system "PAX Multi TMA/HMA 8" for MT5 it is a ready-made trading system for trading on any instrument and any timeframe. An experienced trader on one instrument can get a profit   from 100% to 400% per day . Completely ready for manual trading and use in robots. Not redrawn signals. It is convenient to work on any timeframe. Tested on metals, currency pairs, oil, international stocks, Russian stocks, cryptocurrencies, monetary and cryptocurrency indices. What the trading sy
144 USD
FIBO Trend PRO mt5
Evgenii Aksenov
5 (3)
The indicator allows you to instantly determine the current trend by color and FIBO levels. Higher Timeframe the panel shows the current trend of higher periods, helping to determine the strength of the trend. Trade according to the trend when changing the color of candles or trade against the trend when the price hit the extreme levels of the FIBO Trend PRO  indicator   Advantages of the FIBO Trend PRO Indicator never repaint and does not change their values Very easy to use and intuitive App
75 USD
TrendLine PRO MT5
Evgenii Aksenov
4.78 (50)
The Trend Line PRO indicator is an independent trading strategy. It shows the trend change, the entry point to the transaction, as well as automatically calculates three levels of Take Profit and Stop Loss protection Trend Line PRO is perfect for all Meta Trader symbols: currencies, metals, cryptocurrencies, stocks and indices Advantages of Trend Line PRO Never redraws its signals The possibility of using it as an independent strategy It has three automatic levels Take Profit and Stop Loss lev
75 USD
Use of support and resistance in systematic trading is very subjective. Every trader has their own idea and way to plotting the support and resistance levels on the chart. KT Support and Resistance indicator take out this ambiguity out of the situation and automatically draws support and resistance levels following an algorithmic approach using a unique multi-timeframe analysis. When launched on the chart, It immediately scan the most significant extreme points across all the available timefr
120 USD
Fear and Greed MT5
Diego Arribas Lopez
5 (1)
MT4-Version   Angst und Gier MT5-Indikator Sie sind sich nicht sicher, ob Sie Ihren Gewinn ganz oder teilweise realisieren möchten? Fear and Greed MT5 hilft enorm mit einem hohen Maß an Zuverlässigkeit bei solchen Entscheidungen. JETZT KOSTENLOS AUSPROBIEREN! Fear and Greed MT5 ist der erste Indikator, der Informationen über das Ausmaß von Angst und Gier auf dem MT5-Markt liefert. Es wurde entwickelt, um die Entscheidungsfindung beim Handel zu erleichtern und vollständige oder teilweise Gewinne
129 USD
Weitere Produkte dieses Autors
MACDmaxmin free demo
Carlos Andrés Moya Erazo
5 (2)
The indicator shows when there are overpricing and divergences over a normalized MACD Plus, it displays signals with configurable alerts, self-regulating dynamic overprice levels, and a simple setup and interface. This indicator automatically calculates markup ranges. MACDmaxmin is an indicator based on the MACD oscillator that effectively identifies trend changes in price, as it is a momentum indicator that captures the trend and shows the relationship between two moving averages of the price.
FREE
MACDmaxmin
Carlos Andrés Moya Erazo
3 (2)
The indicator shows when there are overpricing and divergences over a normalized MACD Plus, it displays signals with configurable alerts, self-regulating dynamic overprice levels, and a simple setup and interface. The indicator that automatically calculates overprices ranges! MACDmaxmin is an indicator based on the MACD oscillator that effectively identifies trend changes in price, as it is a momentum indicator that captures the trend and shows the relationship between two moving averages of th
60 USD
Auswahl:
odymt5
175
odymt5 2021.10.05 13:54 
 

Thank you for an excellent indicator, easy to use.

Welber Goncalves
356
Welber Goncalves 2021.08.03 23:17 
 

O meu está com problema, pois configuro para somente emitir sinal de sobrecompra ele emite sinal de sobrevenda e viceversa.

Carlos Andrés Moya Erazo
6103
Antwort vom Entwickler Carlos Andrés Moya Erazo 2021.08.05 04:33
Saudações, lamentamos o transtorno.
Encontramos o problema e o corrigimos, esperamos que o produto atenda aos seus objetivos. Obrigado por nos ajudar a melhorar.
Êxitos!
Marsterp Marcel
25
Marsterp Marcel 2021.04.19 15:39 
 

Hi i didnt receive my RSImaxmin

Paul Bell
133
Paul Bell 2021.04.05 10:41 
 

very useful product

teodomiro
54
teodomiro 2021.02.06 18:43 
 

it´s good but I have rent the product again but i cannot download it again. could you pls help me with this ...

baraka fadi
50
baraka fadi 2020.12.04 16:02 
 

The best indicator ever, precious tool, Thank you

Pavel Shirykalov
241
Pavel Shirykalov 2020.11.10 08:22 
 

Thank you, an interesting indicator, I'm waiting for an expert

Claudio Jones
140
Claudio Jones 2020.06.09 16:25 
 

Very useful and accurate indicator when making a decision. Carlos Moya provides quality support. I'm happy with the results. Thanks a lot

Dunstan Wafula Namusonge
701
Dunstan Wafula Namusonge 2020.04.09 05:34 
 

Very resourceful

Antwort auf eine Rezension
Version 3.4 2022.03.09
Performance update 2022
Version 3.3 2021.08.14
Overbought and oversold alarm override correction.
Version 3.2 2020.09.08
Resource Optimization
Version 3.1 2020.07.27
New Functions, Trend Arrows on Chart, RSI Signal Enhancement
Version 3.0 2020.07.16
New overpricing indicator included.
Version 2.15 2020.06.19
Optimization of resources and minimum programming corrections.
Version 2.14 2020.06.08
compatibility issues fix.
Version 2.13 2020.06.08
Resource Optimization and minimal programming fixes.
Version 2.0 2020.05.02
Display of divergence points (trend change indicator).
Version 1.50 2020.05.02
Optimization of resources, more intuitive presentation of values.
Version 1.10 2020.04.25
Resource Optimization.