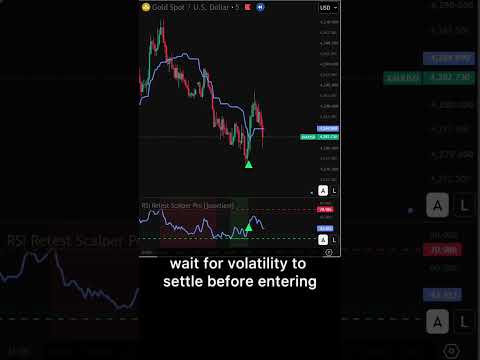
RSI Retest Scalper Pro
- 지표
- 버전: 1.22
- 활성화: 5

RSI Retest Scalper Pro is an advanced RSI retest indicator for MetaTrader 5. It adds two entry modes, Smart Entry and Fast Entry, and a statistics panel.
It draws signals, levels and the panel only. It does not open or manage trades, and it is not a trading robot. Signals are calculated on closed bars. It runs on any symbol and timeframe. The four measured rates below belong to four fixed histories, not to every chart.
How the two entries differ
After the second signal, price can confirm the entry in one of two ways.
- Fast Entry. Price closes beyond the entry line, then the signal is drawn.
- Smart Entry. An extra confirmation, extra entry conditions, and an additional wait window so the setup can form. All four presets use Smart Entry.
Stop Loss sits beyond the setup extreme, plus the stop buffer (default 0.5 × ATR). If that stop would be closer than 0.5 × ATR, the indicator uses 2 × ATR instead. Chart markup runs from 1R to 5R. 1R is this risk. 2R is twice this risk. 3R is three times this risk.
The statistics panel counts, on the bars loaded on the chart, how often 1R (and the other R levels) was reached before the stop. It uses M1 data inside the bar to see which printed first (a touch on M1, not an instant guess). If that order cannot be told, the signal stays in the signal count and is left out of the percentage. It is not counted as a loss. The panel is a reading of past markup on that chart, not a live account and not a forecast.
Settings explained
Change one setting at a time and check the panel on history. Preset = Manual, Gold M5, EURUSD M15, EURUSD M30, NASDAQ M1. Manual keeps your own inputs. The other four apply the measured settings.
Entry Search Window. How many bars after the retest signal the indicator waits for price confirmation. A wider window lets more setups reach an entry, including late ones far from the retest. A narrower window (for example 20) keeps only entries close to the retest impulse.
Entry Line. Thirteen types: EMA, SMA, WMA, RMA/SMMA, VWMA, HMA, DEMA, TEMA, ZLEMA, KAMA, Kalman, ALMA and Kijun. Kijun is the midpoint between the highest high and the lowest low over Line Length. Moving averages use Line Length and Line Source. ALMA also has ALMA Offset (0.85) and ALMA Sigma (6). Kalman does not use Line Length: raising Kalman Process Noise (0.01) makes it follow price faster, raising Kalman Measurement Noise (0.10) makes it smoother.
Trading hours. Choose a time zone (GMT+2, GMT+3, London, New York, Berlin, Dubai or Tokyo) and up to two windows when no new entry is taken. An entry already drawn stays on the chart.
RSI length, extreme levels, cooling, the second top or bottom, Body Beyond Line % and the alerts are in the Inputs list. Default chart is XAUUSD M5. Preset Gold M5 is the measured gold setup: Smart Entry, Kijun, Line Length 26, Entry Search Window 30, extremes 71/29. Choosing a preset applies those measured settings even if the other input rows still show the previous numbers, and the signals recalculate. For EURUSD M15 or M30, change the symbol and timeframe, then pick that preset. NASDAQ M1 is DEMA 10, window 20, New York 09:00–13:00, extra stop 150 ticks. The same NASDAQ preset can be tried on another index; the panel then reads that chart. Four presets are included. After that, tune the inputs yourself.
Four presets
Preset = Manual, Gold M5, EURUSD M15, EURUSD M30, NASDAQ M1. Manual keeps the buyer’s own inputs. The other four apply the measured settings. Two of them are euro. Each one is one symbol, one timeframe and Smart Entry. The figures below are what the statistics panel shows on that history. Profit factor is the panel’s PF on that row: the number of signals that reached that R, multiplied by that R, divided by the number that stopped before that R, written to two decimal places. It is not one factor summed across 1R, 2R and 3R. A shorter chart, another broker’s symbol or later bars will read differently.
Gold, XAUUSD M5. Preset Gold M5. Kijun, Line Length 26, Entry Search Window 30, time zone GMT+3, no new entries 12:00–17:00 and 22:00–04:00. On 100 signals, from 100,000 M5 bars (29 May 2025 – 29 October 2026): 1R 60 (60%), profit factor 1.50; 2R 47 (47%), profit factor 1.77; 3R 40 (40%), profit factor 2.00.
EURUSD M15. Preset EURUSD M15. EMA, Line Length 52, Entry Search Window 40, time zone GMT+3, no new entries 16:00–20:00. On 59 signals, M15 history 18 October 2022 – 29 October 2026: 1R 40 (69%), profit factor 2.22; 2R 27 (47%), profit factor 1.60; 3R 18 (31%), profit factor 1.38.
EURUSD M30. Preset EURUSD M30. Kijun, Line Length 26, Entry Search Window 40, time zone GMT+3, no new entries 16:00–20:00. On 51 signals, from 50,000 M30 bars (18 October 2022 – 29 October 2026): 1R 27 (53%), profit factor 1.13; 2R 20 (39%), profit factor 1.29; 3R 19 (37%), profit factor 1.78.
NASDAQ M1, New York open only. Preset NASDAQ M1, measured on .USTECHCash (NASDAQ-100 cash). DEMA, Line Length 10, Entry Search Window 20, time zone New York, new entries only from 09:00 to 13:00 New York. Extra stop buffer 150 ticks on top of 0.5 ATR. On 106 resolved signals, from 100,000 M1 bars (7 July 2026 – 29 October 2026): 1R 68 (64%), profit factor 1.79; 2R 48 (45%), profit factor 1.66; 3R 34 (32%), profit factor 1.42.
Notes
- Price is 49 USD.
- Load M1 history for the symbol before reading the panel. Without it, stop and target inside one bar are often unknown, and those signals drop out of the percentage.
- On a slow PC, lower Bars to Analyse.
- This is a technical analysis tool, not financial advice. Past signals on a fixed history do not guarantee future results. Test on a demo account and manage your own risk.
- Questions and suggestions are welcome in the Comments tab or via MQL5 private messages.