Cedar Tide AUDCAD

Cedar Tide AUDCAD H2

Historical statistics

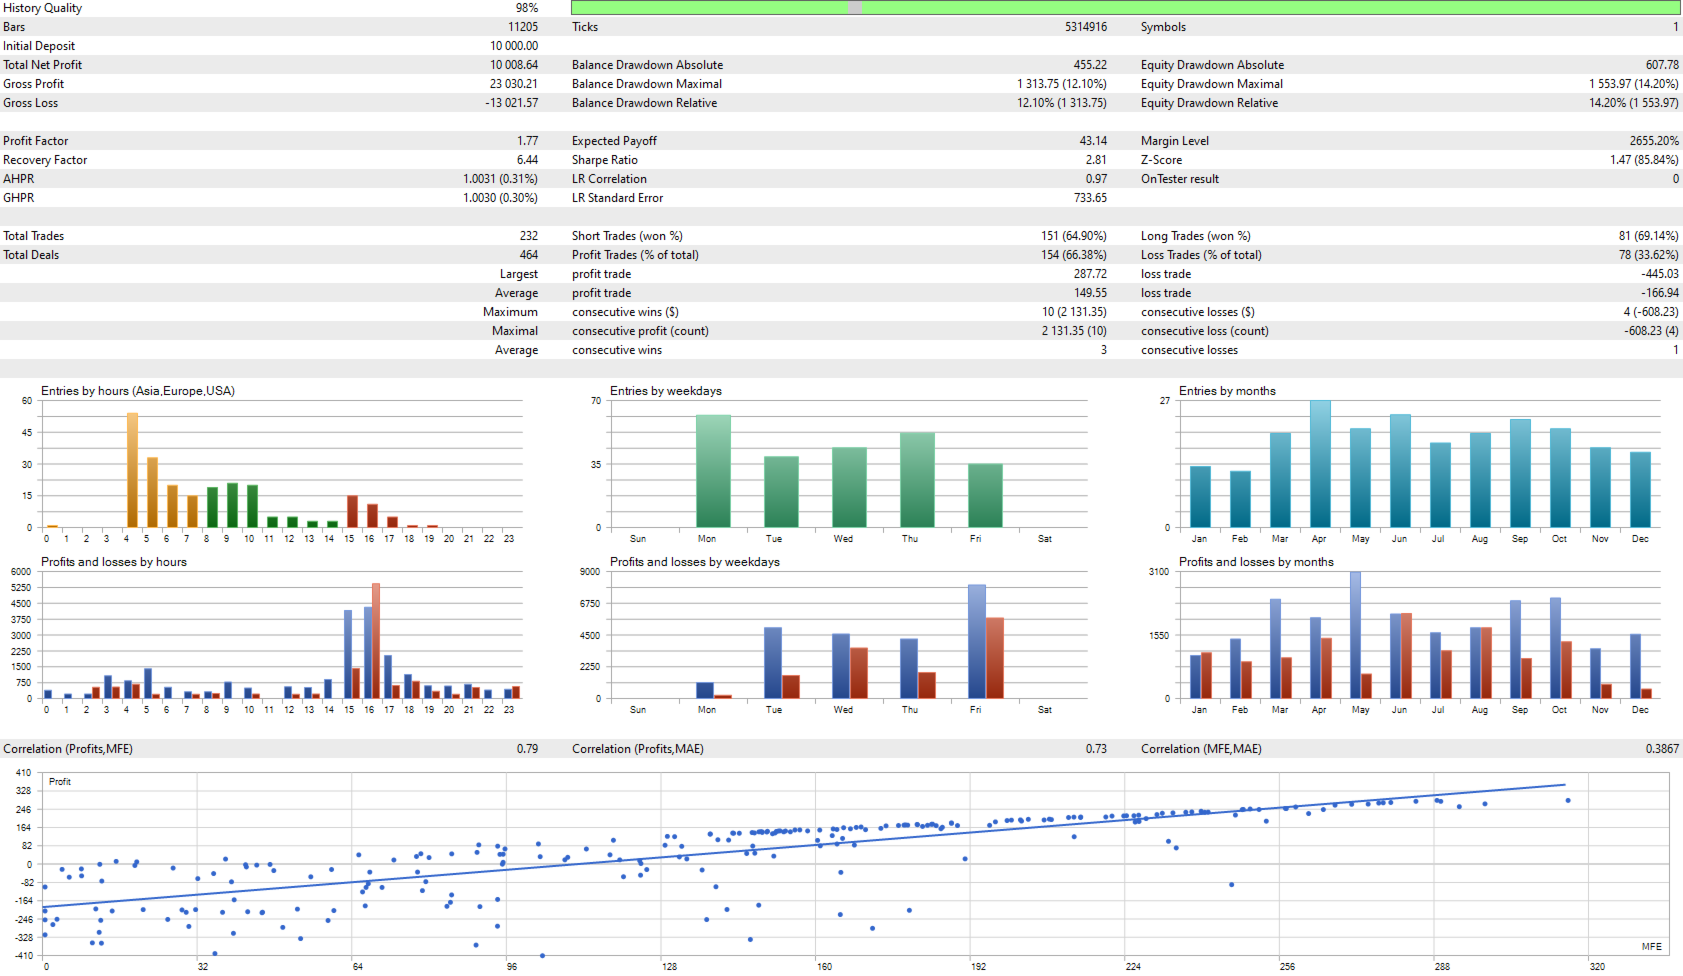
Period: 2023-04-12–2026-09-11
Data split: 70% in-sample / 30% out-of-sample (OOS)
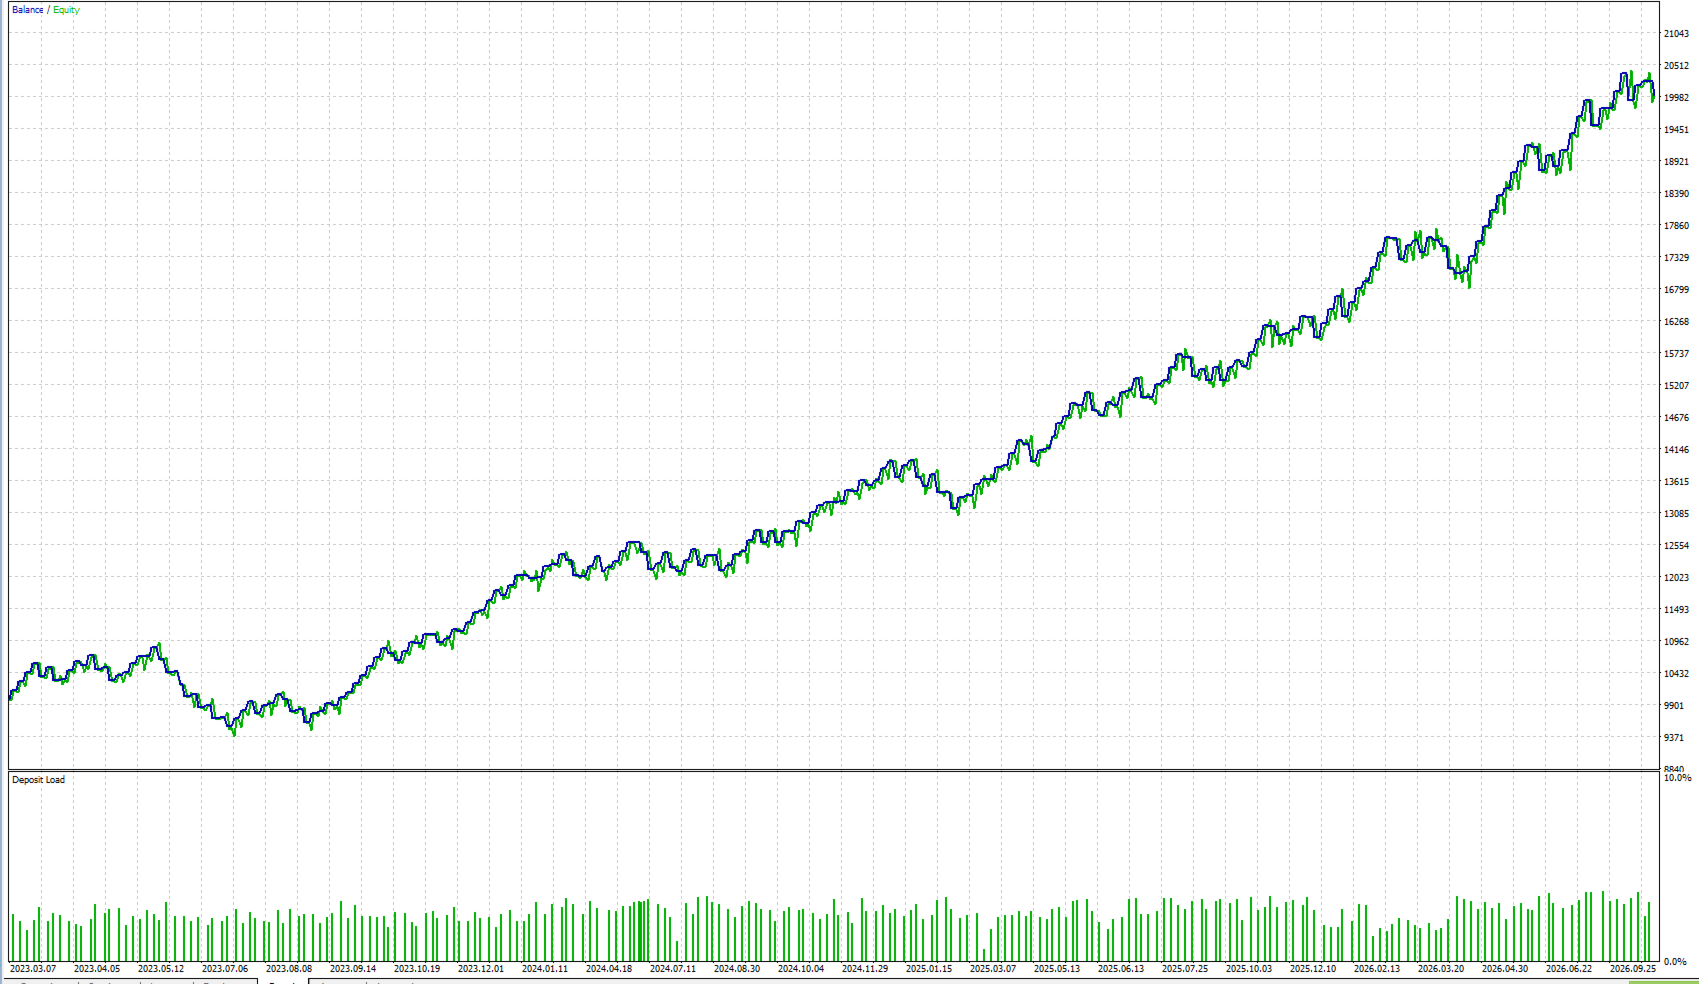
Cumulative return over the full period: 29.94%
Maximum drawdown: 7.26%
Trades: 215
Win rate: 65.58%
Profit factor: 1.71
Reference-test risk: 1.00% per trade
Broker data: Blueberry Markets Pty Ltd
Longest losing streak in the reference test: 4 trades

Historical reference backtest of the source strategy; these are not live results. This version defaults to 2.00% risk per trade. Historical results do not guarantee future returns.

Out-of-sample test

OOS share of historical data: 30%
In-sample share: 70%
OOS return: 10.69%
OOS profit factor: 2.02
OOS win rate: 66.67%
OOS trades: 57

These OOS figures refer to the separately reported out-of-sample section of the historical reference backtest at 1.00% risk per trade. The OOS percentage describes the data split; it is neither a return figure nor the percentage of trades.

Trading approach

Cedar Tide brings a defined technical trading approach to AUDCAD on the H2 chart. It evaluates Williams Percent Range and executes qualifying setups using pending stop orders. The signal rules are built into the expert advisor.

The entry session is 4:00 to 10:00 in broker-server time, subject to the compiled session logic. Signal evaluation uses the most recently completed candle. The stop-loss distance is 3.9 times Average True Range; the take-profit distance is 2.8 times Average True Range.

Volatility-based stop loss and take profit use Average True Range with fixed strategy multipliers. 

Automatic broker checks

Order volume is automatically adjusted to the permitted size per order, volume step and remaining aggregate volume per symbol and direction. Positions and pending orders placed by other EAs or manually on the same account are included. Volume is only reduced. If the remaining allowance is below the minimum volume, the entry is skipped. Broker and margin conditions are checked before new orders; a reached pending-order count limit also blocks additional pending orders. Adjustments and skipped entries are recorded in the MT5 journal under [BROKER-CHECK]. These checks operate automatically in the tester and in live/demo use; no additional settings are required.


Settings

RiskPercent — Risk per trade: default 2.0% of account equity. Position size is calculated from risk and stop-loss distance.
News_Filter_Enabled — News filter on/off, default true. Controls both the event window and the news-day entry block.
Use_Friday_Close — Friday close on/off, default true. When enabled, the EA closes its own positions, deletes its pending orders and blocks further entries on Fridays from 16:05 broker-server time.
Use_Daily_DD_Limit / Daily_DD_Percent — Daily equity-loss limit, default true / 10.0%.
Use_Max_Agg_Risk / Max_Agg_Risk_Pct — Calculated aggregate open-risk limit before new entries, default true / 4.0%.
Use_Max_Margin / Max_Margin_Pct — Account margin limit including the proposed trade, default true / 30.0%.
Use_Profit_Target / Profit_Target_Pct — Eigenkapital-Gewinnziel im Verhältnis zum anfänglichen Kontostand, Standardwert: false / 10,0%.

Strategieparameter, Handelssitzungen, Nachrichtenfenster und Magic Number sind festgelegt. Einstellungen können unter EA-Eigenschaften > Eingaben geändert werden; drücken Sie F7 im Chart.

Nachrichtenfilter

Ist der Nachrichtenfilter aktiviert, prüft er relevante Ereignisse für das gehandelte Symbol. Das Ereignisfenster erstreckt sich von 30 Minuten vor bis 30 Minuten nach der Veröffentlichung. Innerhalb dieses Zeitraums schließt der Expert Advisor (EA) seine eigenen Positionen und löscht seine Pending Orders. Der integrierte Nachrichtenschutz blockiert zudem neue Einstiege an relevanten Ereignistagen. Die Einstellung „News_Filter_Enabled = false“ deaktiviert beide Regeln.

MT5: Tools > Optionen > Expert Advisors > WebRequest für die aufgelistete URL zulassen. Hinzufügen:
https://nfs.faireconomy.media

Für den Feed sind Internetzugang und verfügbare Kalenderdaten erforderlich. Die integrierte Ereignisauswahl und das Zeitfenster bleiben unverändert.

Installation und Betrieb

Nutzen Sie MetaTrader 5 für Windows oder einen Windows-VPS mit verbundenem Brokerkonto. Kopieren Sie die EX5-Datei nach „Datei > Datenordner öffnen > MQL5 > Experts“ und aktualisieren Sie den Navigator. Öffnen Sie AUDCAD auf H2, fügen Sie den Expert Advisor (EA) hinzu und aktivieren Sie den algorithmischen Handel. Verwenden Sie eine Instanz pro Produkt und Symbol. Lassen Sie das Terminal oder den VPS geöffnet. DLL-Berechtigungen sind nicht erforderlich.

Wenn das berechnete Volumen unter dem Broker-Mindestbetrag liegt, wird der Einstieg übersprungen. Die Schutzmechanismen für tägliche Verluste, Gesamtrisiko, Margin und Gewinnziel sind im Live-/Demo-Modus aktiv und im Strategietester deaktiviert. Die Filterung historischer Nachrichten wird im Tester nicht dargestellt. Das Tageslimit basiert auf dem Eigenkapital zu Beginn des Broker-Tages bzw. der Initialisierung; das Gewinnziel auf dem Guthaben zum ersten Tick. Beim Erreichen des Schwellenwerts versucht der Expert Advisor (EA), seine eigenen Positionen zu schließen und seine Pending Orders zu löschen. Das Tageslimit ist bis zum nächsten Broker-Tag gesperrt; das Gewinnziel bis zur erneuten Initialisierung. Ein Neustart kann interne Referenzwerte zurücksetzen. Andere Trades beeinflussen die Kontowerte. Limits garantieren keinen maximalen Verlust. Der Handel kann zu Verlusten führen.
제작자의 제품 더 보기
Albion Rhythm
Marcel Thieler
Albion Rhythm GBPUSD H4 Historical statistics Period: 2023-04-26–2026-09-25 Data split: 70% in-sample / 30% out-of-sample (OOS) Cumulative return over the full period: 98.16% Maximum drawdown: 7.44% Trades: 162 Win rate: 45.68% Profit factor: 1.95 Reference-test risk: 1.00% per trade Broker data: Blueberry Markets Pty Ltd Longest losing streak in the reference test: 7 trades Historical reference backtest of the source strategy; these are not live results. This version defaults to 2.00% risk
Alpine Crossing CADCHF H4 Historical statistics Period: 2023-04-28–2026-09-29 Data split: 70% in-sample / 30% out-of-sample (OOS) Cumulative return over the full period: 18.20% Maximum drawdown: 2.34% Trades: 102 Win rate: 65.69% Profit factor: 2.38 Reference-test risk: 1.00% per trade Broker data: Blueberry Markets Pty Ltd Longest losing streak in the reference test: 3 trades Historical reference backtest of the source strategy; these are not live results. This version defaults to 2.00% ris
Alpine Lantern NZDCHF H4 Historical statistics Period: 2023-04-26–2026-09-25 Data split: 70% in-sample / 30% out-of-sample (OOS) Cumulative return over the full period: 25.32% Maximum drawdown: 1.86% Trades: 153 Win rate: 70.59% Profit factor: 2.21 Reference-test risk: 1.00% per trade Broker data: Blueberry Markets Pty Ltd Longest losing streak in the reference test: 3 trades Historical reference backtest of the source strategy; these are not live results. This version defaults to 2.00% risk
Atlantic Compass EURUSD M15 Historical statistics Period: 2023-04-25–2026-09-24 Data split: 70% in-sample / 30% out-of-sample (OOS) Cumulative return over the full period: 45.31% Maximum drawdown: 6.48% Trades: 215 Win rate: 55.81% Profit factor: 1.40 Reference-test risk: 1.00% per trade Broker data: Blueberry Markets Pty Ltd Longest losing streak in the reference test: 6 trades Historical reference backtest of the source strategy; these are not live results. This version defaults to 2.00% r
Atlantic Wick EURUSD H2 Historical statistics Period: 2023-04-10–2026-09-09 Data split: 70% in-sample / 30% out-of-sample (OOS) Cumulative return over the full period: 23.04% Maximum drawdown: 2.37% Trades: 109 Win rate: 76.15% Profit factor: 2.45 Reference-test risk: 1.00% per trade Broker data: Blueberry Markets Pty Ltd Longest losing streak in the reference test: 2 trades Historical reference backtest of the source strategy; these are not live results. This version defaults to 2.00% risk
Continental Wick EURCAD H2 Historische Statistiken Zeitraum: 28.04.2023–29.09.2026 Datenaufteilung: 70 % In-Sample / 30 % Out-of-Sample (OOS) Kumulierte Rendite über den gesamten Zeitraum: 36,98 % Maximaler Drawdown: 5,15 % Transaktionen: 218 Gewinnquote: 61,01 % Gewinnfaktor: 1,68 Referenztestrisiko: 1,00 % pro Trade Brokerdaten: Blueberry Markets Pty Ltd Längste Verlustserie im Referenztest: 5 Trades Historische Referenz-Backtests der Quellstrategie; dies sind keine Live-Ergebnisse. Diese
Copper Current AUDUSD H1 Historical statistics Period: 2023-04-07–2026-09-09 Data split: 70% in-sample / 30% out-of-sample (OOS) Cumulative return over the full period: 44.67% Maximum drawdown: 3.26% Trades: 105 Win rate: 62.86% Profit factor: 2.41 Reference-test risk: 0.40% per trade Broker data: Blueberry Markets Pty Ltd Longest losing streak in the reference test: 3 trades Historical reference backtest of the source strategy; these are not live results. This version defaults to 2.00% risk
Coral Formation NZDUSD H4 Historical statistics Period: 2023-04-26–2026-09-25 Data split: 70% in-sample / 30% out-of-sample (OOS) Cumulative return over the full period: 22.99% Maximum drawdown: 3.10% Trades: 122 Win rate: 58.20% Profit factor: 1.80 Reference-test risk: 1.00% per trade Broker data: Blueberry Markets Pty Ltd Longest losing streak in the reference test: 4 trades Historical reference backtest of the source strategy; these are not live results. This version defaults to 2.00% ris
Coral Wick NZDUSD H2 Historical statistics Period: 2023-04-26–2026-09-25 Data split: 70% in-sample / 30% out-of-sample (OOS) Cumulative return over the full period: 40.29% Maximum drawdown: 3.35% Trades: 189 Win rate: 61.38% Profit factor: 1.86 Reference-test risk: 1.00% per trade Broker data: Blueberry Markets Pty Ltd Longest losing streak in the reference test: 5 trades Historical reference backtest of the source strategy; these are not live results. This version defaults to 2.00% risk per
Crown Tide UK100 H2 Historical statistics Period: 2023-02-03–2026-09-25 Data split: 70% in-sample / 30% out-of-sample (OOS) Cumulative return over the full period: 21.85% Maximum drawdown: 3.40% Trades: 95 Win rate: 76.84% Profit factor: 2.44 Reference-test risk: 1.00% per trade Broker data: Blueberry Markets Pty Ltd Longest losing streak in the reference test: 3 trades Historical reference backtest of the source strategy; these are not live results. This version defaults to 2.00% risk per t
Fern Break NZDCAD H4 Historical statistics Period: 2023-04-26–2026-09-25 Data split: 70% in-sample / 30% out-of-sample (OOS) Cumulative return over the full period: 16.78% Maximum drawdown: 3.49% Trades: 155 Win rate: 66.45% Profit factor: 1.68 Reference-test risk: 1.00% per trade Broker data: Blueberry Markets Pty Ltd Longest losing streak in the reference test: 3 trades Historical reference backtest of the source strategy; these are not live results. This version defaults to 2.00% risk per
Fern Formation NZDCAD H2 Historical statistics Period: 2023-04-26–2026-09-25 Data split: 70% in-sample / 30% out-of-sample (OOS) Cumulative return over the full period: 58.79% Maximum drawdown: 3.30% Trades: 199 Win rate: 63.82% Profit factor: 2.26 Reference-test risk: 1.00% per trade Broker data: Blueberry Markets Pty Ltd Longest losing streak in the reference test: 4 trades Historical reference backtest of the source strategy; these are not live results. This version defaults to 2.00% risk
필터:
리뷰 없음
리뷰 답변