VWZ Range
- 지표
- 버전: 1.26

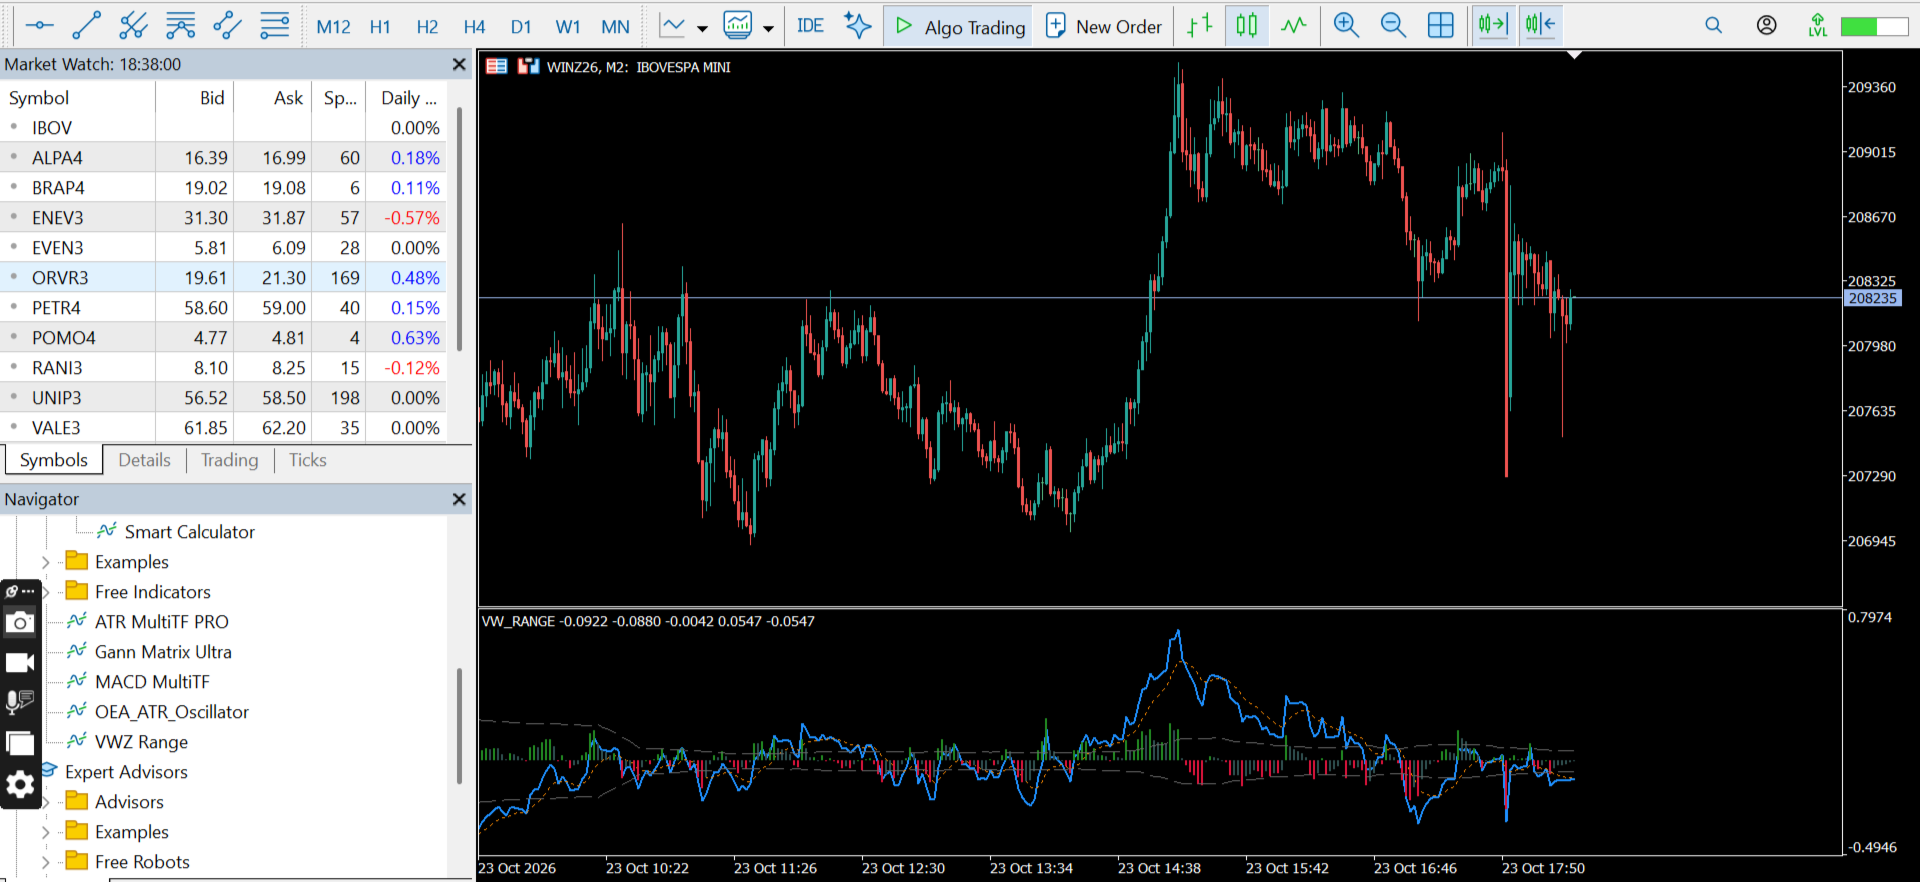
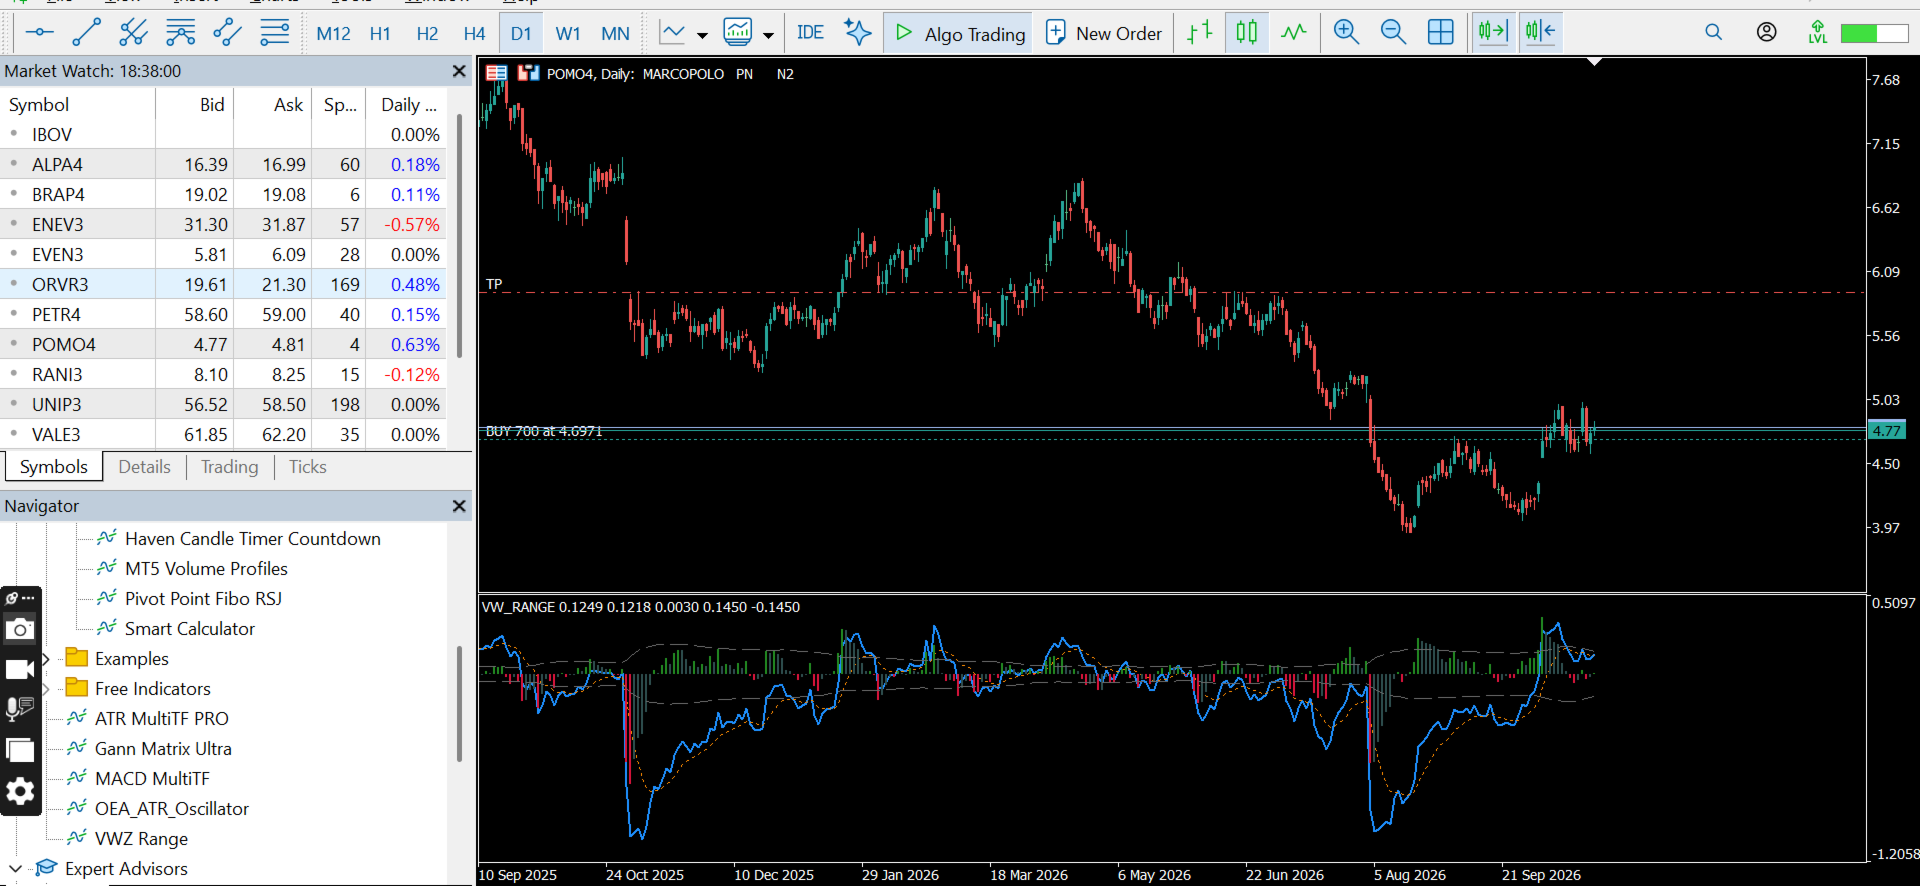
VWZ Range is an institutional-grade hybrid momentum indicator developed for the MetaTrader 5 platform. Designed for advanced and quantitative traders, the indicator integrates a Zero Lag price core (ZLEMA), dynamic ATR (Average True Range) normalization, and relative volume weighting.
Technical Architecture & How It Works
The VWZ Range algorithm was built to address the classic shortcomings of conventional indicators by combining three crucial market dimensions:
-
Zero Lag Price Core (ZLEMA): Utilizes a zero-lag exponential moving average to immediately capture the raw directional price movement, drastically reducing the time lag inherent in traditional moving averages.
-
ATR Normalization: The price momentum delta is divided by the asset's current ATR. This ensures that the indicator adapts seamlessly to varying volatility regimes, normalizing the reading regardless of the asset traded or timeframe used.
-
Relative Volume Weighting: The result is multiplied by the ratio between current volume (supporting Tick Volume or Real/Financial Volume) and the volume moving average. This filters out price impulses that lack relevant volume support, avoiding false signals during low-liquidity conditions.
Price and Volume Interaction
In traditional indicators, volume is treated as a secondary metric or displayed in separate sub-windows that are difficult to correlate in real time. In the VWZ Range, price and volume interact within the same mathematical formula.
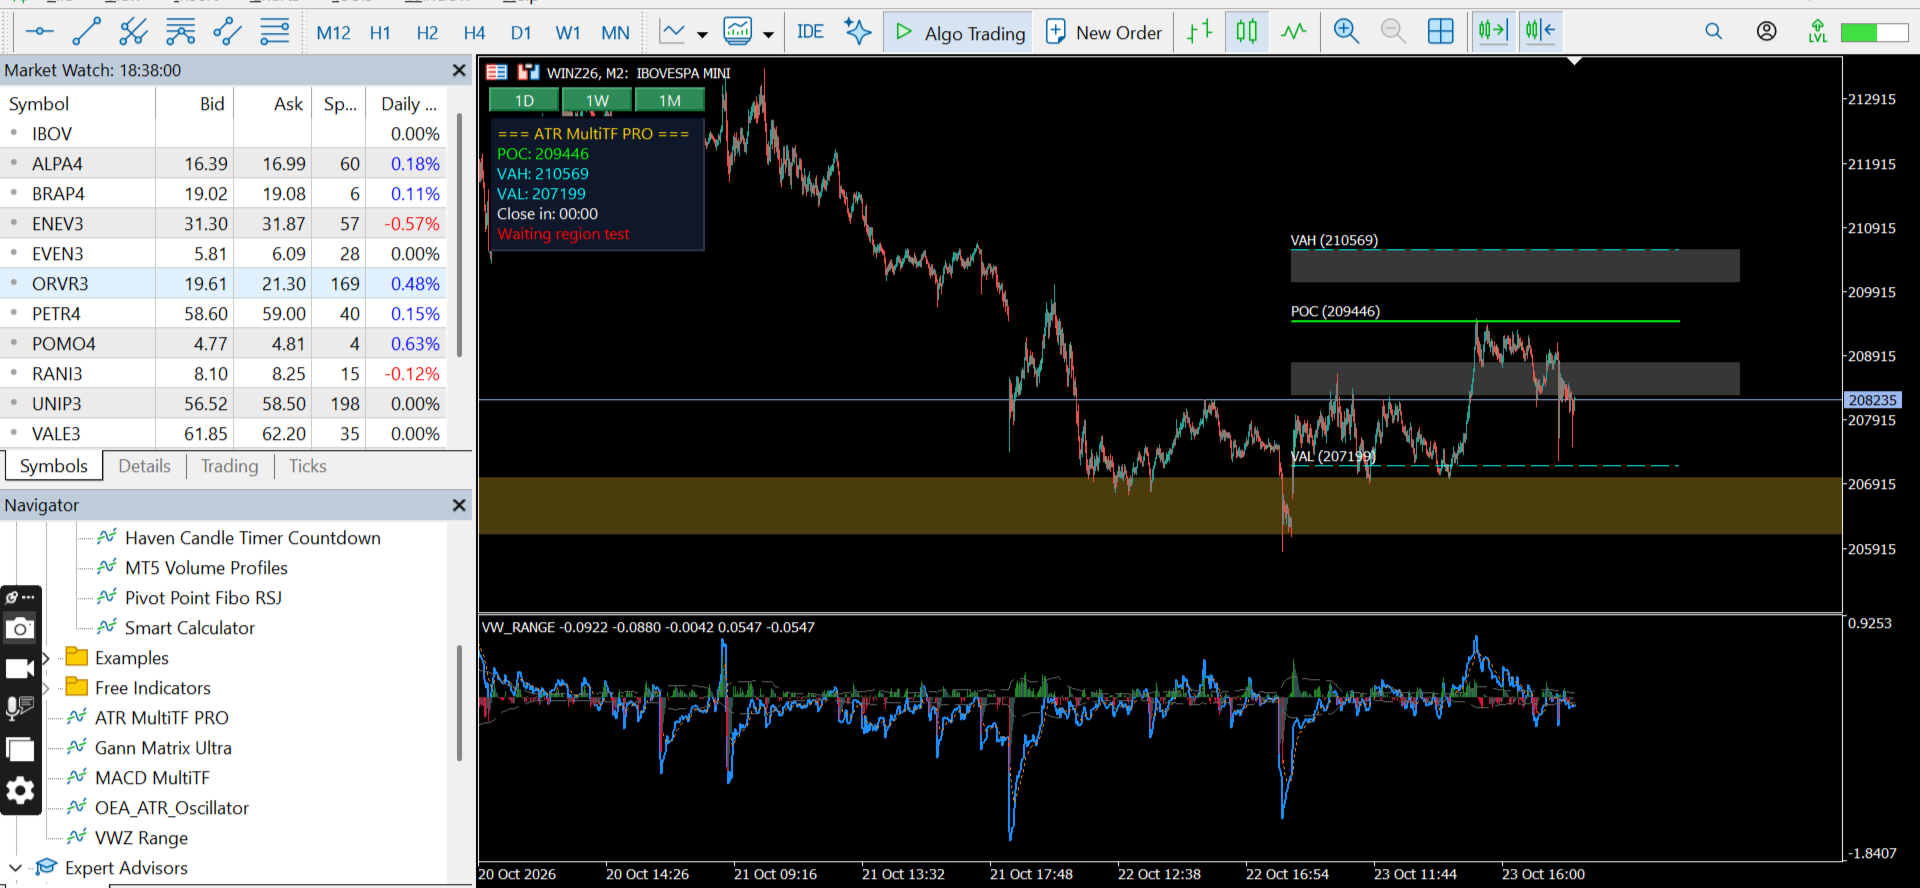
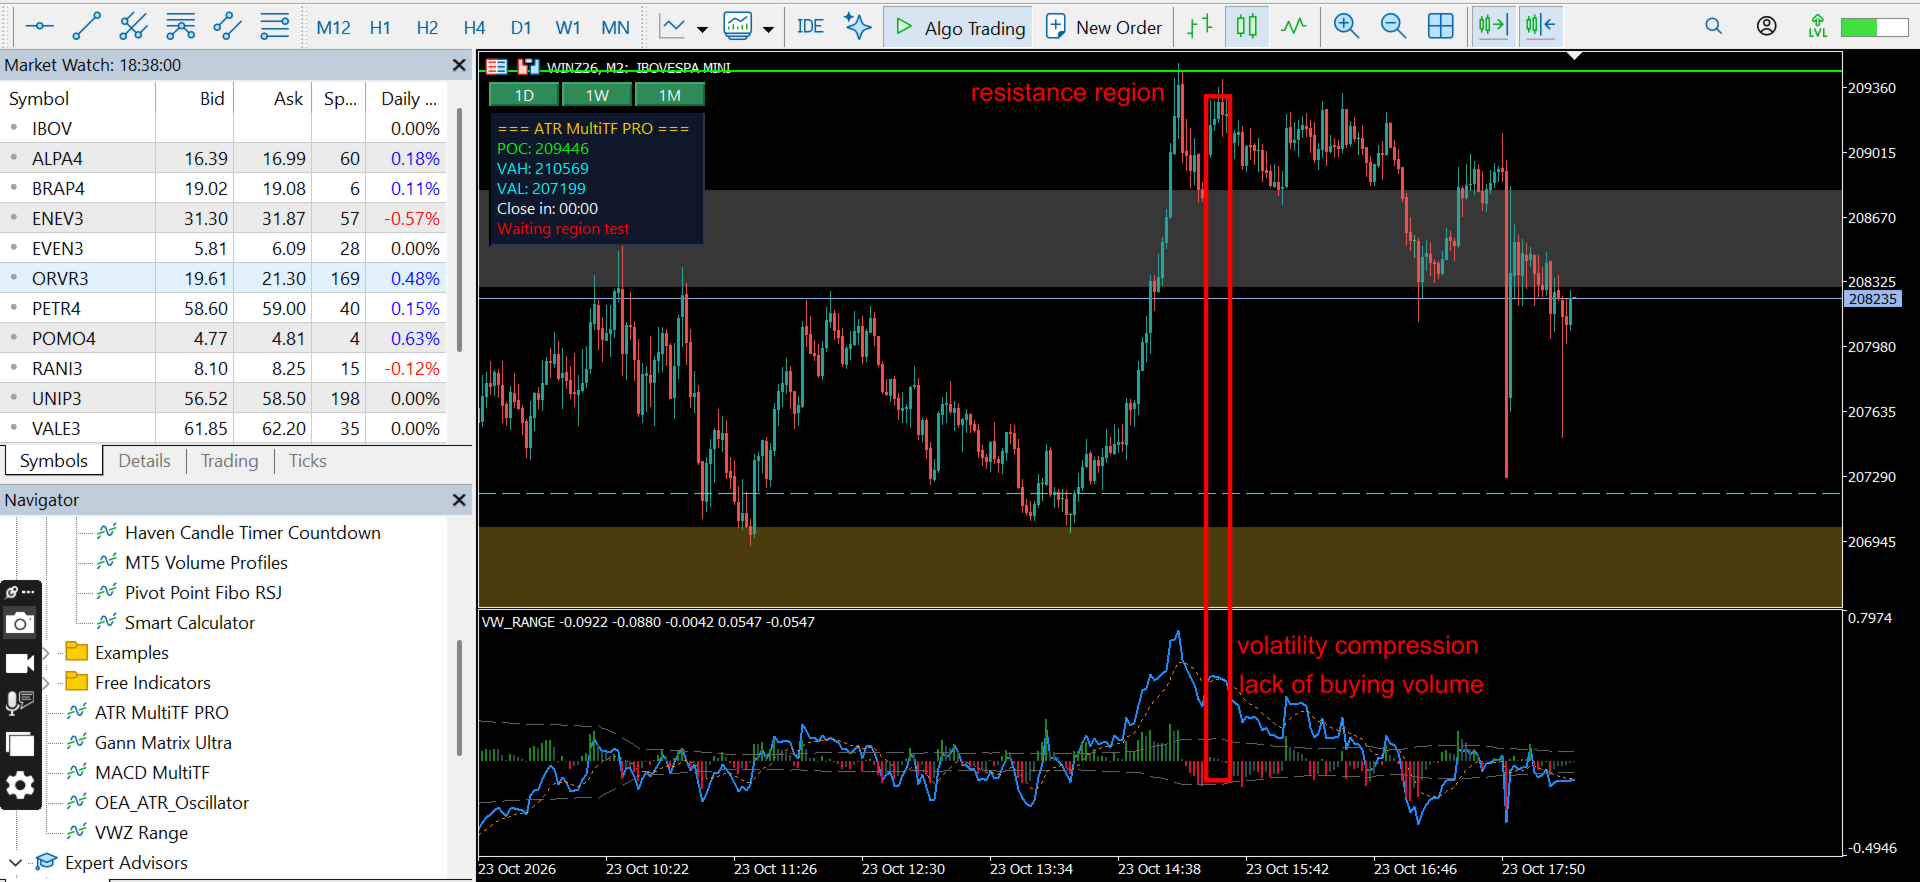
When price moves with above-average volume, the relative volume factor amplifies the signal, highlighting genuine institutional aggression. Conversely, if price moves on low volume, the indicator compresses the reading, signaling a lack of conviction and protecting traders from market traps.
Why Is VWZ Range Superior to Traditional Oscillators?
-
Elimination of Static Overbought/Oversold Zones: Classic oscillators like RSI and Stochastic rely on fixed boundaries (0 to 100 or 20 to 80), causing them to stay pinned in "overbought" or "oversold" territory during strong trends. The VWZ Range oscillates dynamically around a central zero line, adapting to actual market volatility.
-
Reduction of Lag: While standard simple or exponential moving averages delay trend change identification, the ZLEMA core responds almost instantaneously to price shifts.
-
Native Volume Integration: Standard momentum indicators ignore order flow. The VWZ Range uses relative volume to confirm whether momentum is driven by institutional market participants or merely retail noise.
Signal Logic, Breakouts, and Pullbacks
1. Zero Line Crossover
-
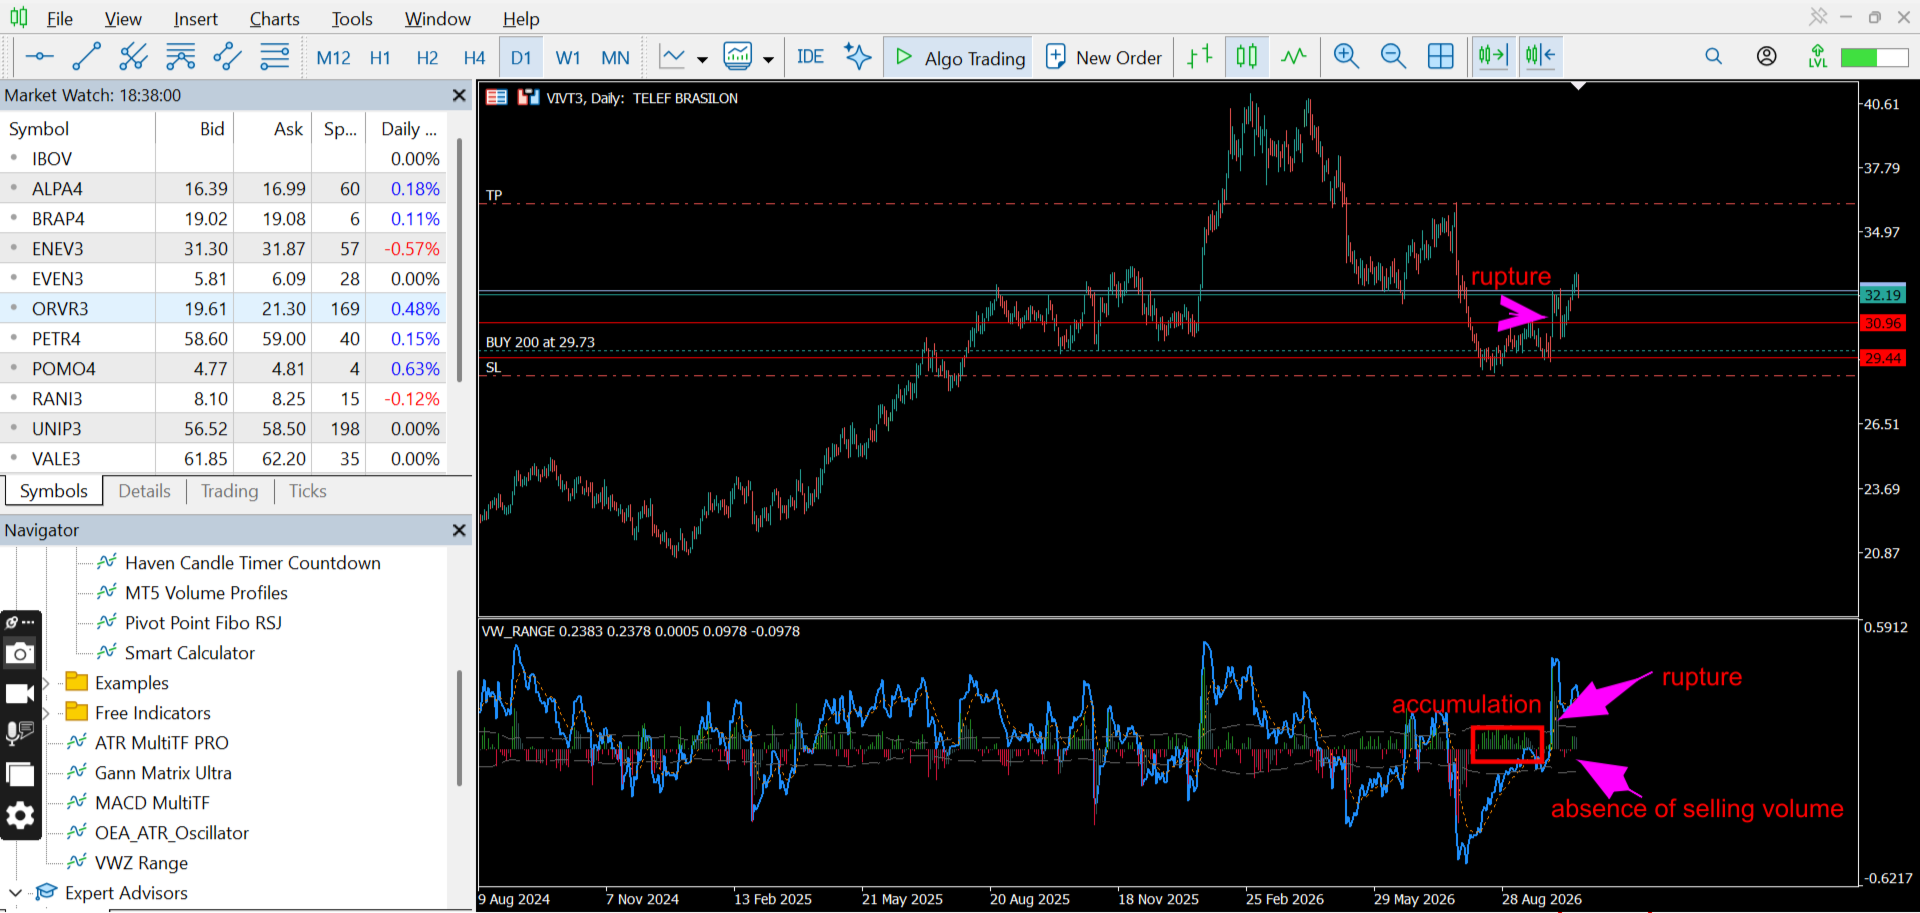
Bullish Crossover: Occurs when the main line crosses above the zero line, indicating that bullish momentum has been validated by volume expansion.
-
Bearish Crossover: Occurs when the main line crosses below the zero line, signaling seller dominance supported by volume.
2. Histogram and Signal Line
-
The indicator features a color-coded histogram based on the difference between the main line and the signal line (EMA).
-
Positive/Negative Acceleration: Color shifts indicate whether momentum is building strength or decelerating, enabling traders to anticipate trend exhaustion before an official reversal occurs.
3. Adaptive Pullback Channels & Breakout Management
The VWZ Range incorporates Adaptive Pullback Channels calculated via the rolling standard deviation of the main line:
-
Identifying Genuine Breakouts: When the main line breaks beyond the upper or lower adaptive channels, the market is experiencing extreme directional volatility, characterizing a legitimate high-energy breakout.
-
False Breakout Filter: Price movements that break traditional chart levels without sufficient volatility and volume support will fail to reach or sustain expansion outside the VWZ Range channels.
-
Mapping Healthy Pullbacks: During established trends, price frequently undergoes short-term corrections. When the indicator pulls back toward the central region while respecting the adaptive channels (without breaking the opposing structure), it marks a healthy pullback—an optimal low-risk entry point to rejoin the primary trend.
Input Parameters & Settings
-
ZLEMA Period (14): Base lookback period for the price momentum core.
-
Relative Volume MA Period (21): Lookback period for calculating average volume.
-
ATR Period (5): Lookback period for volatility normalization.
-
Momentum Smoothing (50): Optional noise filter for smoothing momentum readings.
-
Signal Line Period (9): Period for the signal line EMA crossover.
-
Adaptive Pullback Channels (Enabled / Lookback 50 / Multiplier 0.5): Dynamic volatility channel settings.
-
Volume Settings: Toggle between Tick Volume (Trades) and Real/Financial Volume.
-
Comprehensive Alert System: Customizable Pop-up, Push (Mobile), and Email notifications for zero line and signal crossovers.
COMPLETE CONFIGURATION AND ECOSYSTEM
VWZ Range is provided 100% FREE as an essential volatility and momentum engine. For a complete institutional setup, pair this indicator with our complementary tools:
-
ATR MultiTF PRO: Adds multi-timeframe volatility bands, automated volume alerts, and trend flexibility across daily, weekly, and monthly charts. (https://www.mql5.com/en/market/product/202752)
-
Nexus Chart Trader: Delivers instant execution, automated risk management, and multi-account support directly from the charts. (https://www.mql5.com/en/market/product/202469)