ZoneConfluenceTmk
- 지표
- 버전: 1.10

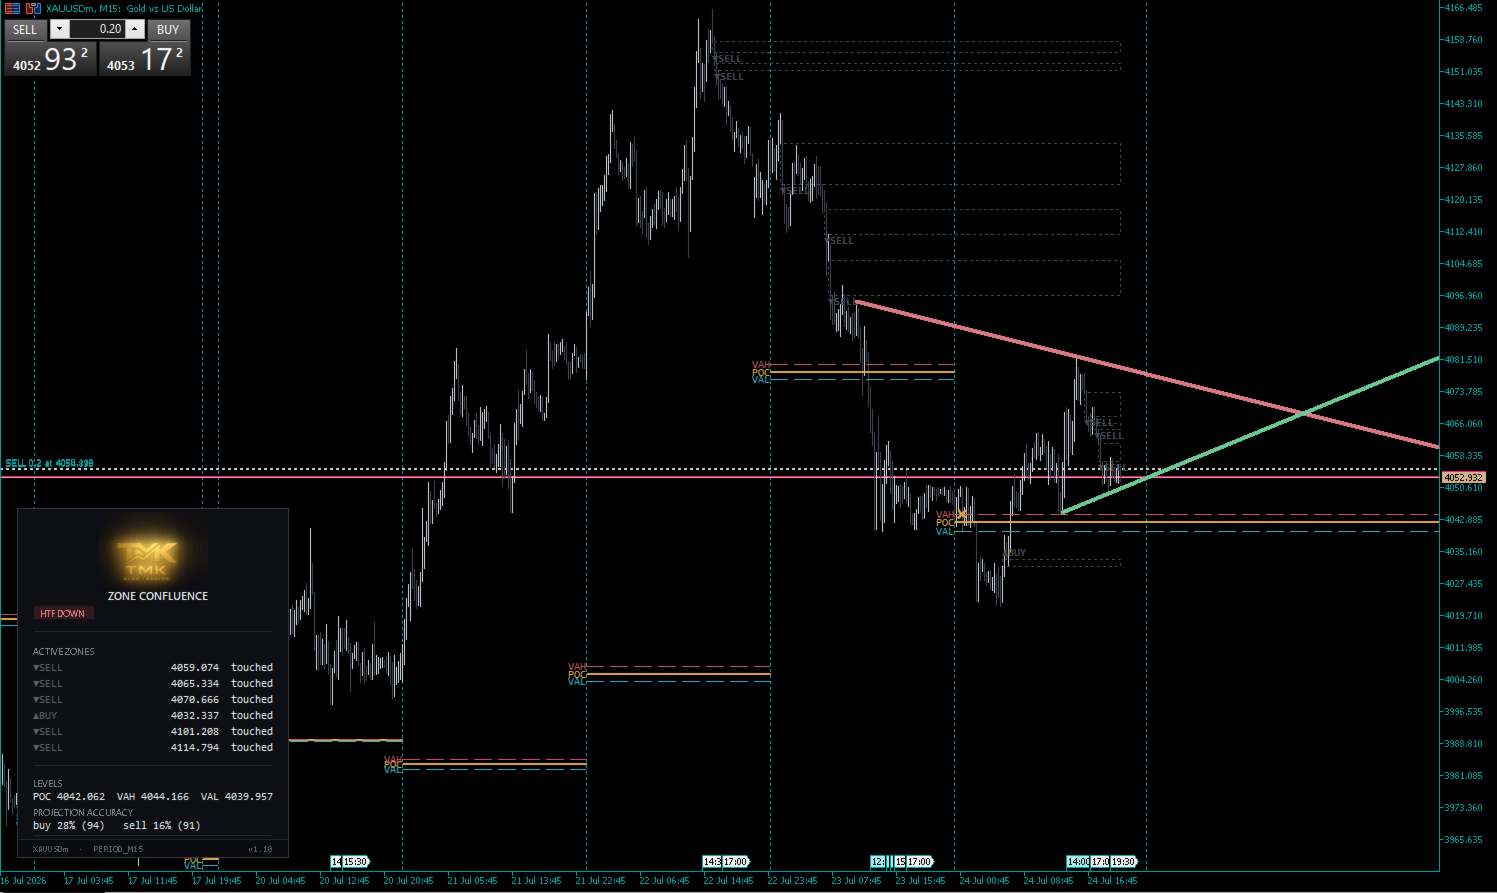
ZoneConfluenceTmk puts three independent reads of the market on a single chart and lets them filter each other: ATR-anchored trend lines show where structure is, a session volume profile shows where volume actually traded (POC / VAH / VAL), and fair value gaps are only kept when they form on the correct side of the POC. You see the gaps that align with the volume picture, not every three-candle imbalance the engine can find.
WHAT IT DOES
Smart trend lines with breakout confirmation. Pivot-based trend lines anchored through prior swings with an ATR wiggle tolerance. A break only counts when the line is old enough, price closes far enough beyond it (ATR-scaled distance), and the break holds for a configurable number of consecutive bars. Failed breaks are marked on the chart as false-break warnings instead of silently disappearing.
Session volume profile (POC / VAH / VAL). Builds a volume profile per day, per week, or per custom session window, then freezes the Point of Control, Value Area High and Value Area Low as horizontal levels when the period closes. Row resolution and value-area percentage are configurable.
POC-filtered fair value gaps. Bullish FVGs are only drawn below the POC, bearish FVGs only above it, so the volume profile acts as a quality filter on the zones. Zones grey out when touched, auto-expire after a configurable number of bars, and are capped so the chart never floods.
Price projection with measured accuracy. After a trend line retest the indicator can draw a forward projection toward the nearest volume level. It also tracks how its own historical projections actually resolved and shows the measured buy and sell hit rate on the panel, together with the sample size. If the measured accuracy on your chart is below your threshold, the projection is not drawn at all. You see what the setup has actually done on your symbol, not a marketing number.
Higher timeframe trend badge. A higher-timeframe EMA read (default H1) shown as an UP or DOWN badge on the panel, so you keep the bigger picture without switching charts.
Clean on-chart panel. Lists the currently active and touched zones with their prices, the live POC / VAH / VAL levels, and the projection accuracy statistics. Two panel positions, fully recolorable.
Performance cap. Processes only the last N bars (configurable) so it stays light even on long histories.
NON-REPAINTING BY DESIGN
All zones, lines and levels are computed from closed bars. The projection is drawn ahead of the last candle only and is never painted onto history.
Works on any symbol and any timeframe: forex, indices, metals, crypto.
This indicator is an analysis and visualization tool. It does not place trades automatically and does not guarantee profit. Always validate on a demo account and combine it with your own risk management.