CleanChartToggle
- 유틸리티
- 버전: 1.0

One-Click Chart Clutter Remover | Instant Clean Mode
One click. Zero clutter. Instant clarity. 🎯
📖 Overview
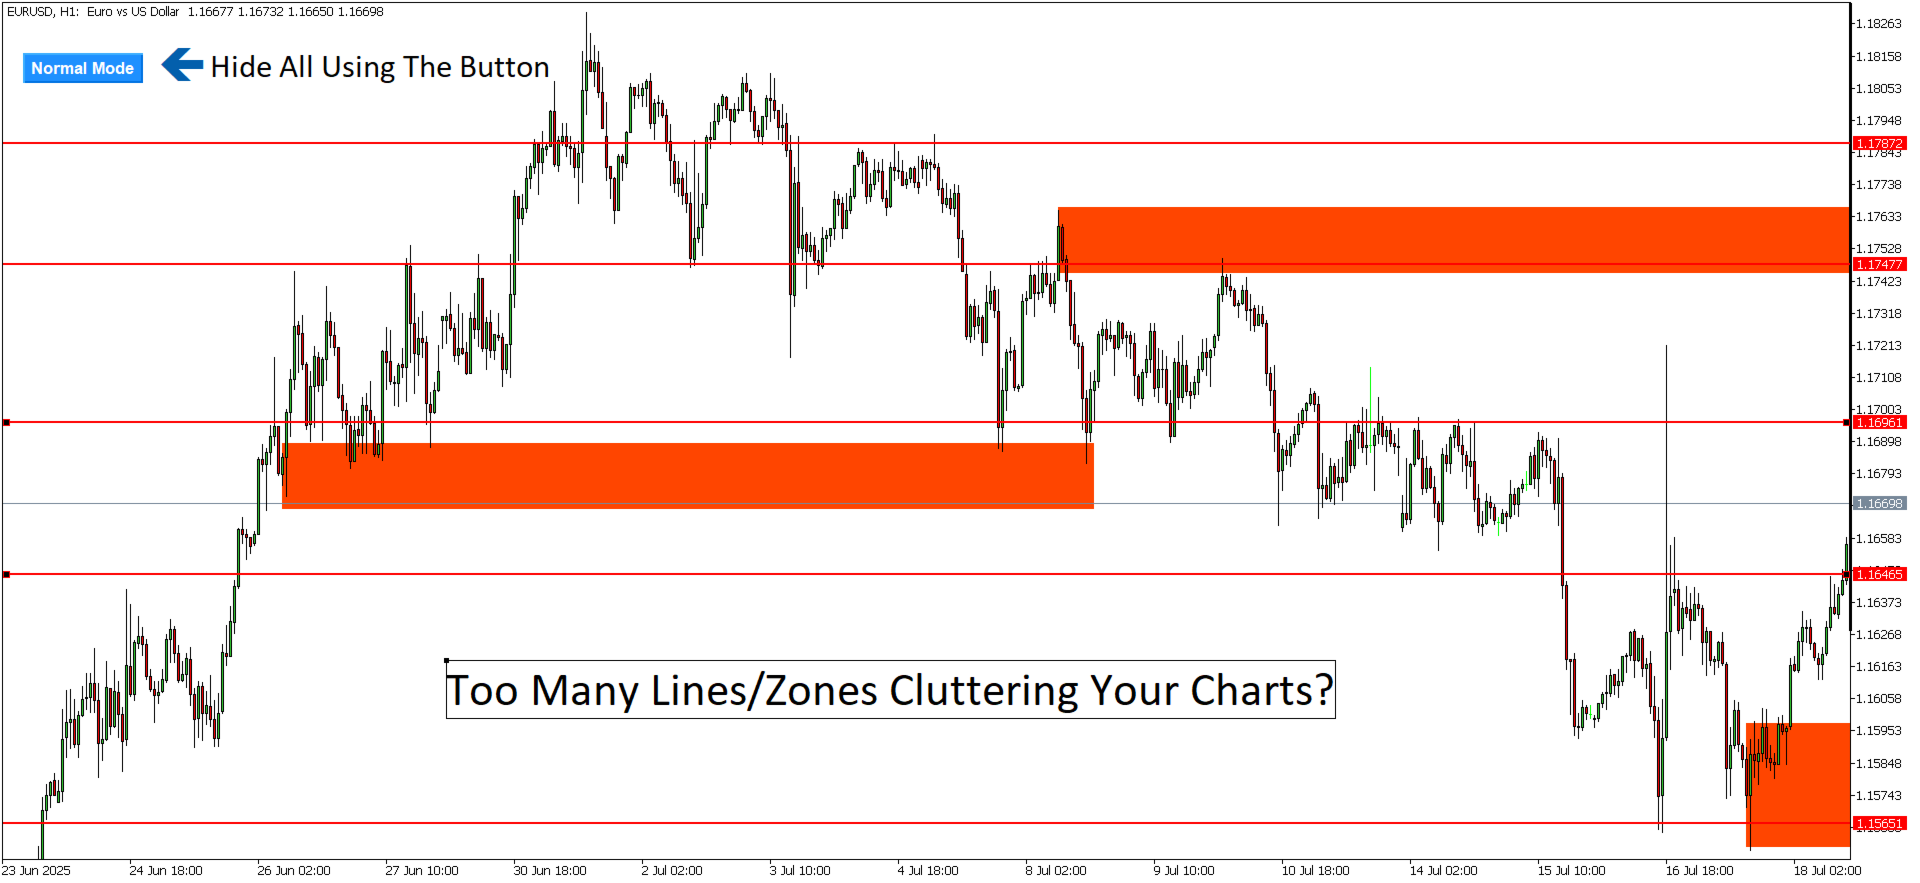
Clean Chart Toggle is a simple yet powerful MetaTrader 4 utility indicator that instantly hides all chart clutter with a single click. Perfect for traders who need a clean workspace for analysis, screenshots, or presentations, this indicator toggles between normal and clean chart modes with visual feedback and customizable controls.
Stop wasting time manually hiding individual elements. One click – and your chart is spotless.
✨ Key Features
| Feature | Benefit |
|---|---|
| One-Click Toggle | Single button press switches between Normal Mode and Clean Mode |
| Instant Clean Mode | Hides ALL chart objects, indicators, grid, bid/ask lines, period separators, volume bars, and OHLC line |
| Automatic Restoration | Returns all chart objects and settings to their original state when toggling back |
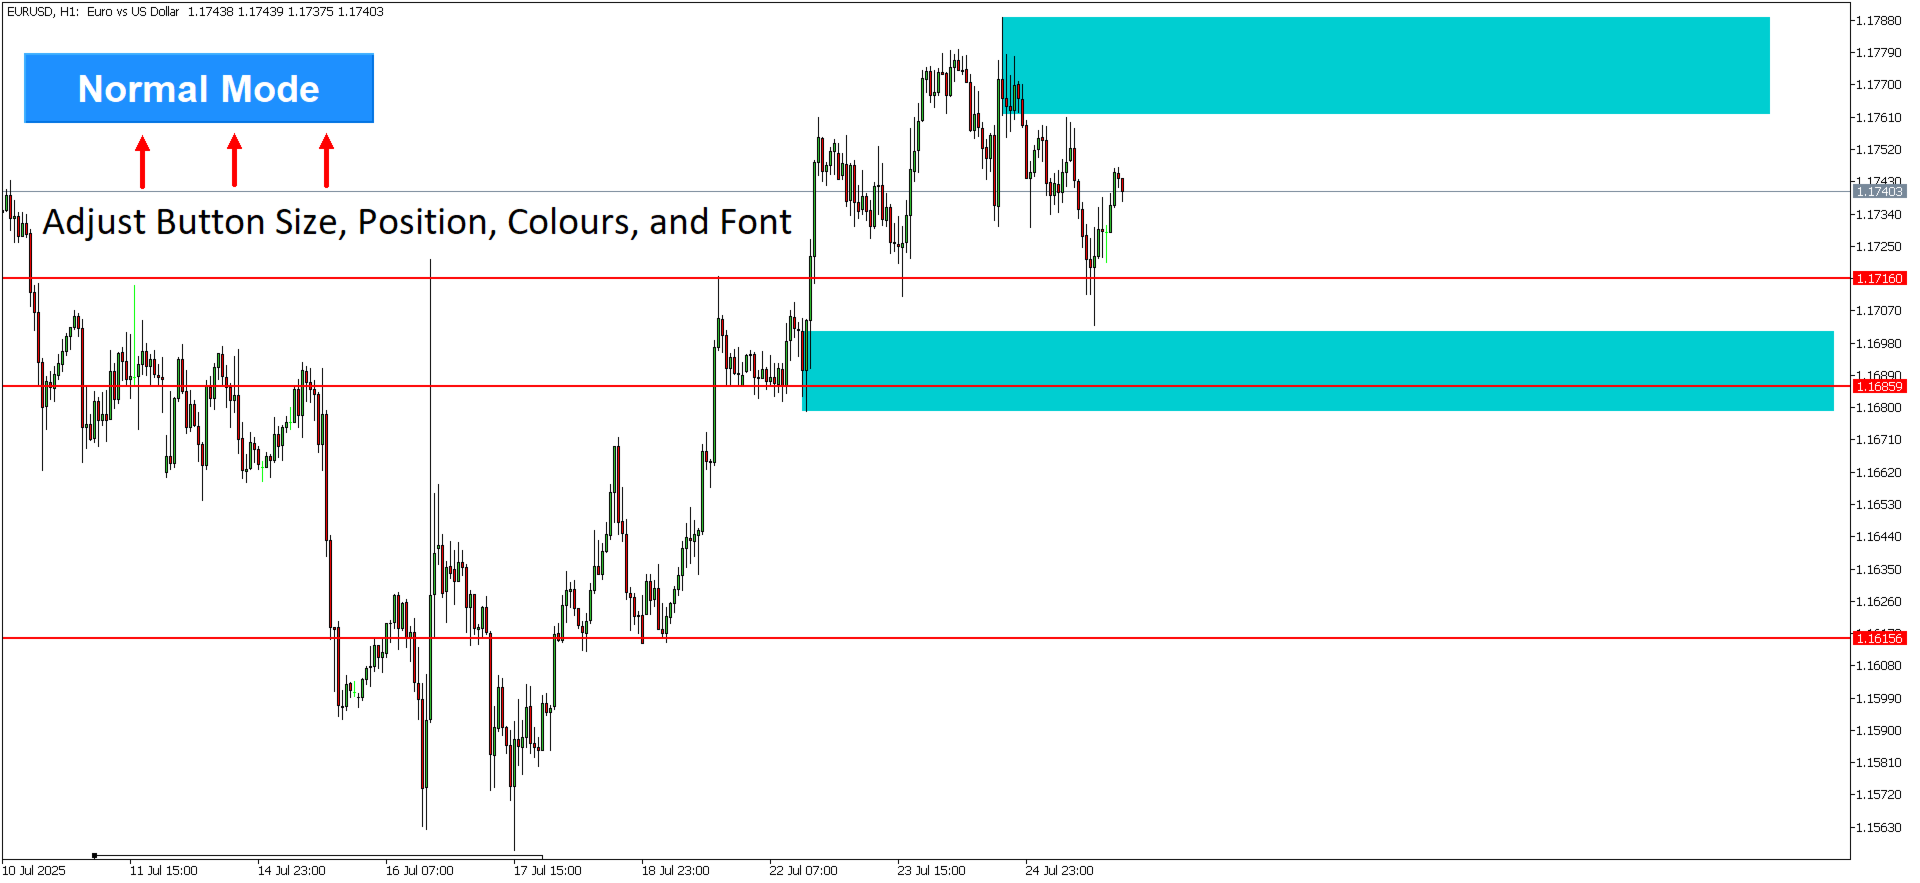
| Visual Feedback | Button changes color to indicate current mode (Blue = Normal / Orange = Clean) |
| Fully Customizable Button | Adjust position, size, colors, and font to match your workspace |
| Preserves Your Setup | Remembers which objects were hidden and restores them exactly |
🧹 What Gets Hidden in Clean Mode
| Category | Hidden Items |
|---|---|
| Chart Objects | Horizontal lines, trend lines, Fibonacci tools, text labels, arrows, shapes, channels, Elliott Wave labels – every drawing object |
| Indicators | All indicators from main chart AND subwindows (⚠️ see note below) |
| Chart Elements | Grid, Ask/Bid price lines, Period separators, Volume bars, OHLC/Last price line |
Before (Normal Mode)
┌─────────────────────────────────────────────────────────────────┐ │ [Chart with: grid, 5 indicators, trend lines, horizontal lines, │ │ ask/bid lines, volume bars, period separators, labels...] │ │ [Normal Mode] │ └─────────────────────────────────────────────────────────────────┘
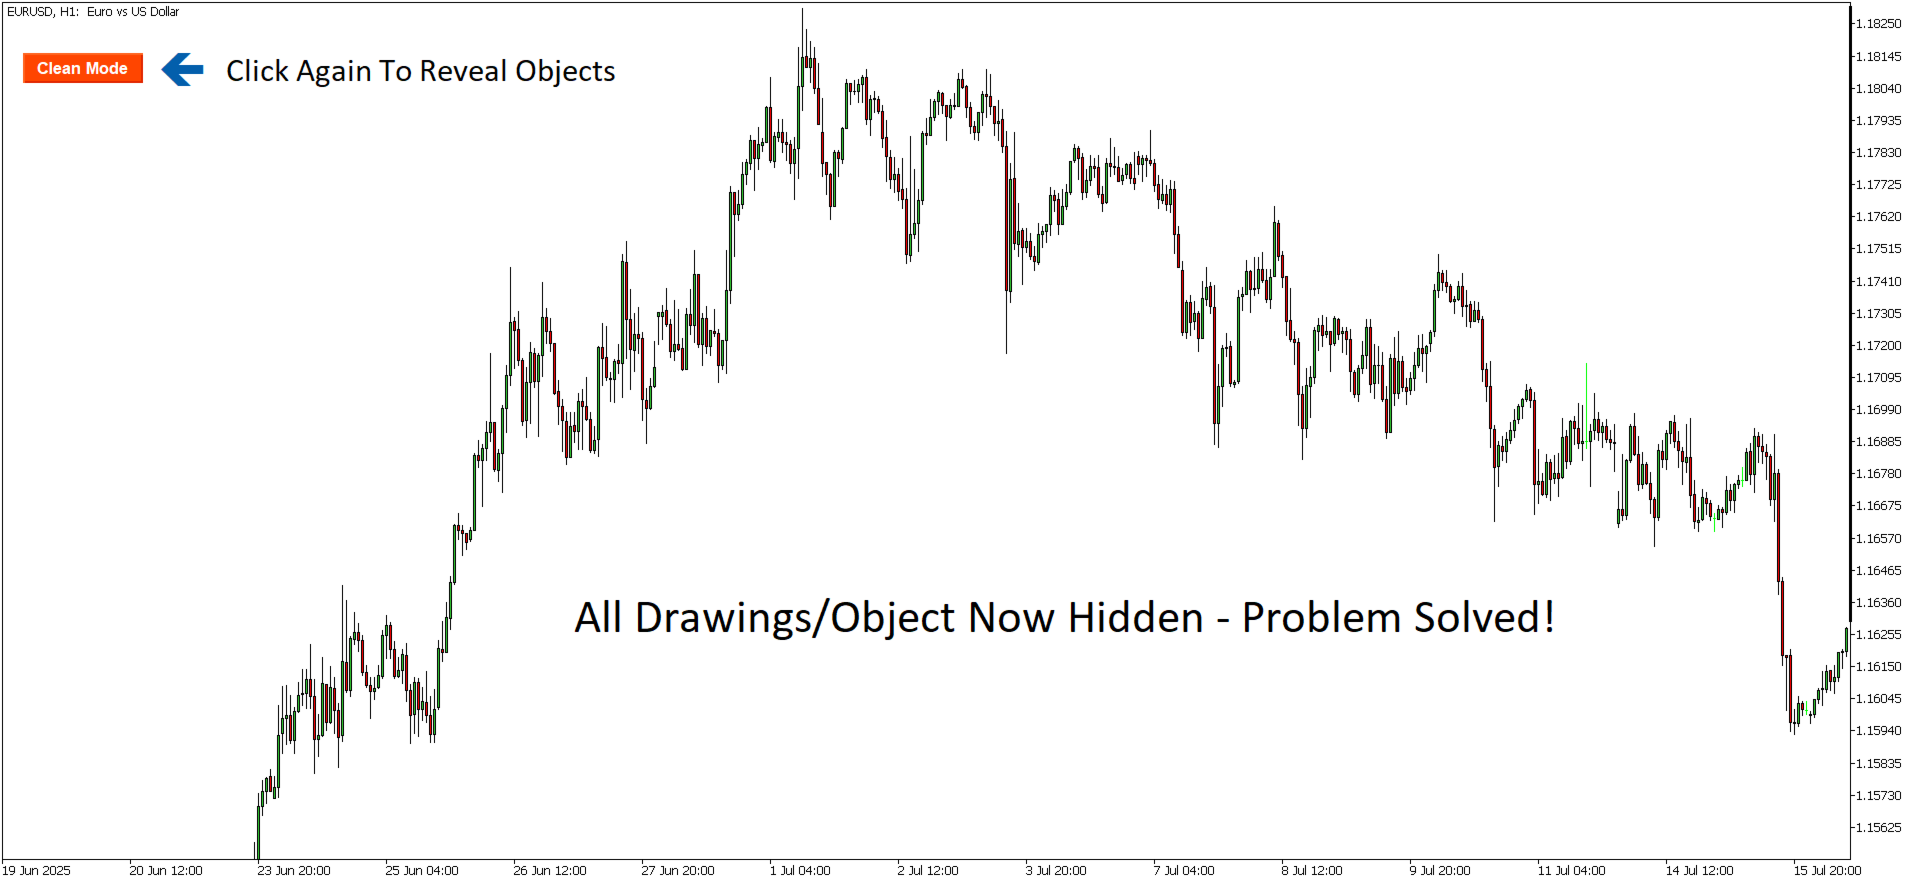
After (Clean Mode)
┌─────────────────────────────────────────────────────────────────┐ │ │ │ CLEAN CHART │ │ (only price candles/bars) │ │ [Clean Mode] │ └─────────────────────────────────────────────────────────────────┘
🖱️ Interactive Controls
| Mode | Button Appearance | What Happens |
|---|---|---|
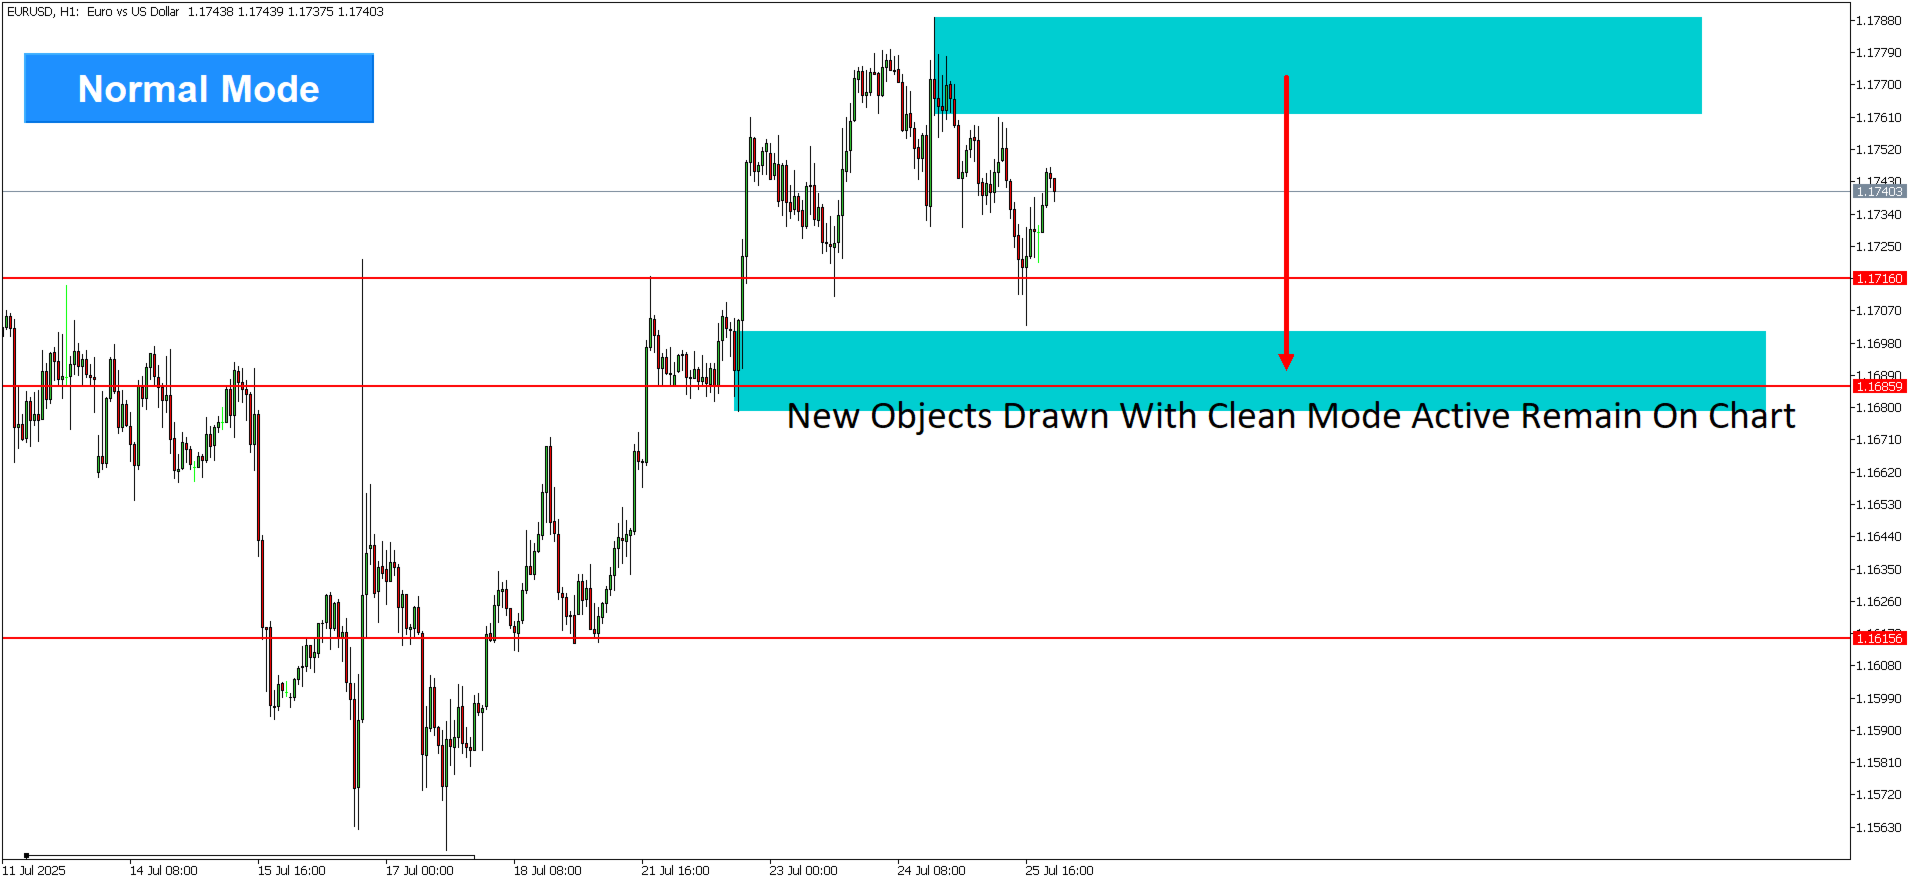
| Normal Mode | Blue button (default) | All chart elements visible |
| Clean Mode | Orange/Red button (default) | All clutter hidden – only price remains |
Click the button to toggle instantly between modes.
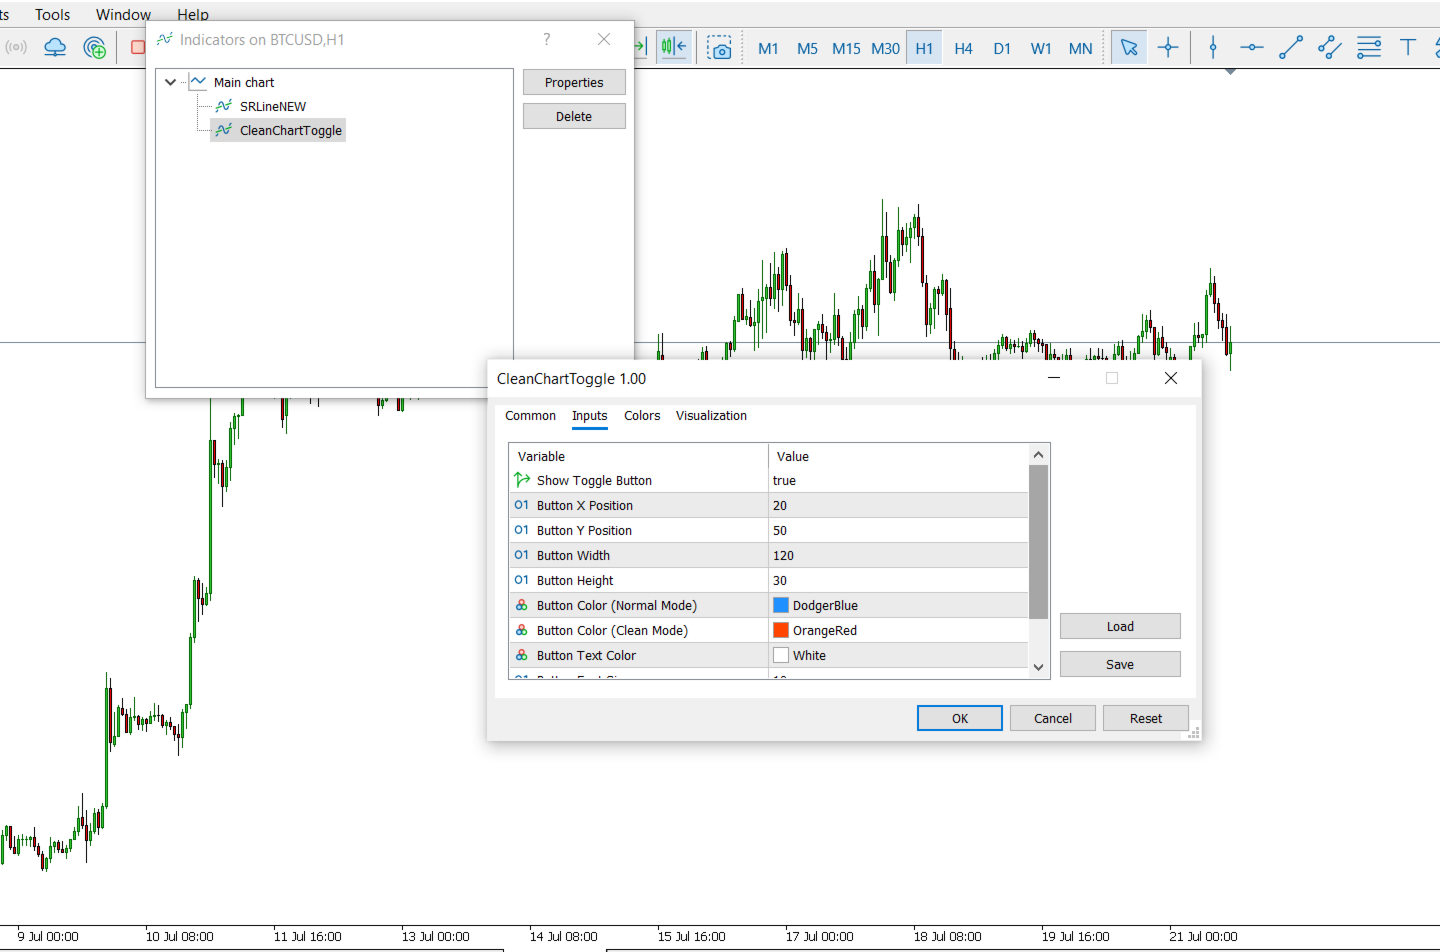
⚙️ Input Parameters (MT4)
Button Settings
| Parameter | Default | Description |
|---|---|---|
| ShowButton | true | Enable/disable the toggle button |
| ButtonX | 20 | Horizontal position (pixels from left edge) |
| ButtonY | 50 | Vertical position (pixels from top edge) |
| ButtonWidth | 120 | Button width in pixels |
| ButtonHeight | 30 | Button height in pixels |
| ButtonColorNormal | DodgerBlue | Button background color in Normal Mode |
| ButtonColorClean | OrangeRed | Button background color in Clean Mode |
| ButtonTextColor | White | Button text color |
| ButtonFontSize | 10 | Button font size |
| ButtonFont | "Arial Bold" | Button font family |
🎨 Button Customization Examples
Example 1: Small, Discreet Button
| Parameter | Value |
|---|---|
| ButtonX | 5 |
| ButtonY | 5 |
| ButtonWidth | 80 |
| ButtonHeight | 20 |
| ButtonFontSize | 8 |
Example 2: Large, Prominent Button
| Parameter | Value |
|---|---|
| ButtonX | 10 |
| ButtonY | 100 |
| ButtonWidth | 150 |
| ButtonHeight | 40 |
| ButtonFontSize | 12 |
| ButtonFont | "Arial Bold" |
Example 3: Alternative Color Scheme
| Parameter | Value |
|---|---|
| ButtonColorNormal | DarkSlateGray |
| ButtonColorClean | Crimson |
| ButtonTextColor | White |
🎯 Use Cases
| Scenario | How Clean Chart Toggle Helps |
|---|---|
| 📸 Screenshot Preparation | Create clean, professional-looking charts for trading journals, social media, client presentations, or educational content |
| 📊 Technical Analysis | Remove distractions to focus purely on price action – see the "naked chart" without indicators clouding your view |
| 📈 Trading Decisions | Toggle between analytical view and clean view to check if your setup still looks valid without indicators |
| 🎓 Teaching & Presentations | Present clean charts to students or colleagues, then add your own annotations without existing clutter |
| 📝 Before/After Comparisons | Create powerful before-and-after images showing the impact of your analysis |
⚠️ Important Note: Indicators Are Permanently Removed
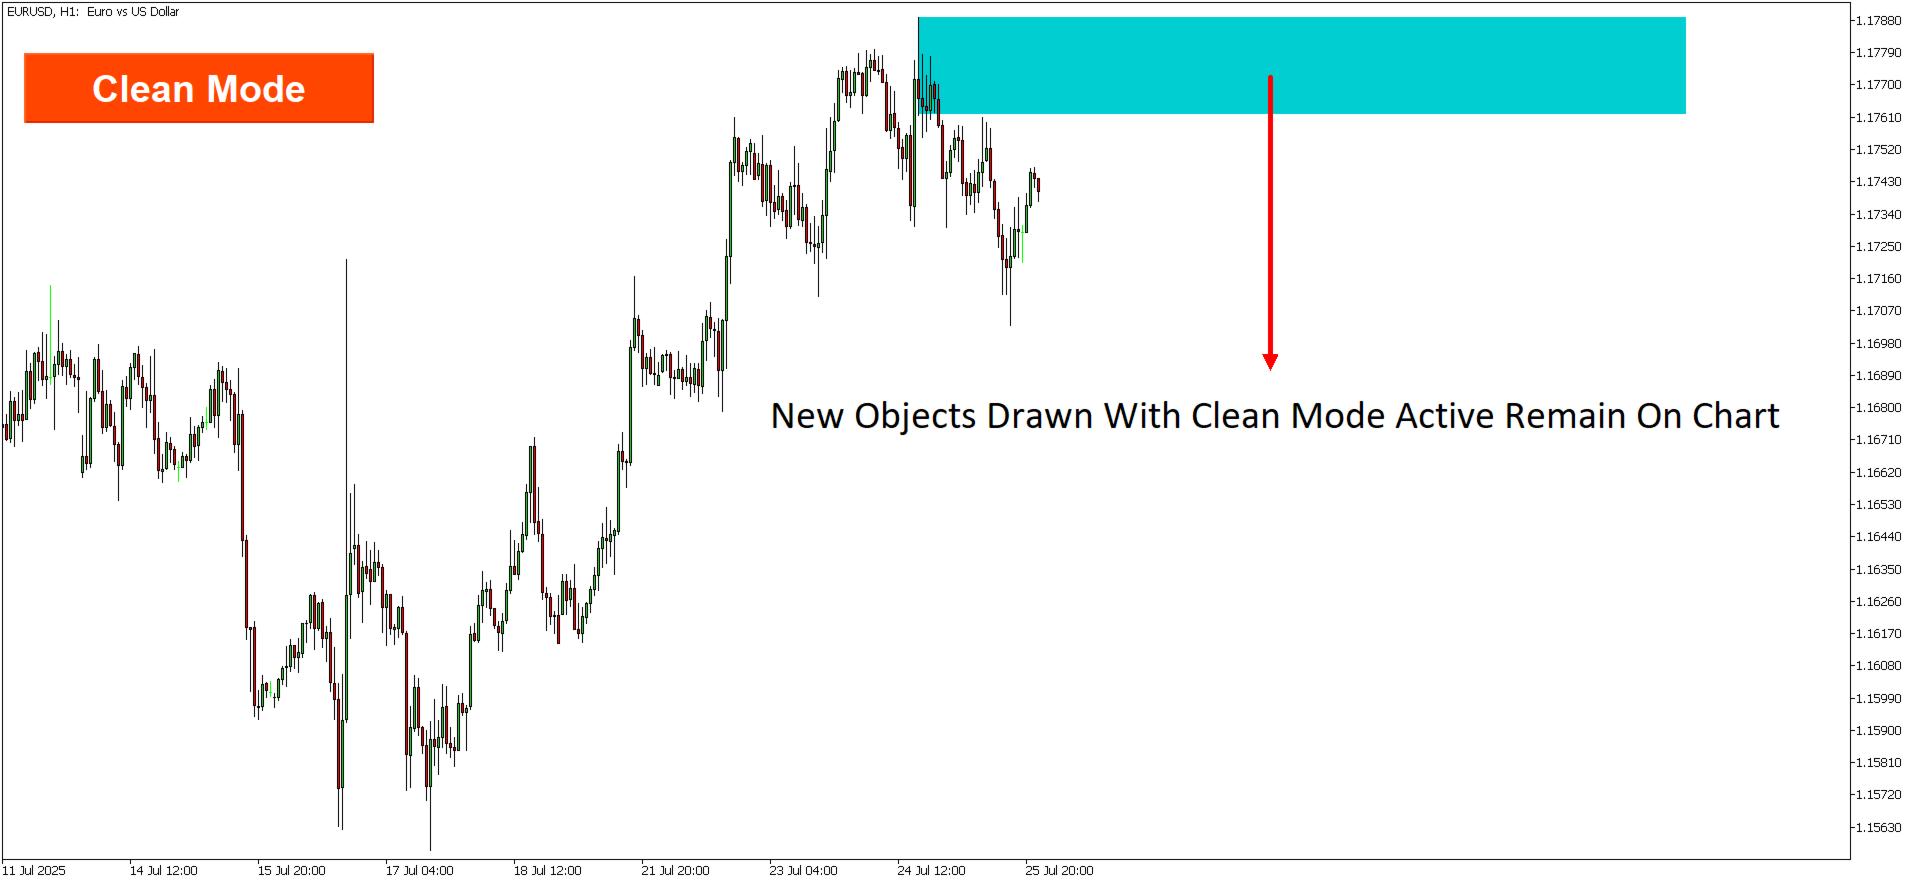
When switching to Clean Mode, all indicators are permanently removed from the chart.
| Action | Normal → Clean | Clean → Normal |
|---|---|---|
| Chart objects (lines, shapes, labels) | Hidden | Restored ✓ |
| Chart settings (grid, bid/ask, etc.) | Hidden | Restored ✓ |
| Indicators | Removed | ✗ NOT restored |
Why? MT4 does not allow indicators to be automatically re-added after removal.
Recommended Workflow
-
Before using Clean Mode, save your chart template:
-
Right-click chart → Template → Save Template
-
Name it (e.g., "My Analysis Setup")
-
-
Click Clean Mode – indicators are removed, but objects and settings are hidden
-
When you want your indicators back:
-
Right-click chart → Template → Load Template
-
Select your saved template
-
This preserves your full setup while still giving you one-click clean access.
🛠️ Technical Details
How It Works
Normal → Clean Mode Transition:
-
Stores current chart settings (grid, ask/bid lines, period separators, etc.)
-
Creates a list of all chart objects (excluding the toggle button)
-
Hides all objects using OBJPROP_TIMEFRAMES = OBJ_NO_PERIODS
-
Removes all indicators from all chart windows
-
Hides grid, ask/bid lines, period separators, volume bars, and OHLC line
-
Changes button color and text
Clean → Normal Mode Transition:
-
Restores chart settings from stored values
-
Restores visibility of all hidden objects using OBJPROP_TIMEFRAMES = OBJ_ALL_PERIODS
-
Changes button color and text back to normal
Multi-Chart Support
| Scope | Behavior |
|---|---|
| Current chart only | Toggle affects only the chart the indicator is attached to |
| Other charts | Unaffected – your other charts remain as-is |
| Global MT4 settings | Unaffected |
🐛 Troubleshooting
| Problem | Solution |
|---|---|
| Indicators not reappearing | Manually re-add indicators or load your saved chart template after returning to Normal Mode |
| Objects still visible after Clean Mode | Some objects may need manual handling – try toggling again |
| Button doesn't respond | Check ShowButton = true and button is within visible chart area |
| Chart looks different after restore | Save your chart template before toggling, then reload it after |
| Subwindow indicators remain | Some subwindow indicators may need manual removal |
| Button not visible | Adjust ButtonX / ButtonY values to bring it on-screen |
💡 Pro Tips
| Tip | Why It Helps |
|---|---|
| Save your chart template first | Essential before using Clean Mode – preserves your indicator setup |
| Use keyboard shortcut | Consider creating a hotkey for this indicator using MT4's custom hotkey system |
| Combine with screenshot tools | Perfect for creating clean trading journal entries |
| Toggle during analysis | Switch between cluttered analysis and clean decision-making views |
| Presentation mode | Use Clean Mode when sharing your screen during trading sessions |
| Adjust button position | Place the button where it won't interfere with your chart analysis |
📦 Installation (MT4)
-
Download Clean_Chart_Toggle.mq4 or .ex4
-
In MT4: File → Open Data Folder → MQL4 → Indicators
-
Copy the file into the Indicators folder
-
Restart MT4 or right-click in Navigator → Refresh
-
Drag Clean Chart Toggle onto your chart
📄 License
This indicator is provided for educational and personal trading use only. Redistribution or commercial use without permission is prohibited.
Clean Chart Toggle – One click. Zero clutter. Instant clarity. 🎯